Products
SentimenTrader Trading Tools
‍
Backtest Engine
My Trading Toolkit
Correlation Analysis
Seasonality
Market Prediction
Indicators & Data API
‍
Proprietary Indicators & Charts
Market Data API
Strategies & Scanner
‍
50+ Trading Strategies
Smart Stock Scanner
Smart Option Scanner
Research Reports
‍
Research Solutions
Reports Library
Free Resources
Simple Backtest Calculator
Simple Seasonality Calculator
The Kelly Criterion Calculator
Sentiment Geo Map
Public Research Reports
Education
Sentiment Indicators
Technical Indicators
Pricing
Company
About
In the News
Testimonials
Client Success Stories
Contact
Log inLoginSign up
< BACK TO ALL REPORTS

A sentiment survey reverses from a pessimistic level

Dean Christians
2023-02-10
The Investors Intelligence % bulls survey cycled from pessimism to a more optimistic outlook. After similar reversals in sentiment, stocks tended to struggle over the next few months. A year later, the S&P 500 was higher 81% of the time.

Key points:

  • The % rank for the Investors Intelligence % bulls survey cycled from < 10% to > 60%
  • After similar reversals in sentiment, the S&P 500 tended to rise over the long-term
  • With sentiment showing more optimism, the market could struggle for a few months

A sentiment survey reverses from deep pessimism to a more optimistic outlook

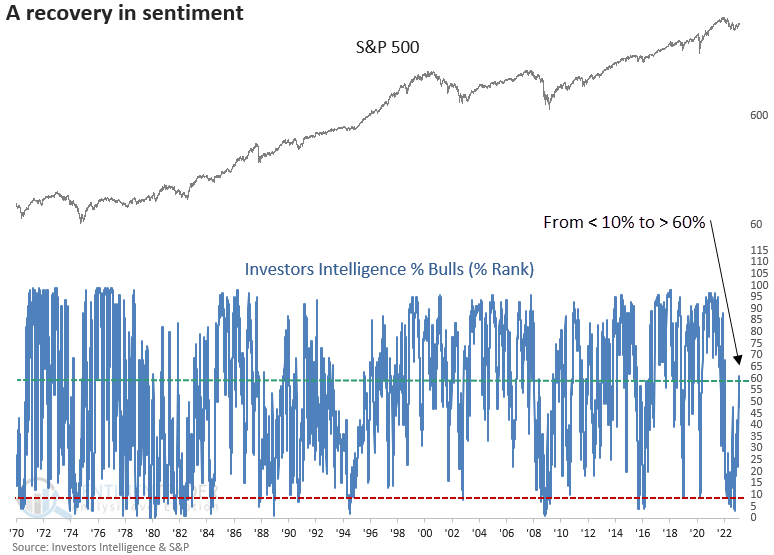
Investors Intelligence released the latest sentiment data this week, with one component, the % bulls survey, climbing to the highest level in more than a year. The recovery occurred from a level typically associated with significant stock market lows.

If I rank the % bulls survey relative to all other values since the inception of the data, the percent rank cycled from < 10% to > 60%.

Let's assess the outlook for stocks after similar conditions.

Similar reversals in sentiment preceded bullish long-term results 

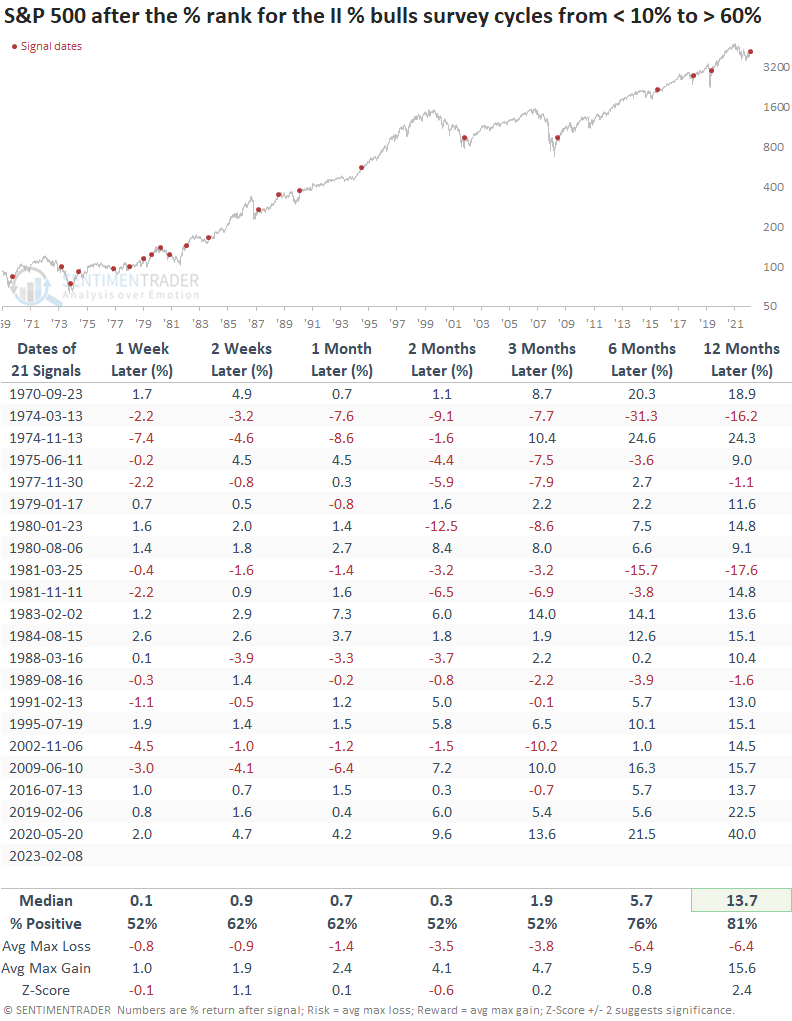
When the % rank for the II % bulls survey cycles from < 10% to > 60%, the S&P 500 tends to see some follow-through in the near term. However, the 2-month window suggests the market could consolidate its recent gains. 

A year later, looks excellent, with only two untimely signals. Interestingly, they both occurred in an inflation/rate environment similar to today. 

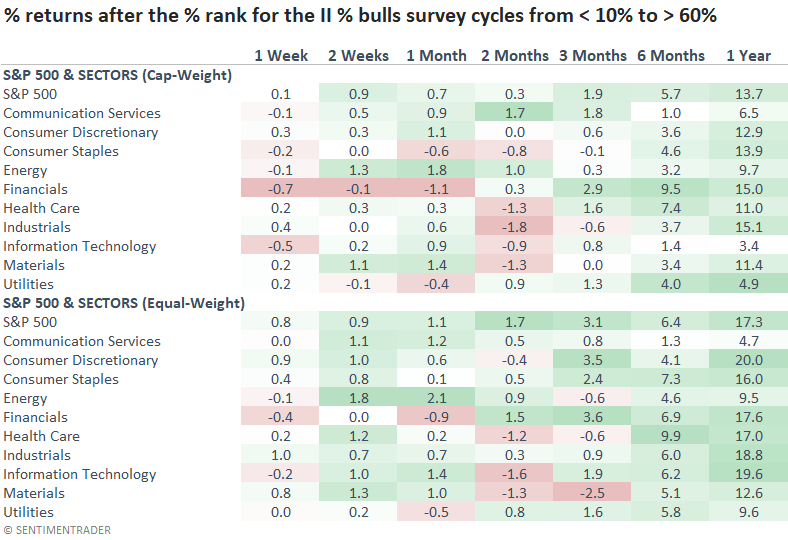
The potential for a market consolidation looks even more pronounced when I apply the signals to sectors, with 6 out of 10 cap-weighted groups showing either flat or negative returns at the 2-month mark. 

What the research tells us...

Stocks have had a nice run since the October low, so it shouldn't be surprising to see sentiment indicators of all types improve from deeply pessimistic levels. One sentiment measure, the Investors Intelligence % bulls survey, reversed from a zone that suggests stocks could be on the road to recovery over the next year. However, we must remember that the road could be bumpy in the next few months.

PRODUCTS
SentimenTrader
Trading Tools
Indicators & Data API
‍
Strategies & Scanner
‍
Research Reports
FREE
RESOUrCES
Simple Backtest
Calculator
Simple Seasonality
Calculator
The Kelly Criterion
Calculator
Sentiment Geo Map
‍
Public Research Reports
‍
Education
Sentiment Indicators
‍
Technical Indicators
‍
Pricing
Bundle pricing
‍
FAQ
‍
Announcements
‍
COMPANY
‍
About
‍
In the News
‍
Testimonials
‍
Client Success Stories
CONTACT
‍
General Inquiries
‍
Media Inquiries
‍
Financial Professionals Inquiries
‍
© 2026 Sundial Capital Research Inc. All rights reserved.
Setsail Marketing
TermsPrivacyAffiliate Program
Risk Disclosure: The information and tools provided are for research and analytical purposes only and are not intended as investment advice. Market analysis involves uncertainty, and outcomes may differ from expectations. Users should conduct their own due diligence and consider their individual circumstances before making any financial decisions. Past performance is not necessarily indicative of future results.

Hypothetical Performance Disclosure: Hypothetical performance results have many inherent limitations, some of which are described below. No representation is being made that any account will or is likely to achieve profits or losses similar to those shown; in fact, there are frequently sharp differences between hypothetical performance results and the actual results subsequently achieved by any particular trading program. One of the limitations of hypothetical performance results is that they are generally prepared with the benefit of hindsight. In addition, hypothetical trading does not involve financial risk, and no hypothetical trading record can completely account for the impact of financial risk of actual trading. for example, the ability to withstand losses or to adhere to a particular trading program in spite of trading losses are material points which can also adversely affect actual trading results. There are numerous other factors related to the markets in general or to the implementation of any specific trading program which cannot be fully accounted for in the preparation of hypothetical performance results and all which can adversely affect trading results.

Testimonial Disclosure: Testimonials appearing on this website may not be representative of other clients or customers and is not a guarantee of future performance or success.