Products
SentimenTrader Trading Tools
‍
Backtest Engine
My Trading Toolkit
Correlation Analysis
Seasonality
Market Prediction
Indicators & Data API
‍
Proprietary Indicators & Charts
Market Data API
Strategies & Scanner
‍
50+ Trading Strategies
Smart Stock Scanner
Smart Option Scanner
Research Reports
‍
Research Solutions
Reports Library
Free Resources
Simple Backtest Calculator
Simple Seasonality Calculator
The Kelly Criterion Calculator
Sentiment Geo Map
Public Research Reports
Education
Sentiment Indicators
Technical Indicators
Pricing
Company
About
In the News
Testimonials
Client Success Stories
Contact
Log inLoginSign up
< BACK TO ALL REPORTS

A sentiment signal with a perfect record just triggered

by Sentimentrader
2025-09-10
For only the 9th time since 1980, the Advisor and Investor Model cycled from below 5% to above 75%, with the S&P 500 hovering near a multi-year high. Comparable signals led to an S&P 500 rally over the subsequent six months every time.

Key points:

  • The Advisor and Investor Model (AIM) cycled from below 5% to above 75%
  • Similar sentiment shifts saw the S&P 500 advance 100% of the time over the next six months 
  • With seasonality suggesting a mid-September consolidation, get ready to buy the dip

A return to optimism

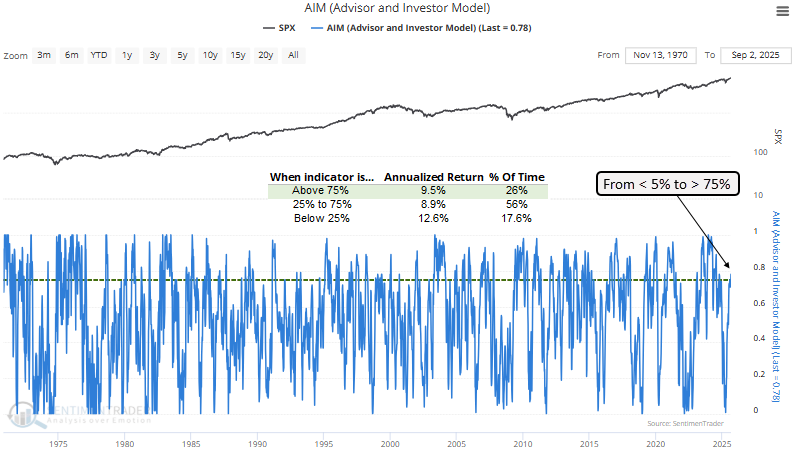
The Advisor and Investor Model, a composite sentiment gauge that blends several measures, has staged a dramatic rebound in recent months. From registering just 1% at the depths of the April low, a level reflecting near-universal pessimism, the model ticked above 75% by the end of last week. 

Such a swift transition from extreme fear to broad-based optimism underscores how decisively investors have embraced the rally.

As we've noted before, bullish sentiment isn't inherently bearish; like valuation, it's a precondition. The risk arises only when optimism reverses from an extreme. The table below shows this dynamic, with AIM readings of 75% yielding an annualized return of 9.5%, exceeding the results when the composite ranged between 25% and 75%. 

A disproportionately positive outlook 

Whenever the AIM indicator rose from below 5% to over 75% and the S&P 500 traded less than 5% shy of a five-year high, the S&P 500 advanced without fail over several horizons. 

For investors wary of stretched valuations or bubble talk, it's worth noting that after a similar signal in 1998, when the Shiller CAPE ratio was at comparable levels, the S&P 500 gained 18% over the following year. 

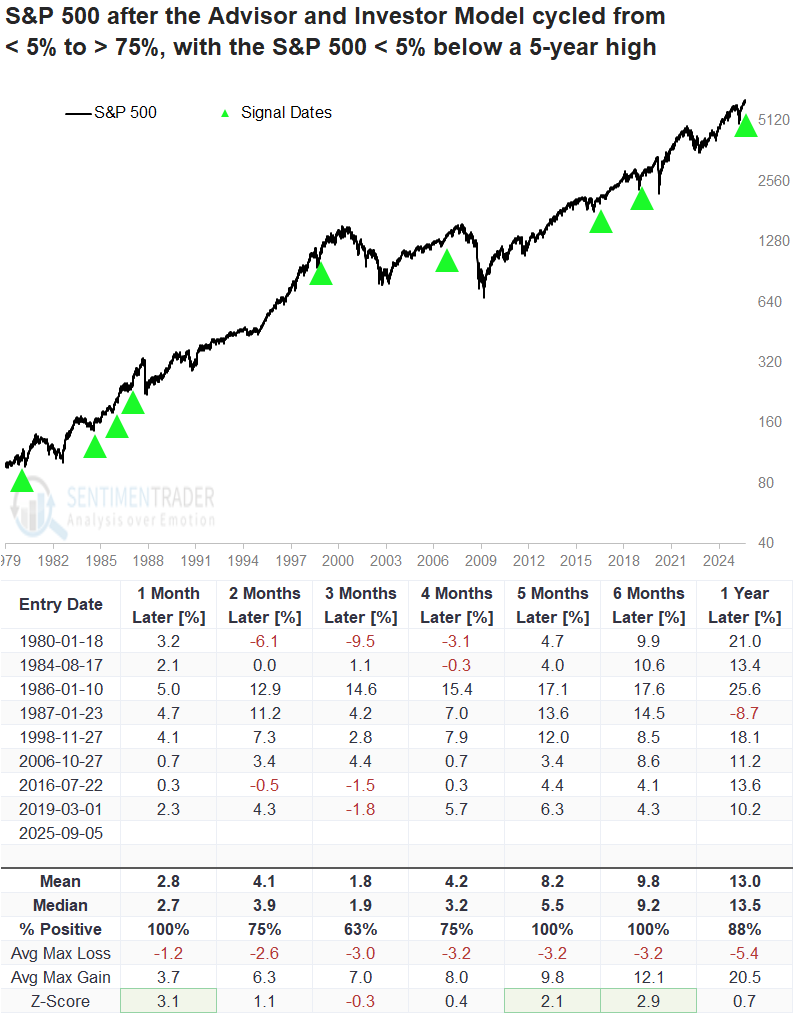
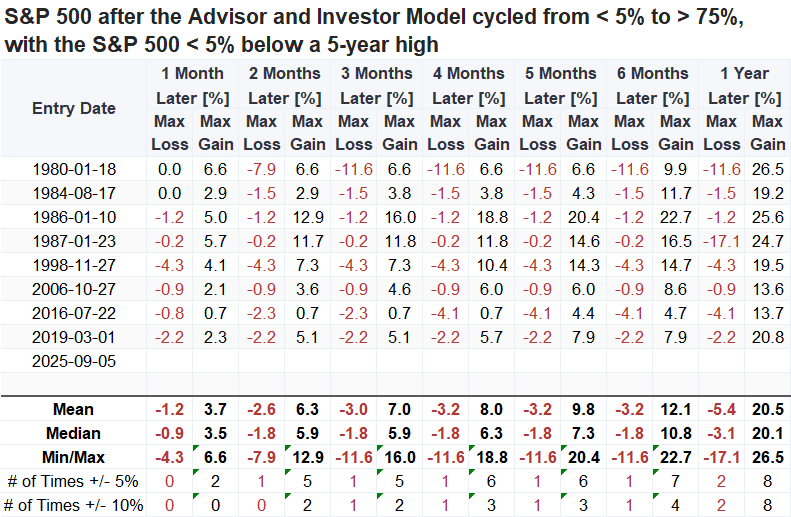
Over the next year, the S&P 500 experienced a decline of more than 10% on two occasions, while it rose by more than 10% in eight instances, indicating a favorable risk/reward profile.
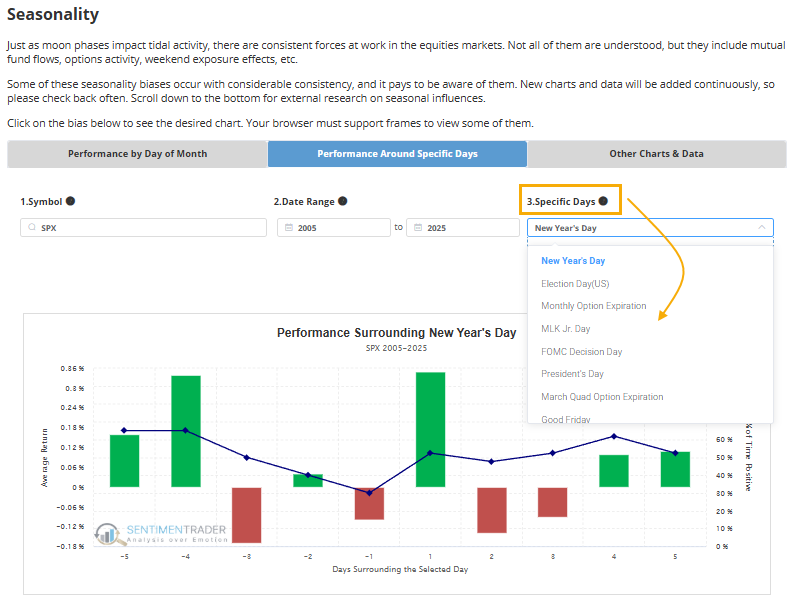
Seasonality 

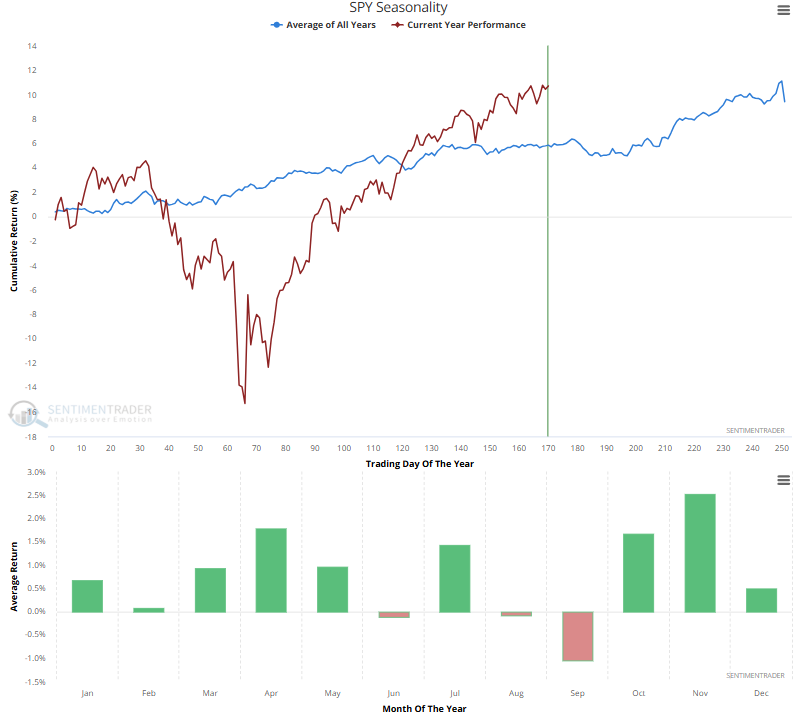
Seasonality for the S&P 500, shown in the chart below, generally peaks in mid-September, coinciding with the September quad witching event, before declining to a trough around mid-October. Investors should use any consolidation during this period to position for a year-end rally.

In the seasonality section on the website, you can zero in on specific events like quad witching, FOMC decision days, and several other options. 

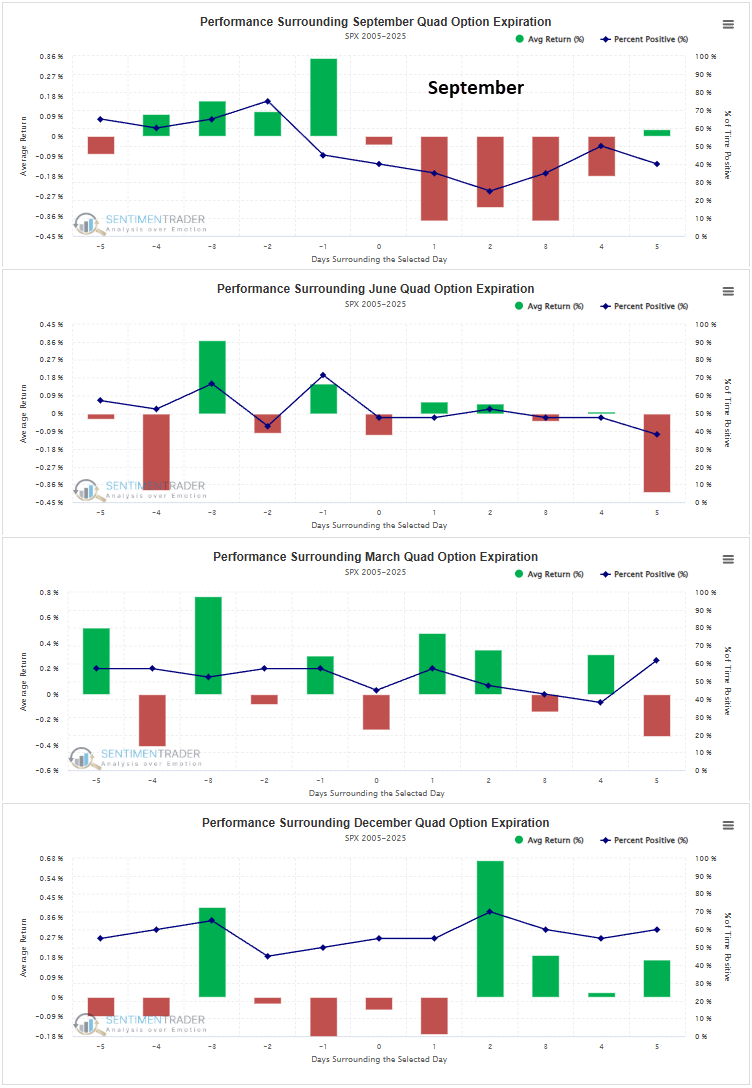
Let's take a look at September quad witching, which refers to the simultaneous expiration of four types of derivative contracts.

The tables below detail performance around quad witching days, highlighting September's pronounced negative bias in the four sessions following Friday's expiration. 
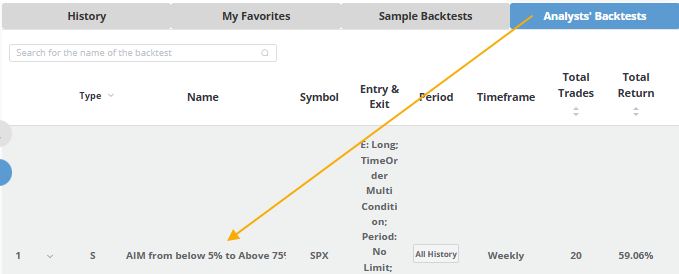
Backtest Engine

Click here to save a copy of this trading signal to your favorites folder in the Backtest Engine. Additionally, you can find a copy in the Analysts' Backtests tab under the name AIM from below 5% to above 75%.

What the research tells us...

The Advisor and Investor Model, a composite measure of market sentiment, recovered from extreme pessimism, cycling from below 5% to above 75%. This move reflects a transition in investors' risk appetite. Historically, similar sentiment shifts near a 5-year high have produced outstanding returns and consistency, with several intervals achieving a 100% win rate. 

With seasonal headwinds approaching, any weakness or consolidation over the next month should be viewed as an opportunity to position for a year-end rally. 

PRODUCTS
SentimenTrader
Trading Tools
Indicators & Data API
‍
Strategies & Scanner
‍
Research Reports
FREE
RESOUrCES
Simple Backtest
Calculator
Simple Seasonality
Calculator
The Kelly Criterion
Calculator
Sentiment Geo Map
‍
Public Research Reports
‍
Education
Sentiment Indicators
‍
Technical Indicators
‍
Pricing
Bundle pricing
‍
FAQ
‍
Announcements
‍
COMPANY
‍
About
‍
In the News
‍
Testimonials
‍
Client Success Stories
CONTACT
‍
General Inquiries
‍
Media Inquiries
‍
Financial Professionals Inquiries
‍
© 2026 Sundial Capital Research Inc. All rights reserved.
Setsail Marketing
TermsPrivacyAffiliate Program
Risk Disclosure: The information and tools provided are for research and analytical purposes only and are not intended as investment advice. Market analysis involves uncertainty, and outcomes may differ from expectations. Users should conduct their own due diligence and consider their individual circumstances before making any financial decisions. Past performance is not necessarily indicative of future results.

Hypothetical Performance Disclosure: Hypothetical performance results have many inherent limitations, some of which are described below. No representation is being made that any account will or is likely to achieve profits or losses similar to those shown; in fact, there are frequently sharp differences between hypothetical performance results and the actual results subsequently achieved by any particular trading program. One of the limitations of hypothetical performance results is that they are generally prepared with the benefit of hindsight. In addition, hypothetical trading does not involve financial risk, and no hypothetical trading record can completely account for the impact of financial risk of actual trading. for example, the ability to withstand losses or to adhere to a particular trading program in spite of trading losses are material points which can also adversely affect actual trading results. There are numerous other factors related to the markets in general or to the implementation of any specific trading program which cannot be fully accounted for in the preparation of hypothetical performance results and all which can adversely affect trading results.

Testimonial Disclosure: Testimonials appearing on this website may not be representative of other clients or customers and is not a guarantee of future performance or success.