
A Sentiment-based Continuation Signal from the Intermediate-Term Optimism Index

A Favorable Continuation Signal from the Intermediate Term Optimism Index
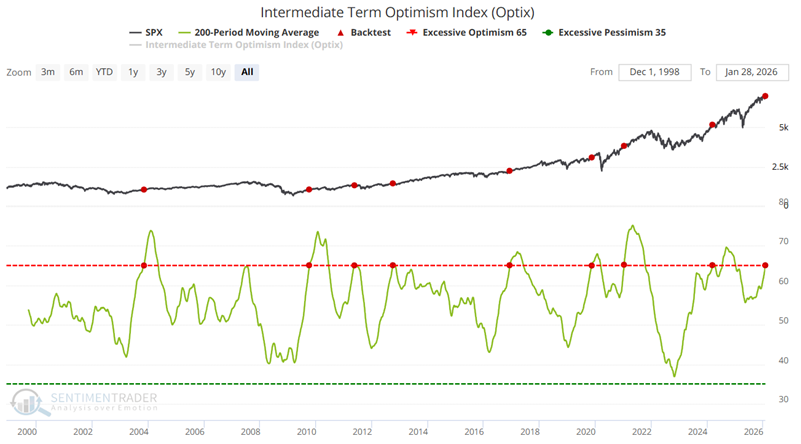
Our Optix indicators are generally used as short-term contrarian indicators. However, applying a long-term moving average can turn them into more of a trend-following tool. One such instance just occurred.
The chart below highlights the dates when the 200-day average of the Intermediate Term Optimism Index crossed above 65 for the first time in 12 months. The most recent signal occurred on January 28th.
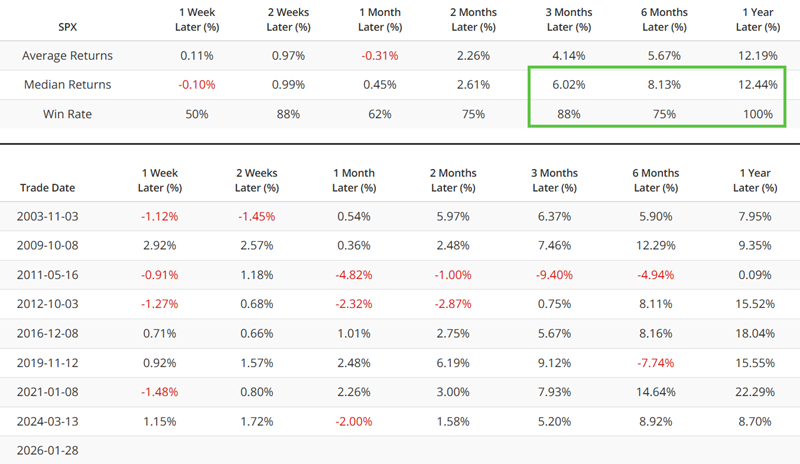
The table below summarizes subsequent S&P 500 index performance.
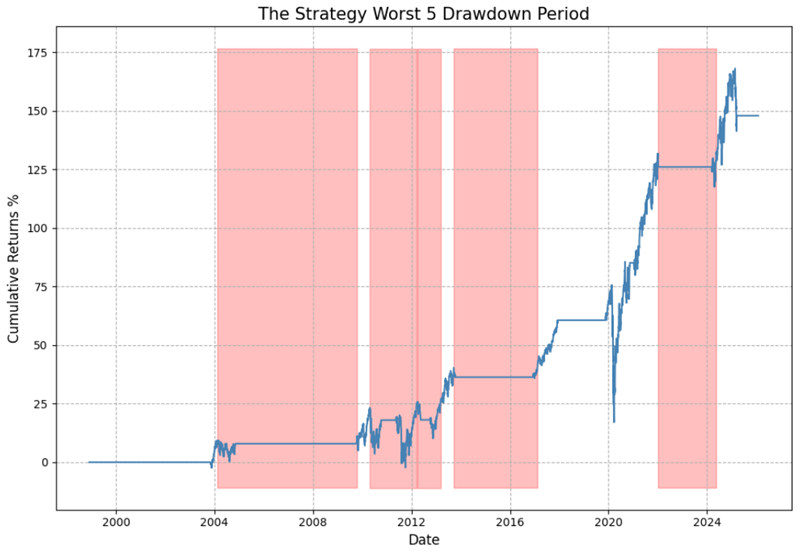
The chart below displays the hypothetical cumulative % +(-) from holding the S&P 500 Index following the signals shown above.
Note that this signal should be viewed merely as a favorable weight of the evidence and not necessarily an automatic buy signal. Note also that Win Rates are solid for three to twelve months after a signal. Median Returns are solid, but unspectacular.
The bottom line: While this does not constitute an outright buy signal, it does add weight to the argument that longer-term investors should continue to give the bullish case the benefit of the doubt in the year ahead.
See also More Indicators Lining Up on the Favorable Side of the Ledger.