
A sell signal that isn't

Key points:
- A large majority of countries are trading above their 50- and 200-day moving averages
- According to published reports, this means that stocks are on the cusp of a "sell" signal
- It's difficult to confirm such a signal, as future returns tended not only to be positive, but also above random
On the cusp of a "sell" signal (?)
Stocks are on the cusp of a major sell signal. Apparently.
Per Bloomberg:
Market watchers use a variety of momentum indicators to call short- and medium-term turning points. Hartnett, for example, says that when more than 88% of country stock indexes tracked by MSCI are above their 50- and 200-day moving averages, it's time to sell, and when more than 88% are trading below, it's a buy. Currently 82% of them are above those moving averages, he says.
That doesn't sound good, so let's check.
From the Global Index Breadth page, we see that as of last week, 84% of markets were above their 50-day moving average and the same percentage above their 200-day moving average. That's a bit below the "sell" threshold, but getting close.
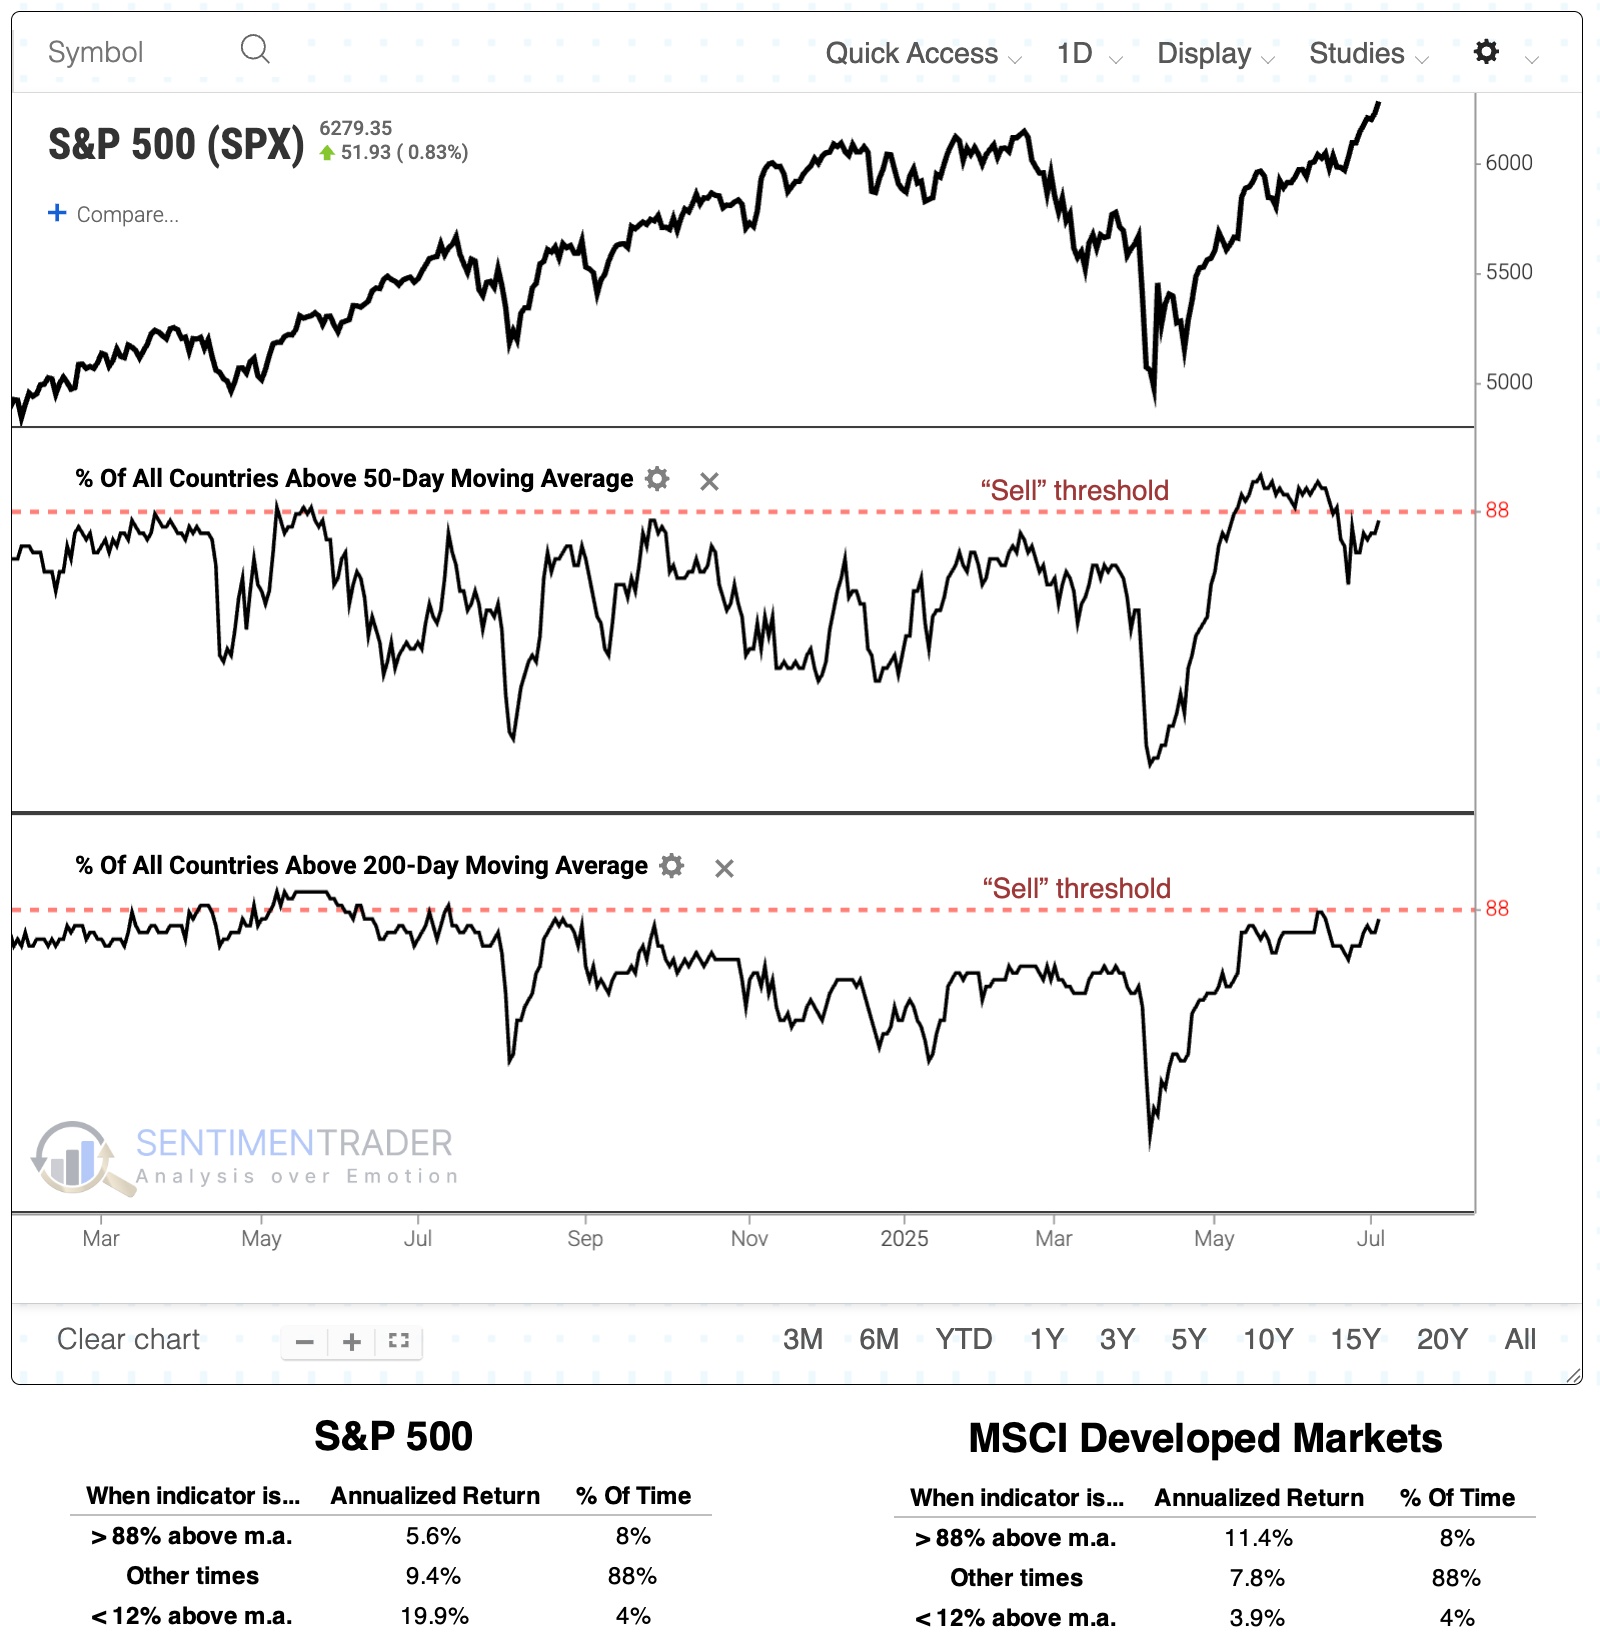
From the threshold analysis above, we can see that when more than 88% of countries are above their 50- and 200-day moving averages, the S&P 500 has returned an annualized +5.6%. That's not horrible, but it's well below the other regimes. Conversely, the MSCI Developed Markets index showed its best annualized returns when above the "sell" threshold.
From the figures above, we may assume that when more than 88% of countries are above their averages, it would be better to own other developed markets rather than the S&P 500. When fewer than 12% of them are above average, then own the S&P instead of other markets.
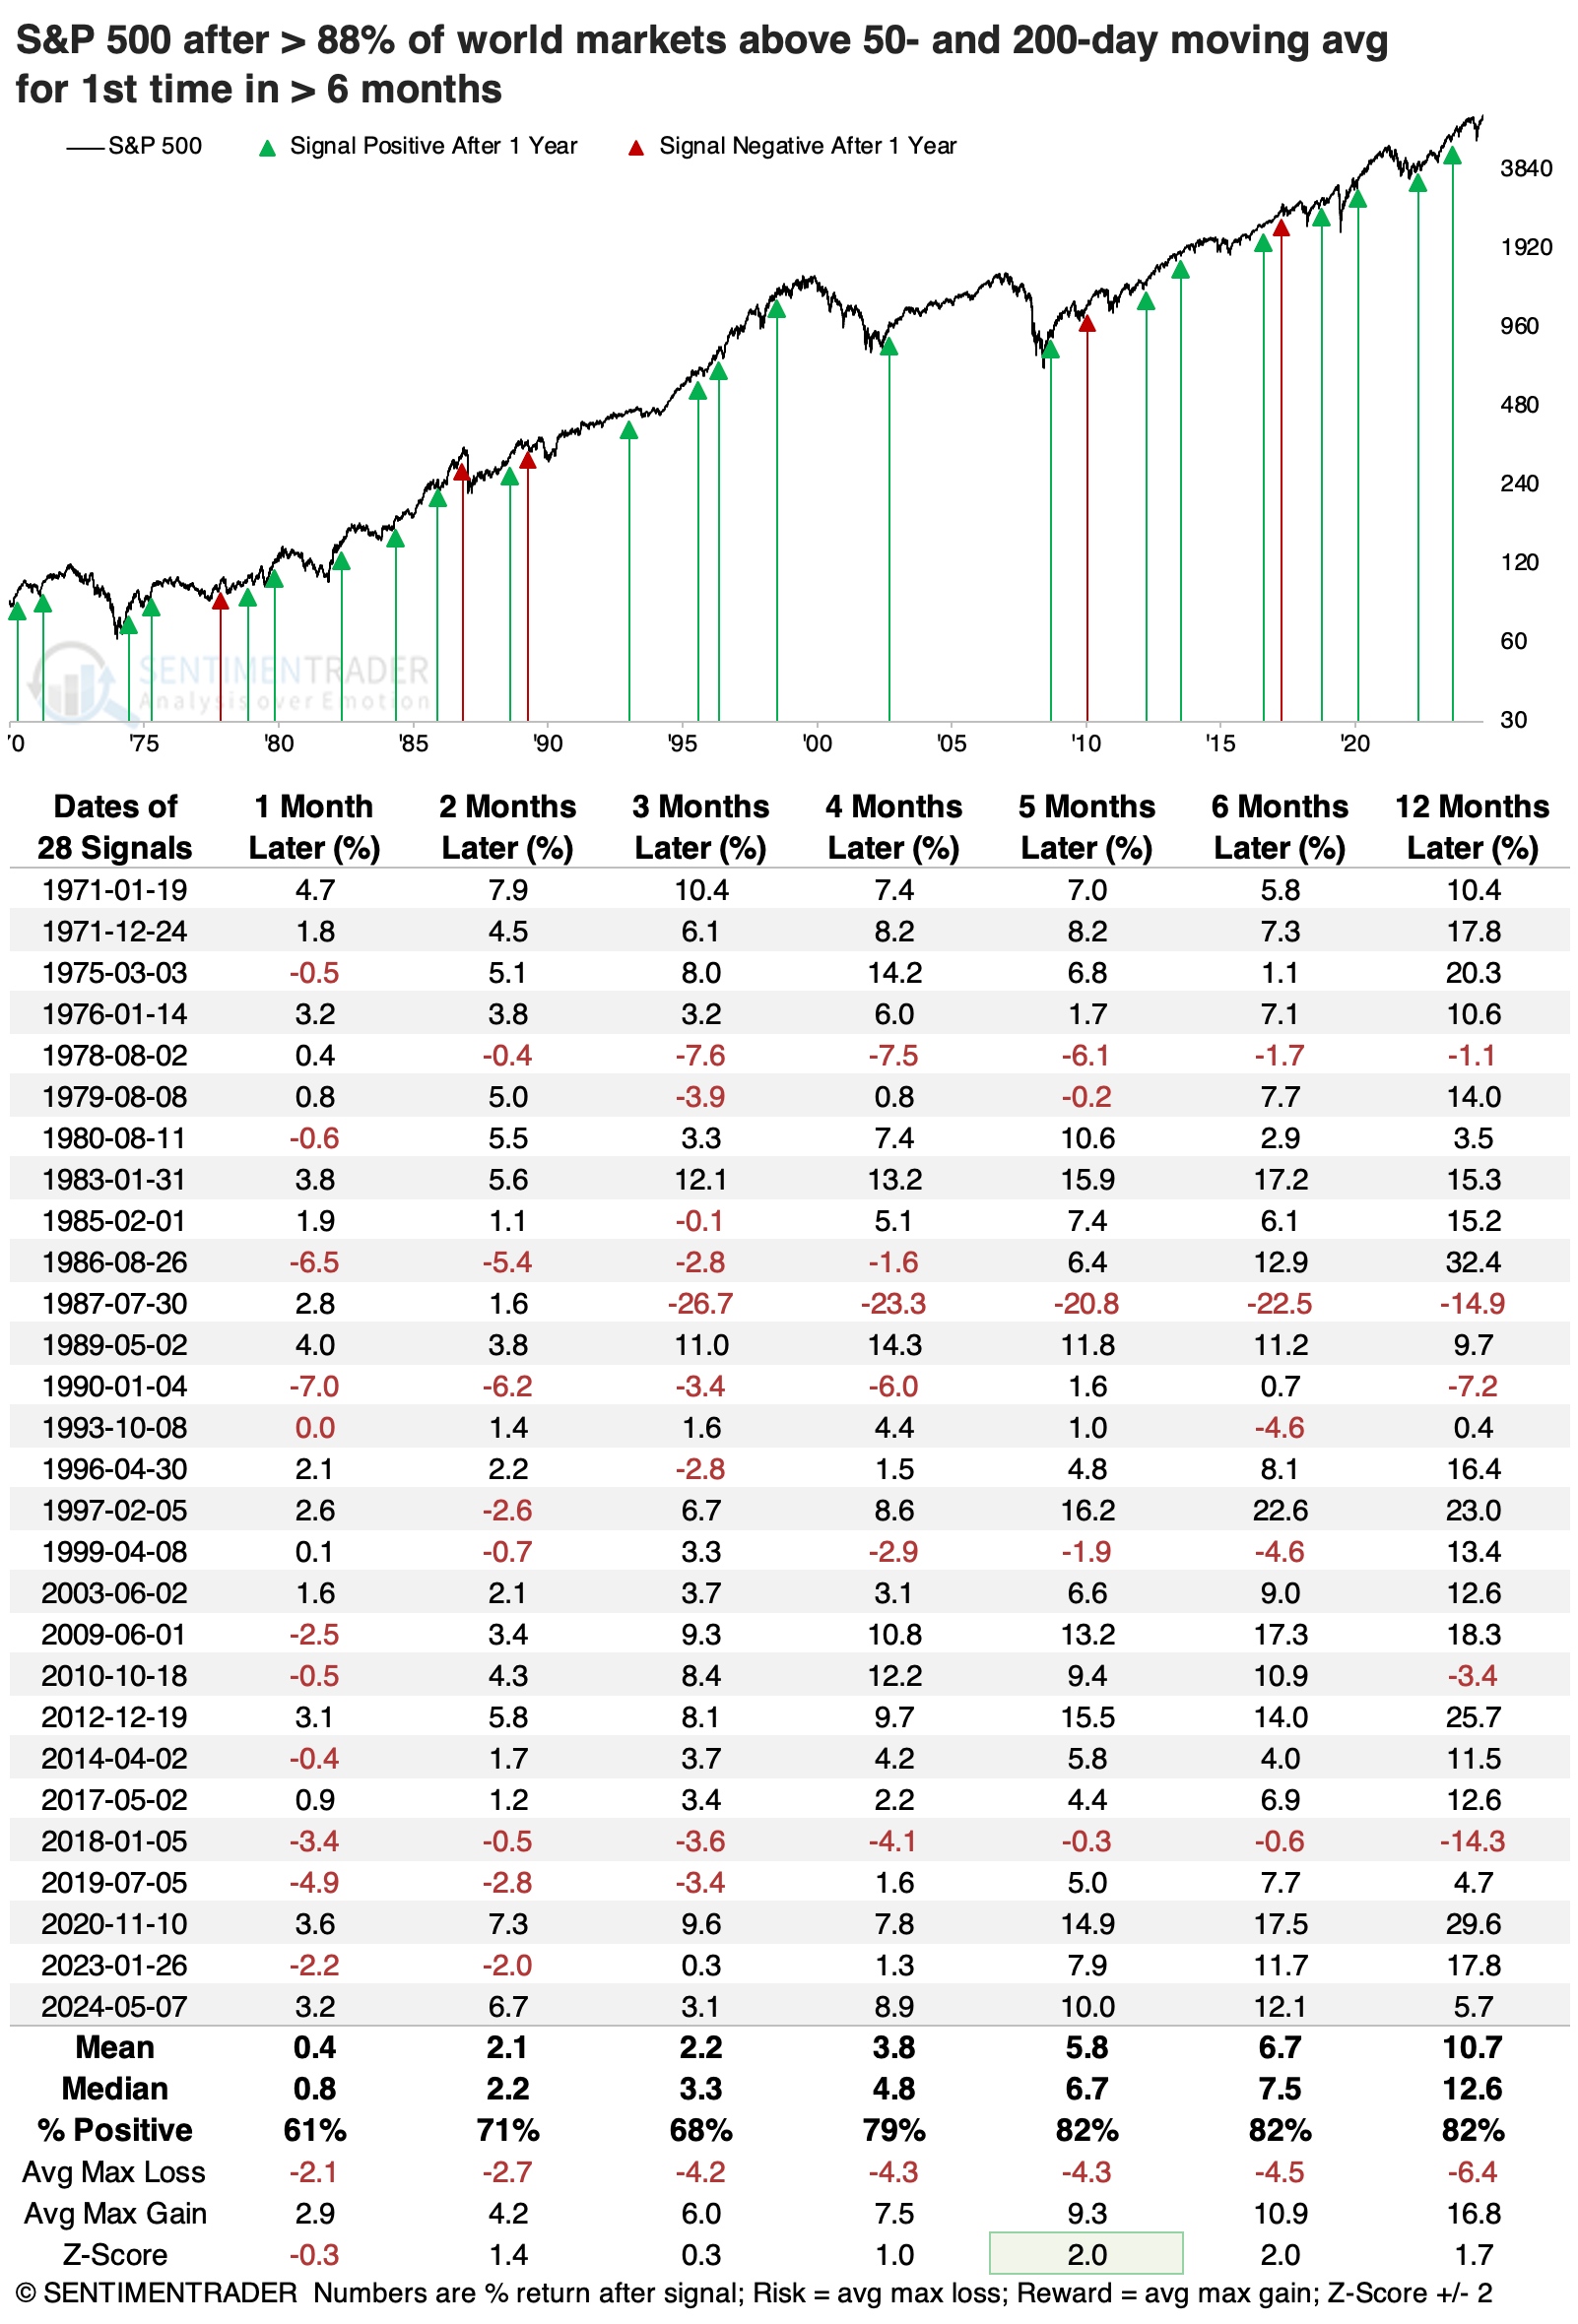
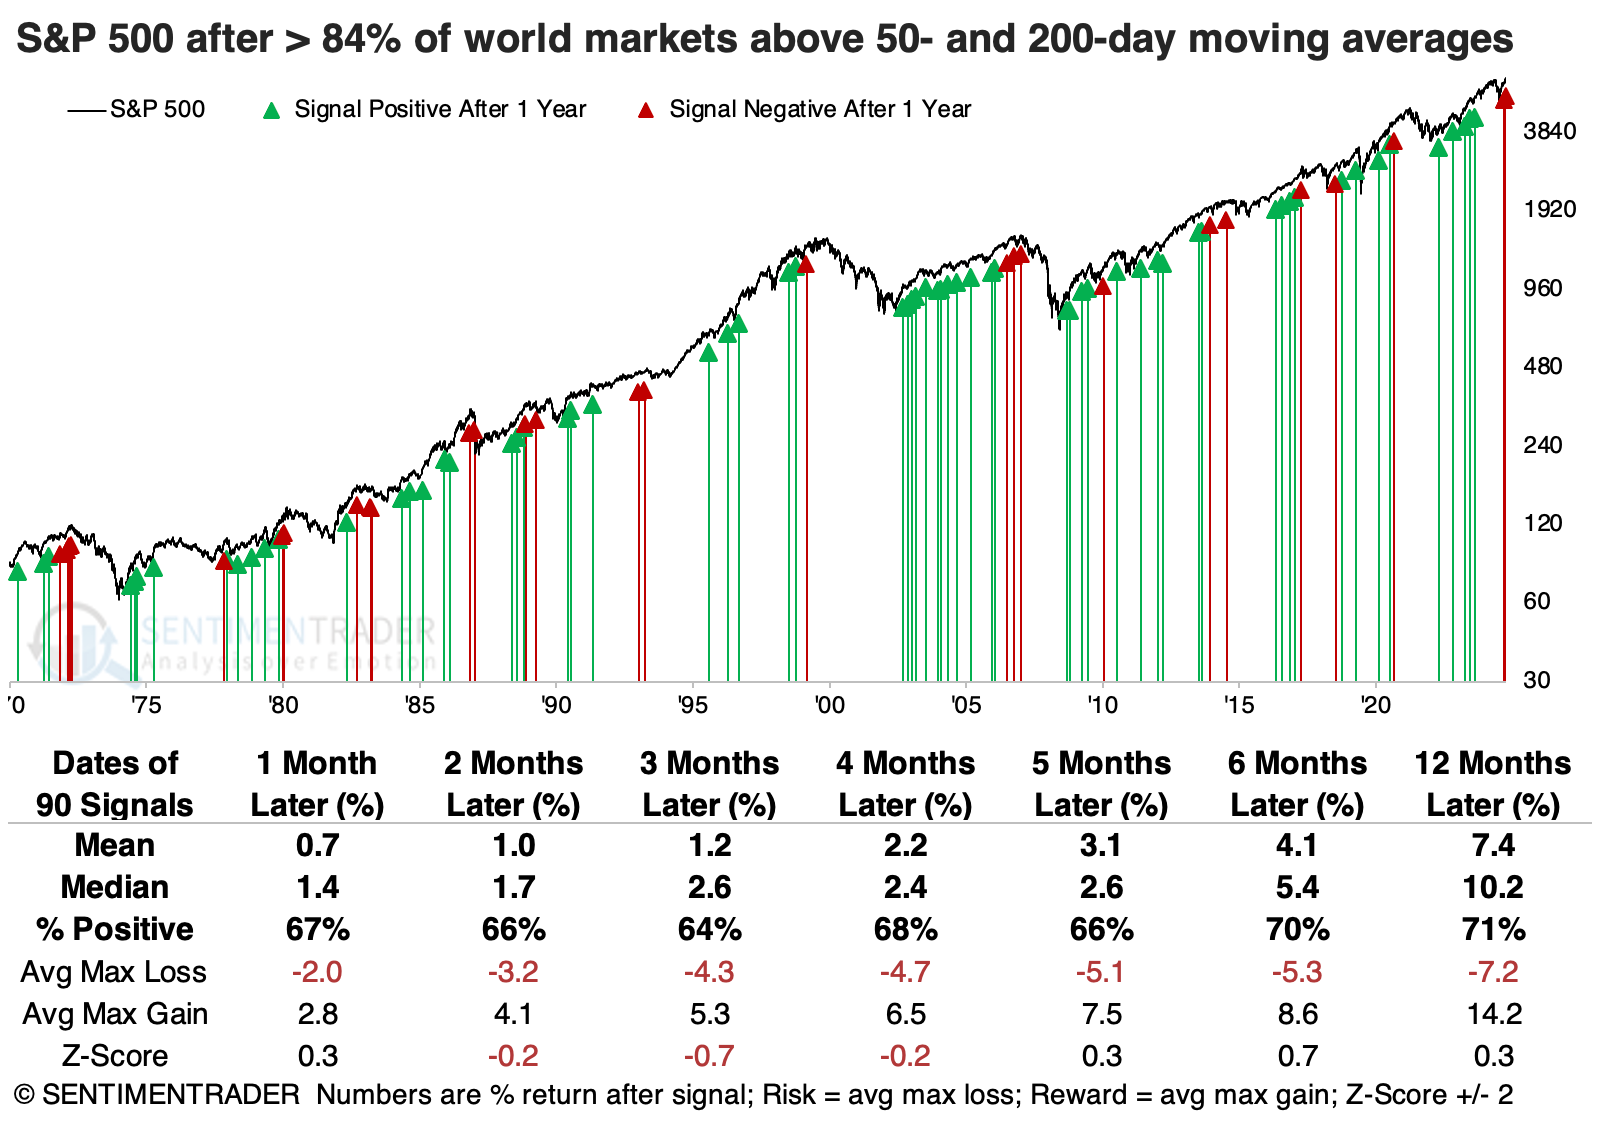
The table below takes a signal-based approach. It shows returns in the S&P 500 when more than 88% of countries rose above both their 50- and 200-day moving averages for the first time in at least six months. This would ostensibly be the "sell" signal mentioned in the article. It did precede one crash, in 1987, so there's that. But that was about it for significant declines; over the next 6-12 months, the S&P suffered only 5 losses out of 28 signals, with average returns well above random.
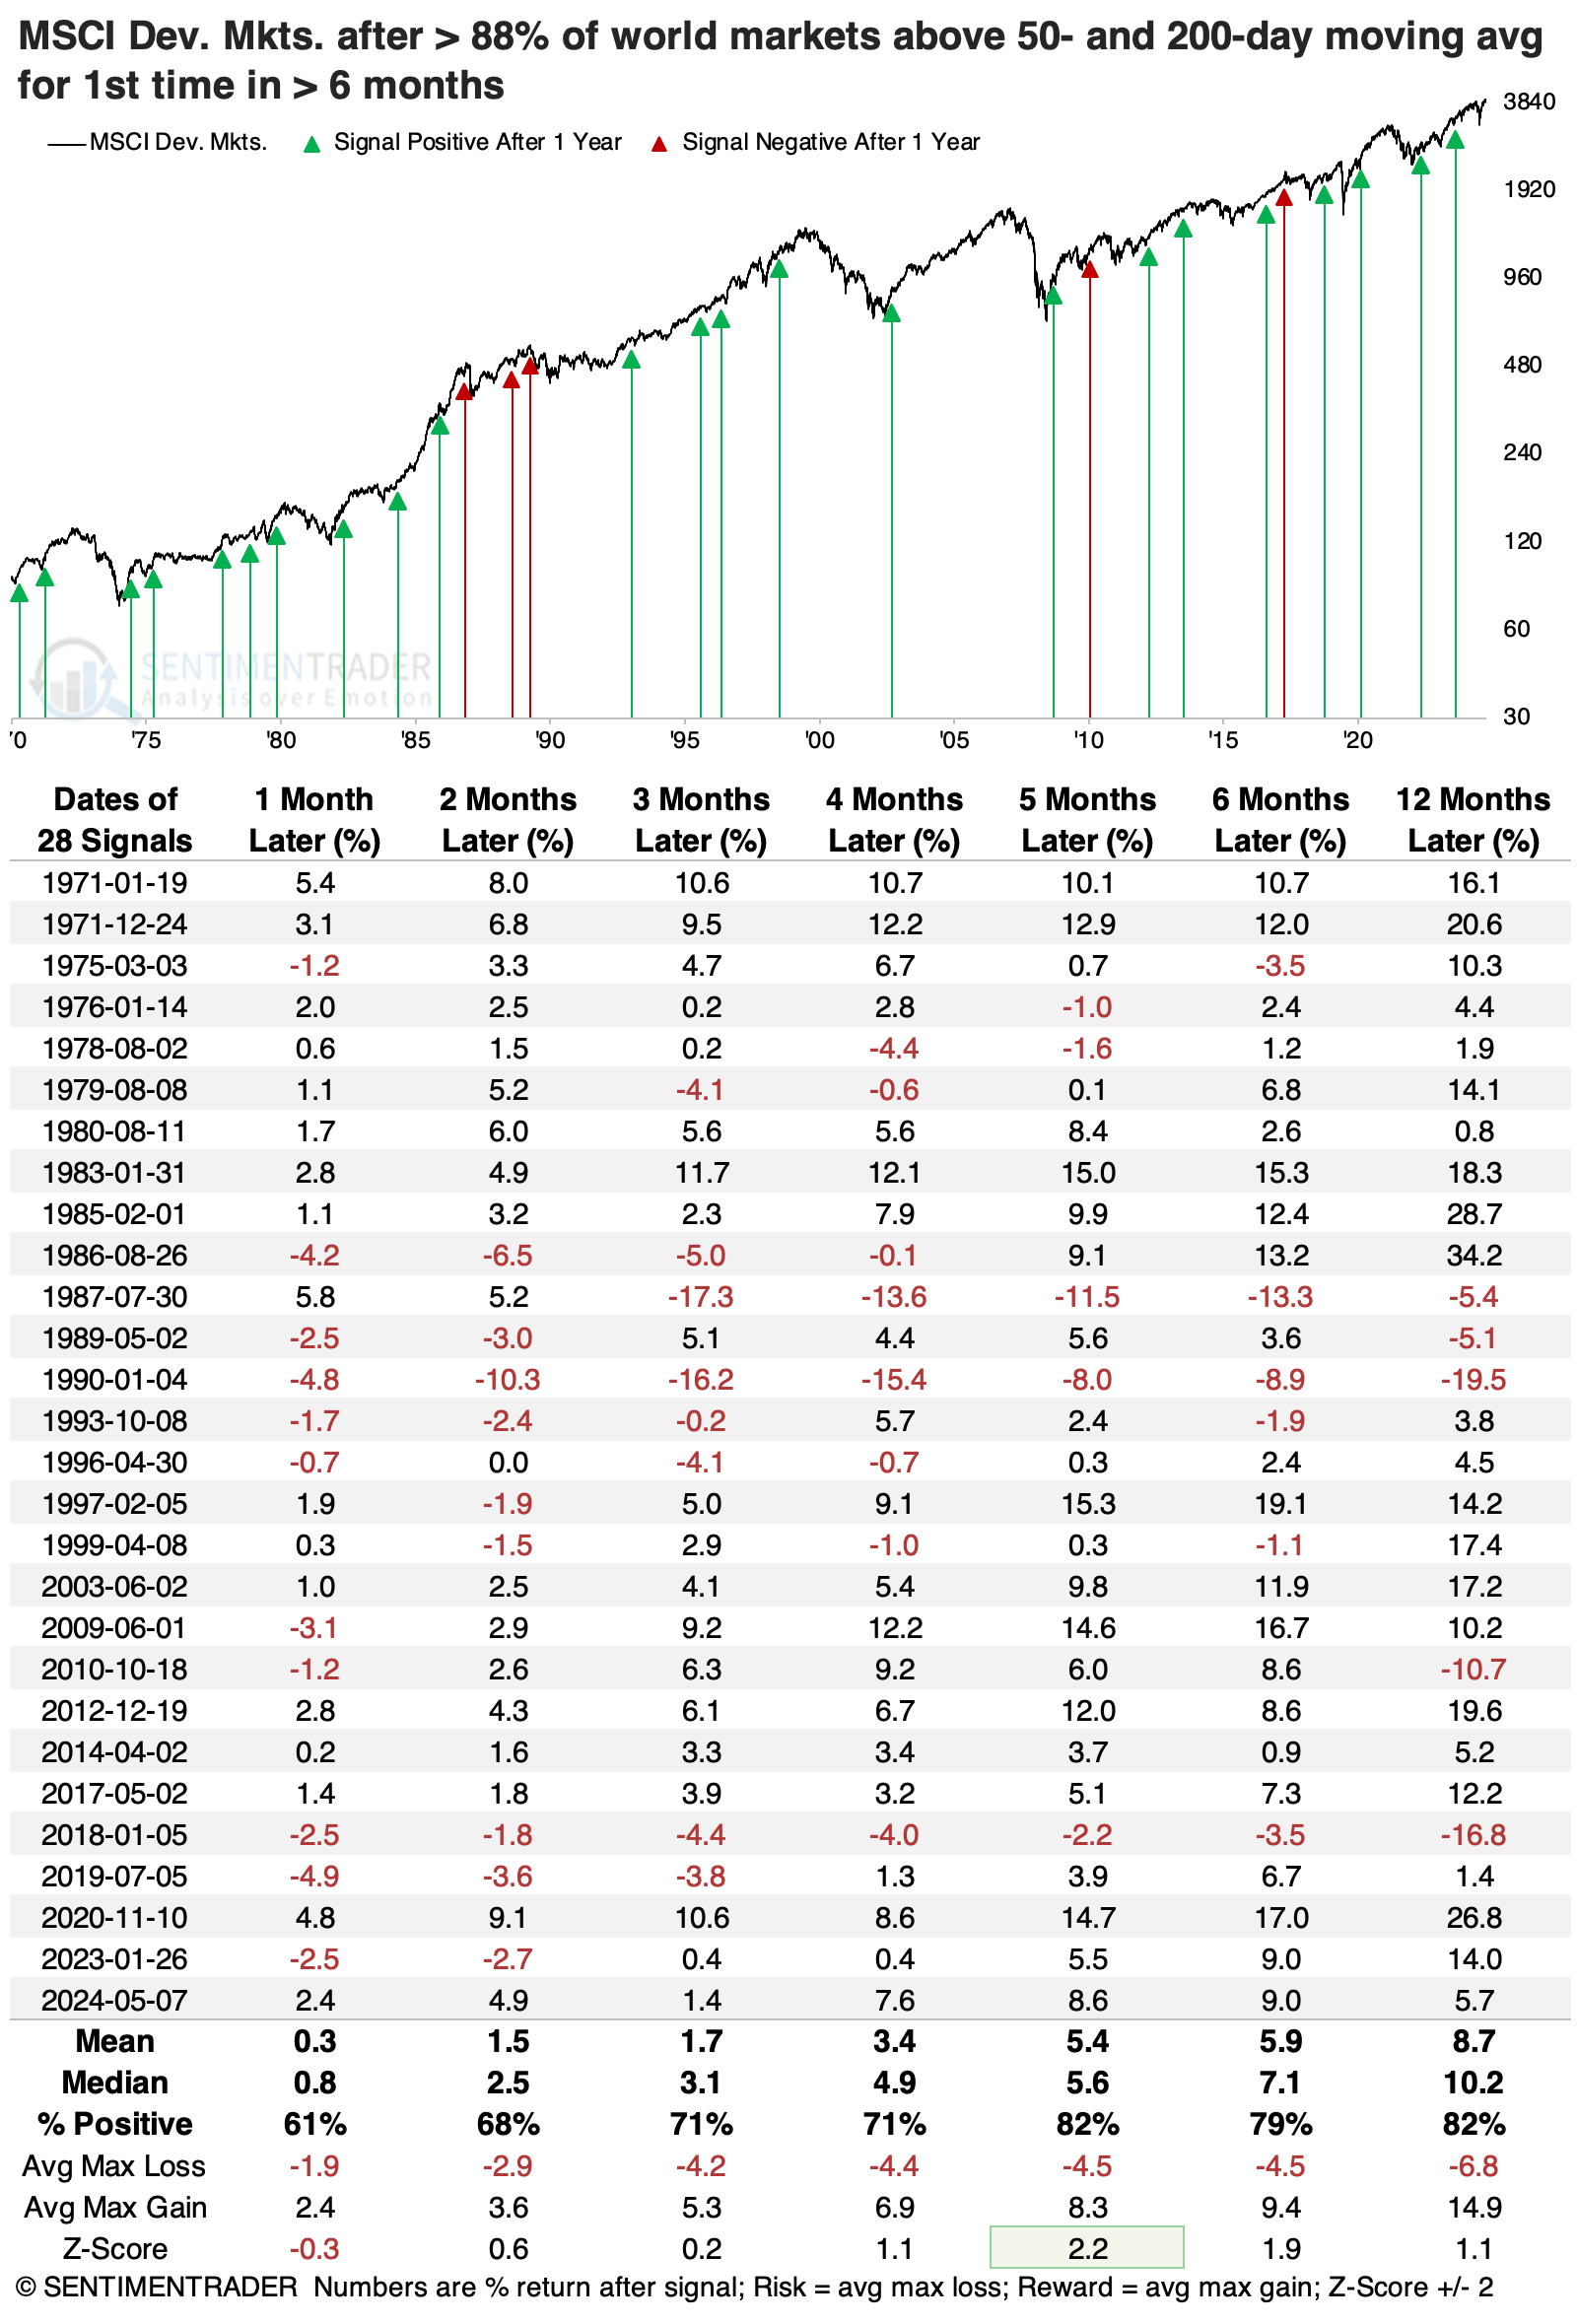
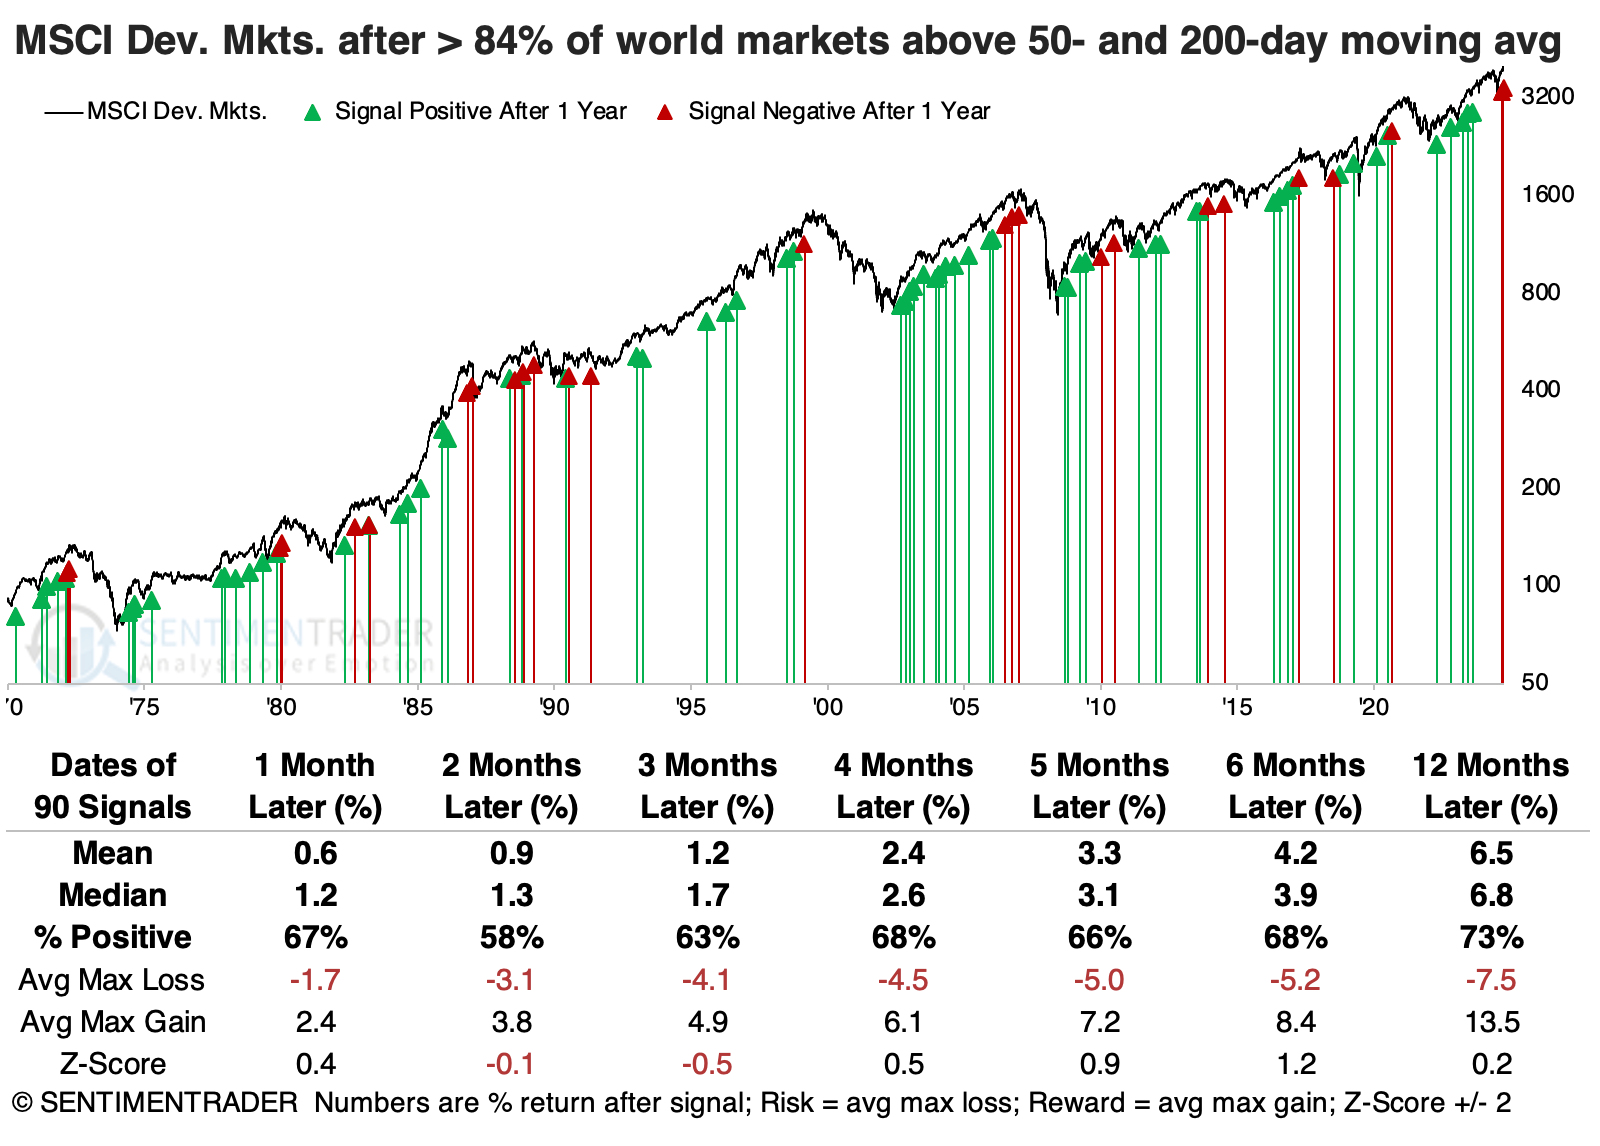
The MSCI Developed Markets Index's returns were similar. Across time frames, its average returns, win rate, and risk/reward skew were roughly comparable to those of the S&P 500.
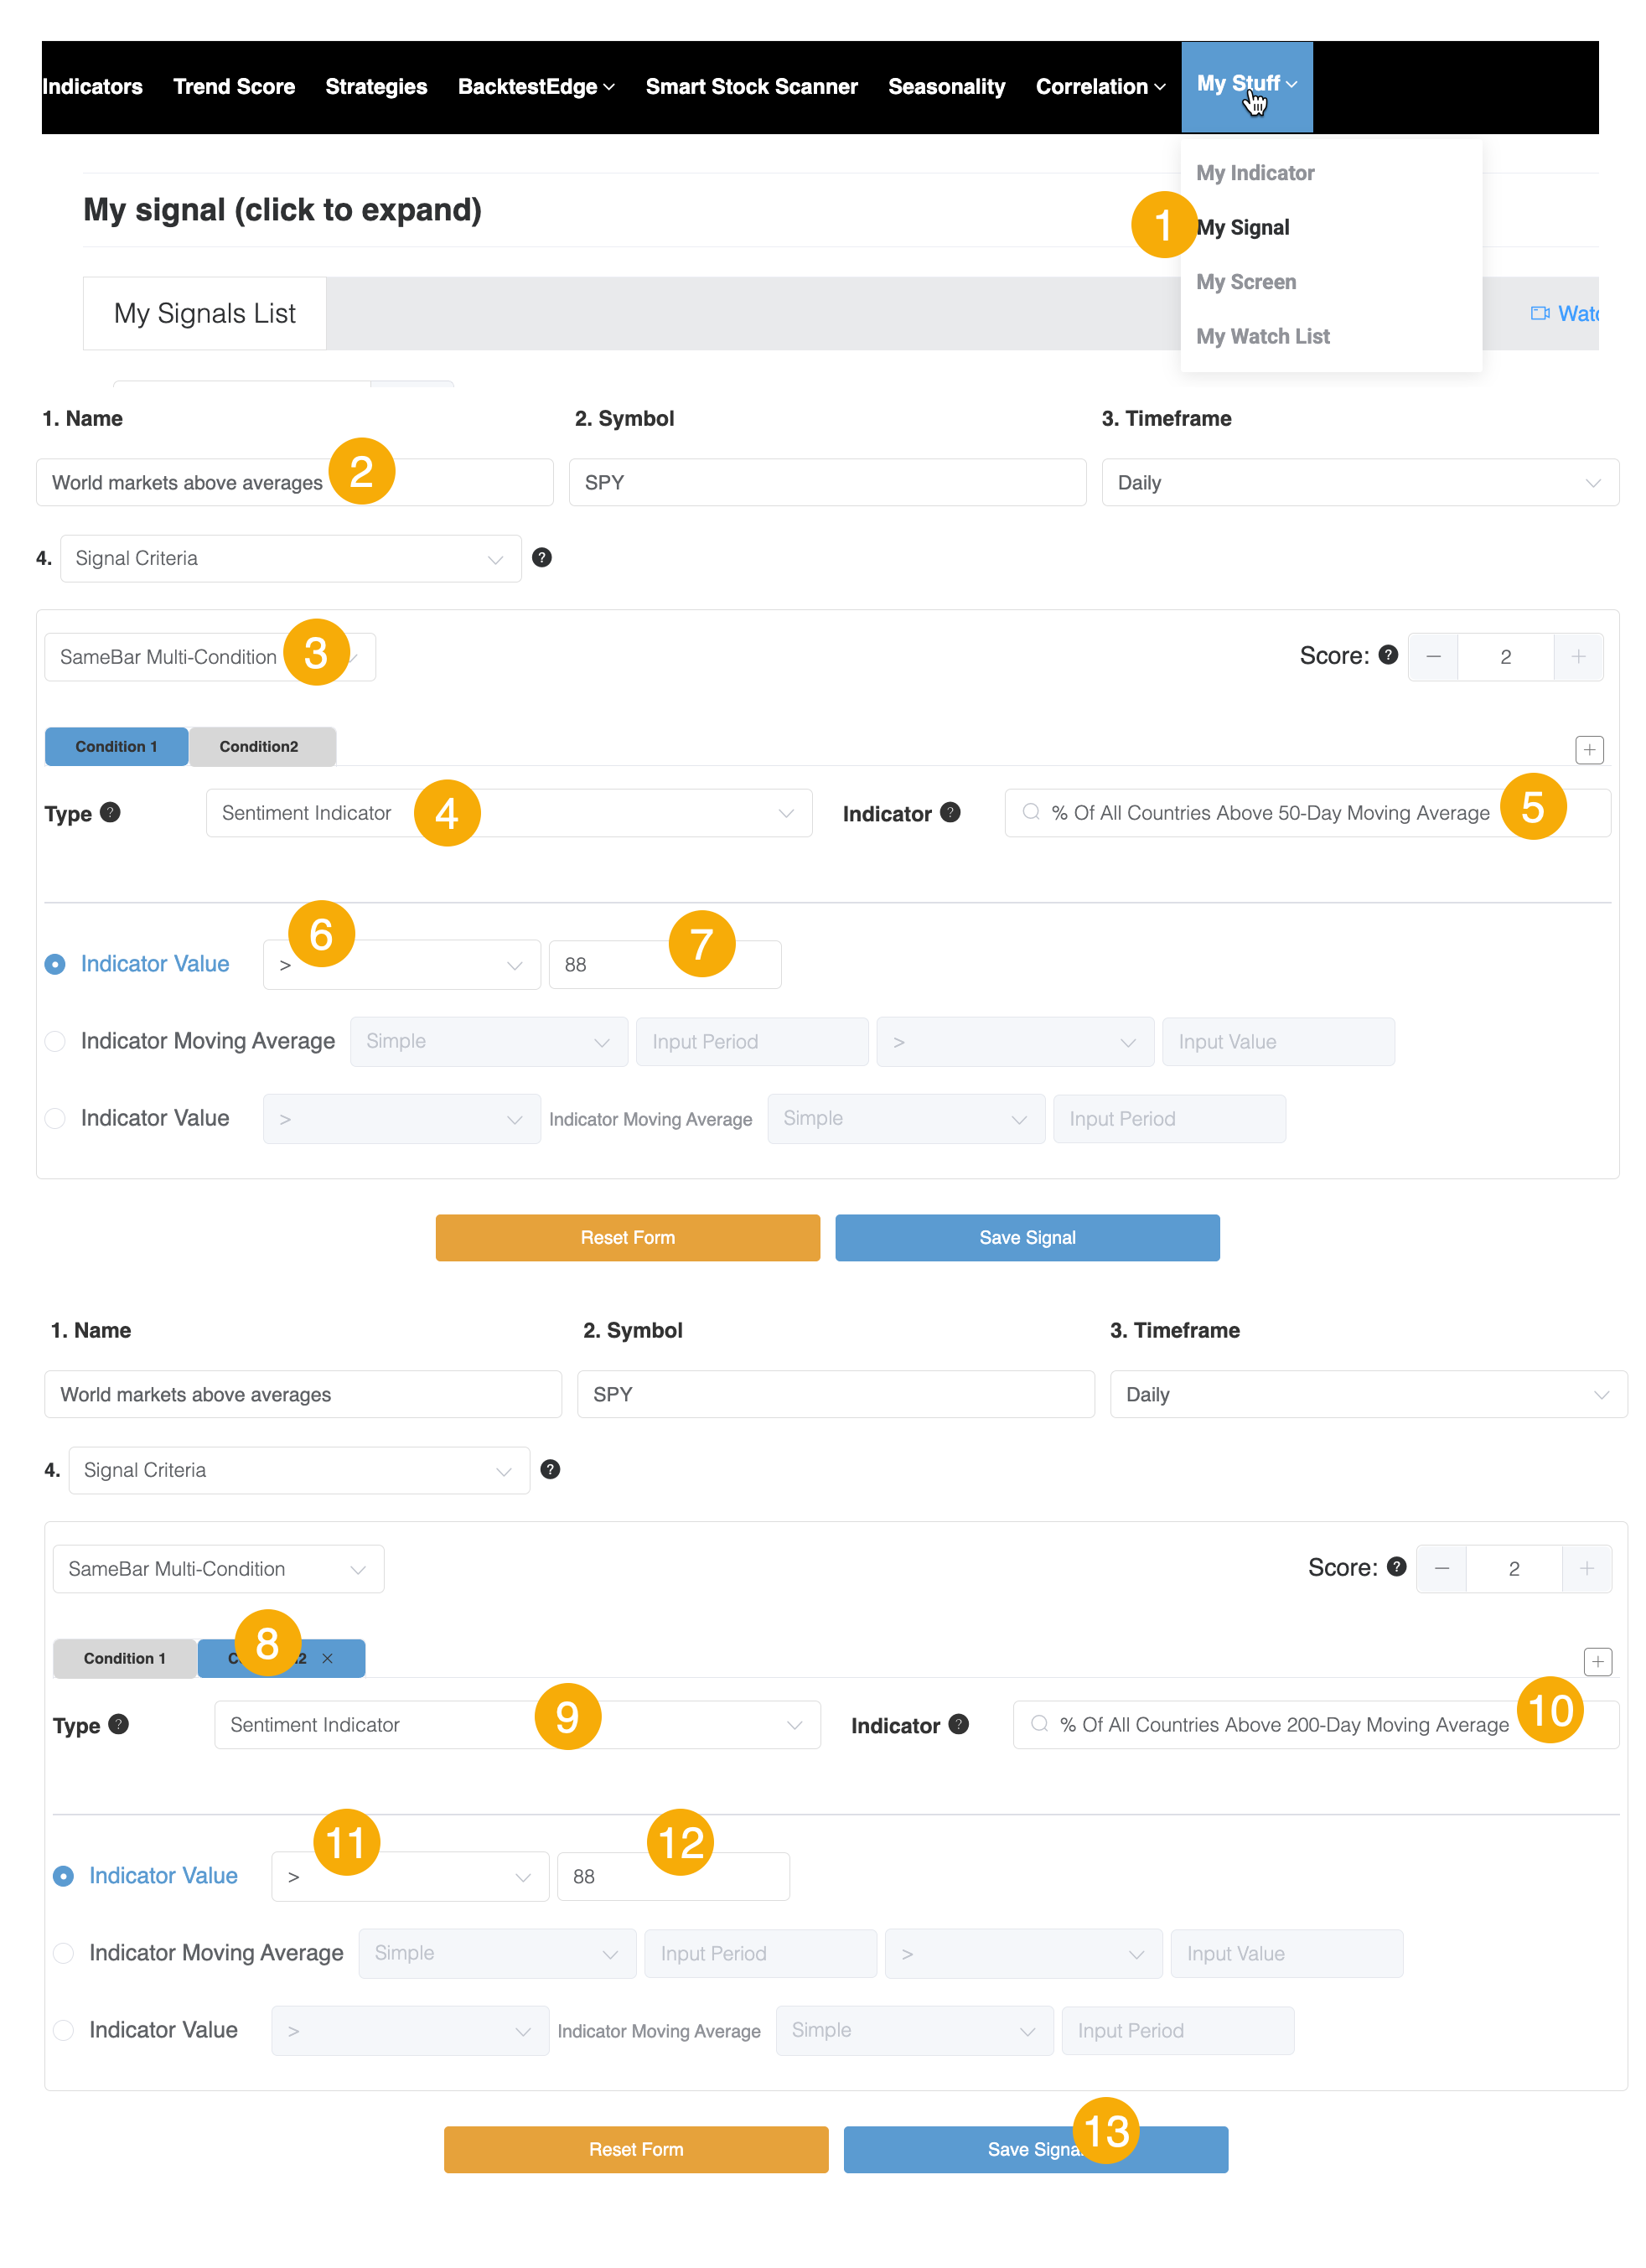
Using the site's My Signal function, you can create a signal to be alerted when this event triggers.
- Go to the My Signal page
- Type a name for your signal
- In the dropdown box, select SameBar Multi-Condition
- Choose Sentiment Indicator
- Start typing "% of all countries" and select "% of All Countries Above 50-Day Moving Average"
- Choose an Indicator Value of ">" (above)
- Enter 88 as the sell threshold, meaning 88% of countries would be above their 50-day moving average
- Click on the Condition 2 tab
- Choose Sentiment Indicator
- Start typing "% of all countries" and select "% of All Countries Above 200-Day Moving Average"
- Choose an Indicator Value of ">" (above)
- Enter 88 as the sell threshold, meaning 88% of countries would be above their 200-day moving average
- Click the Save Signal button
What about current conditions?
The "sell" signal is still hypothetical because it hasn't happened yet. Instead, we can look at current conditions and see if it may mean anything for future returns.
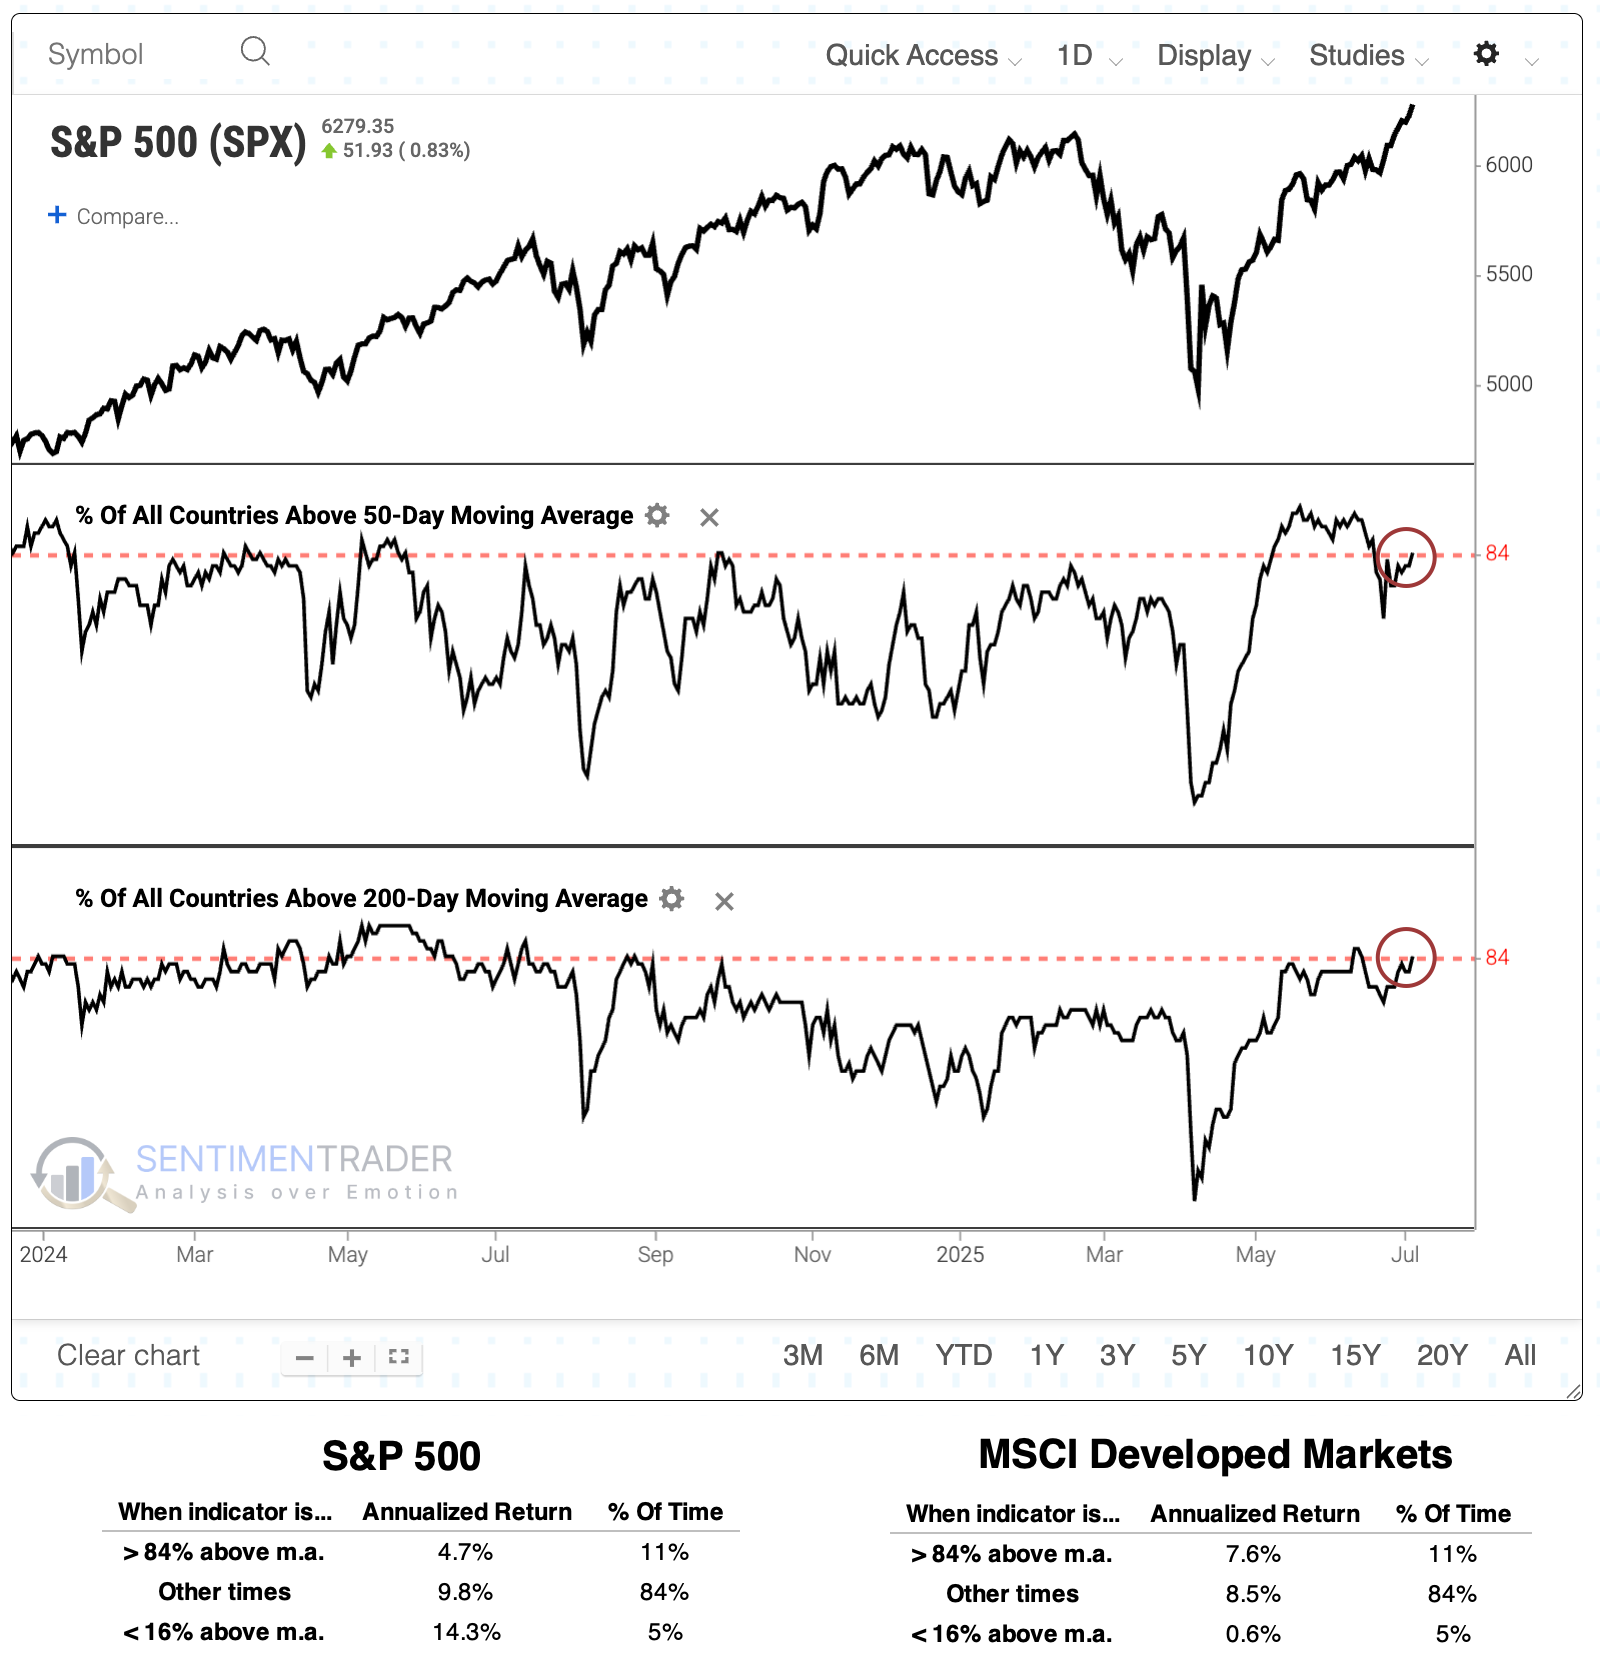
Above, we can see that when the current number of markets are above their moving averages, the S&P 500's annualized return was +4.7%, which is actually less than when the indicators were above the "sell" threshold. However, the MSCI Developed Markets Index showed a significantly smaller return, with less of a spread of outperformance relative to the S&P.
There were many more times when the countries had exceeded the current threshold, and the table below shows summary stats for S&P 500 performance using a signal-based approach. There wasn't much to note about the returns, suggesting no compelling longer-term reason to adjust exposure, given how many countries are currently above their moving averages.
It's the same story for the MSCI Developed Markets Index, though there was a modest bump in longer-term returns under current conditions.
What the research tells us...
The threshold for a "sell" signal in U.S. equity markets is hard to meet. A signal has to be able to go counter to decades of impressive absolute and relative returns, and that's a very high hurdle to overcome. Based on the criteria noted in the Bloomberg article, that signal doesn't pass muster, either. While the S&P 500's annualized returns weren't impressive (meaning the daily returns were quite small), it did not consistently lead to major declines...or any decline at all. Most of the time, domestic and foreign stocks did better than average after the "sell" signal and under current conditions.