
A sell-off like few others

Key points:
- The S&P 500, Nasdaq Composite, and Russell 2000 have sold off hard since their peaks
- All three indices have few precedents in their histories regarding both price patterns and magnitude
- Generally, declines most similar to these, and at this pace, have preceded 1-3 month rebounds
A sell-off like few others
Stocks have taken such a tumble that it's tough to find precedents. A strong argument could be made that precedents don't matter since few, if any, investors have lived through the tumult we're now experiencing.
Another argument could be made that the reasons don't matter; only investors' behavior does. The truth probably lies somewhere in between. We don't dabble in theories and guesswork here, so we'll focus on the precedents and how investors have behaved in the past as a guide to how they may behave now.
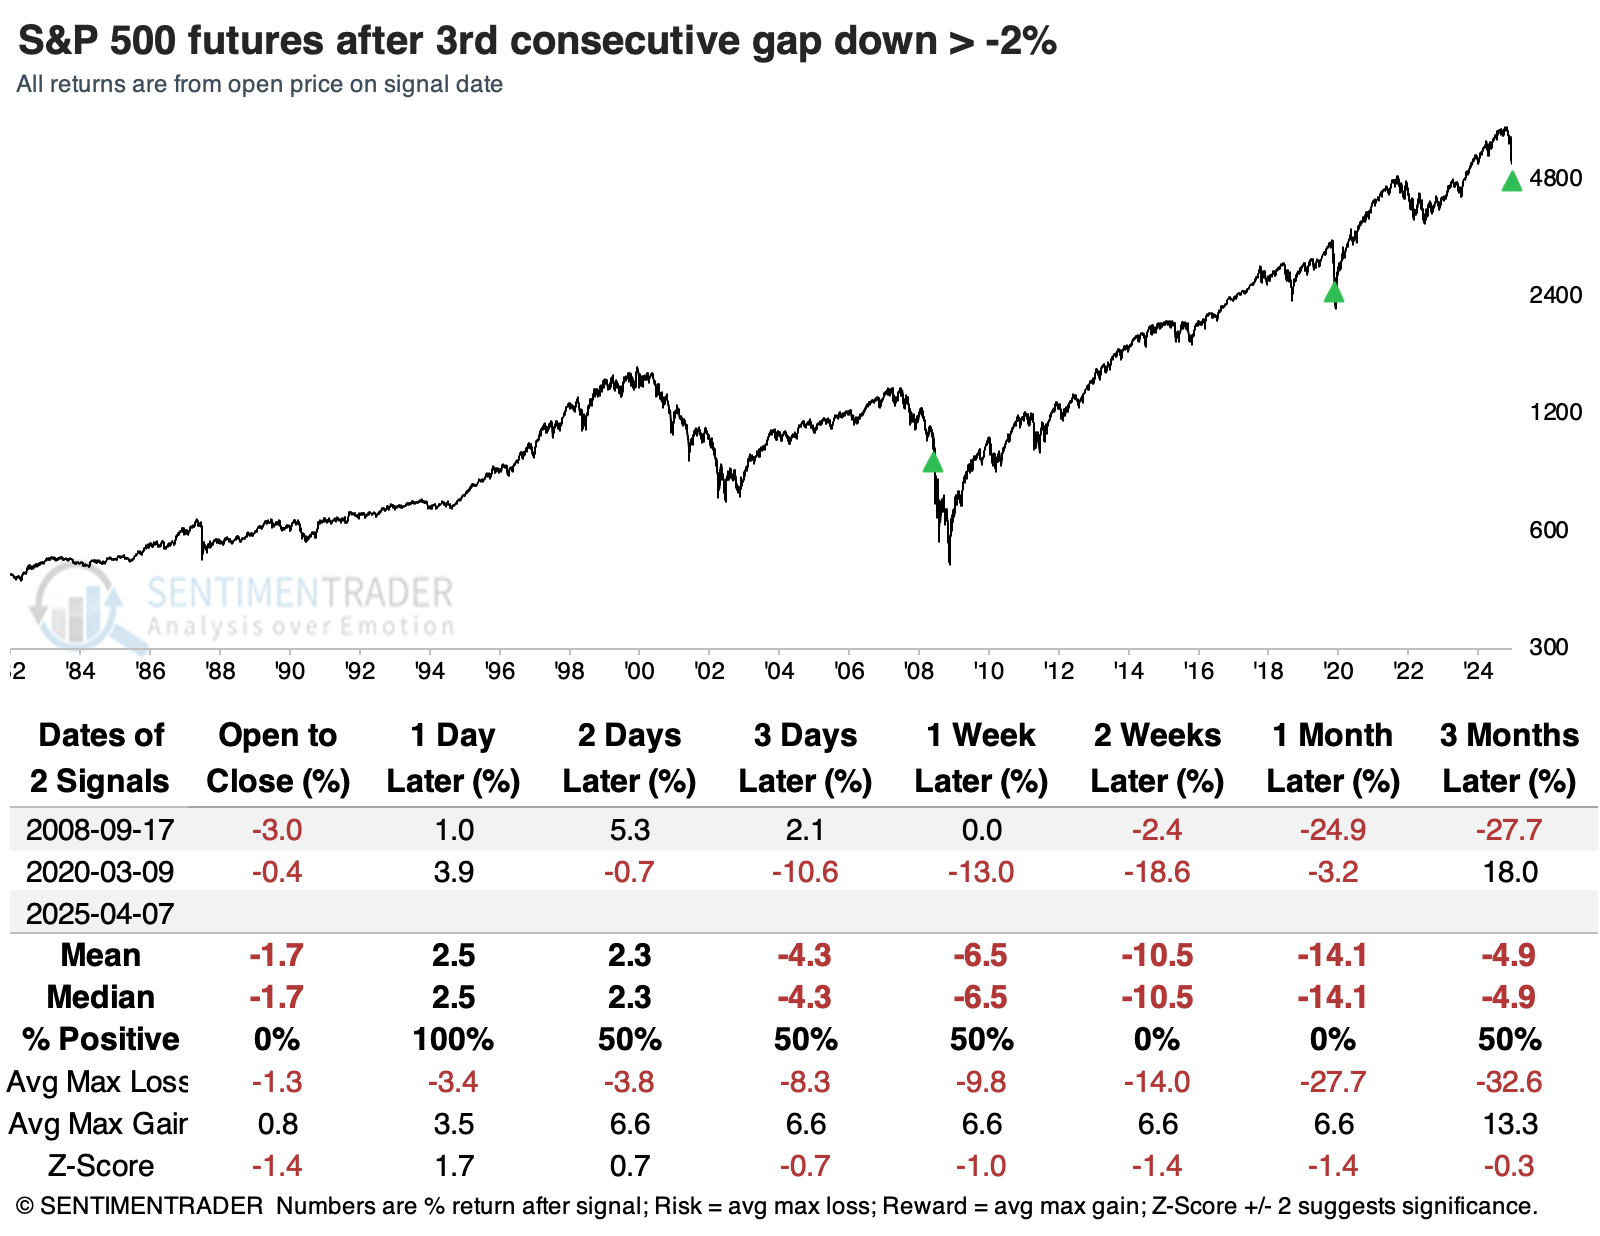
If the gap down in S&P 500 futures holds, then we're witnessing panicky behavior seen arguably only once in 42 years since the inception of the futures market. That was September 16, 2008, the morning after Lehman Brothers failed. That was the only time S&P 500 futures gapped down more than -1% for four consecutive days.
The panic opens have been even greater, though. For the third straight session, the S&P is indicated to gap down more than -2% (it may change after publication). Again, only the post-Lehman collapse in 2008 and the Covid shutdown can equate.
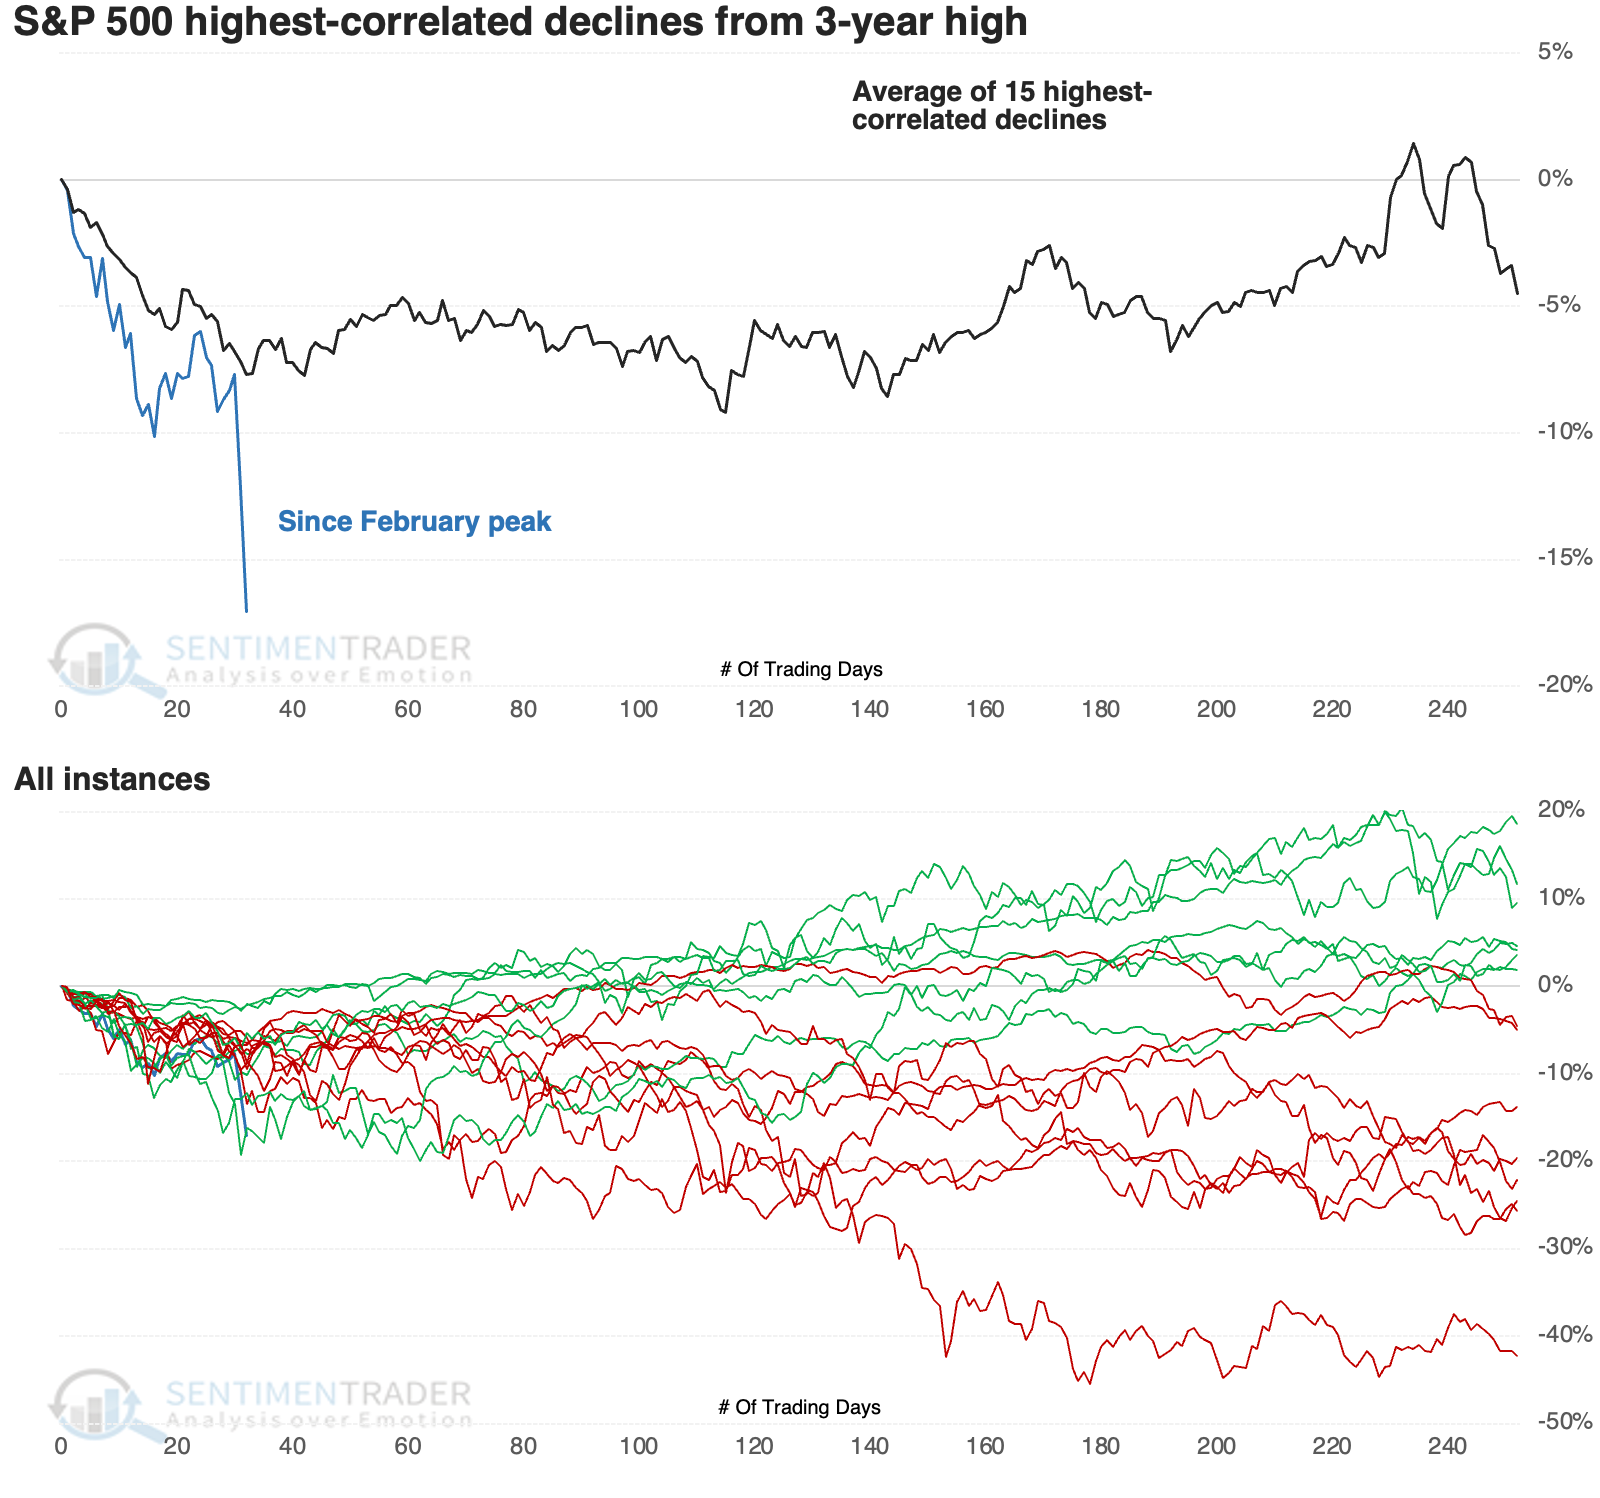
For the most critical equity index in the world, the pattern of its decline since the peak has some highly correlated precedents, but few of this magnitude.
The ten most recent instances are shown below. In terms of behavior and magnitude, the closest are 1998 (which was nearly exact) and 1990. Neither one suffered much more losses, though both took about 30 more trading days before bottoming.
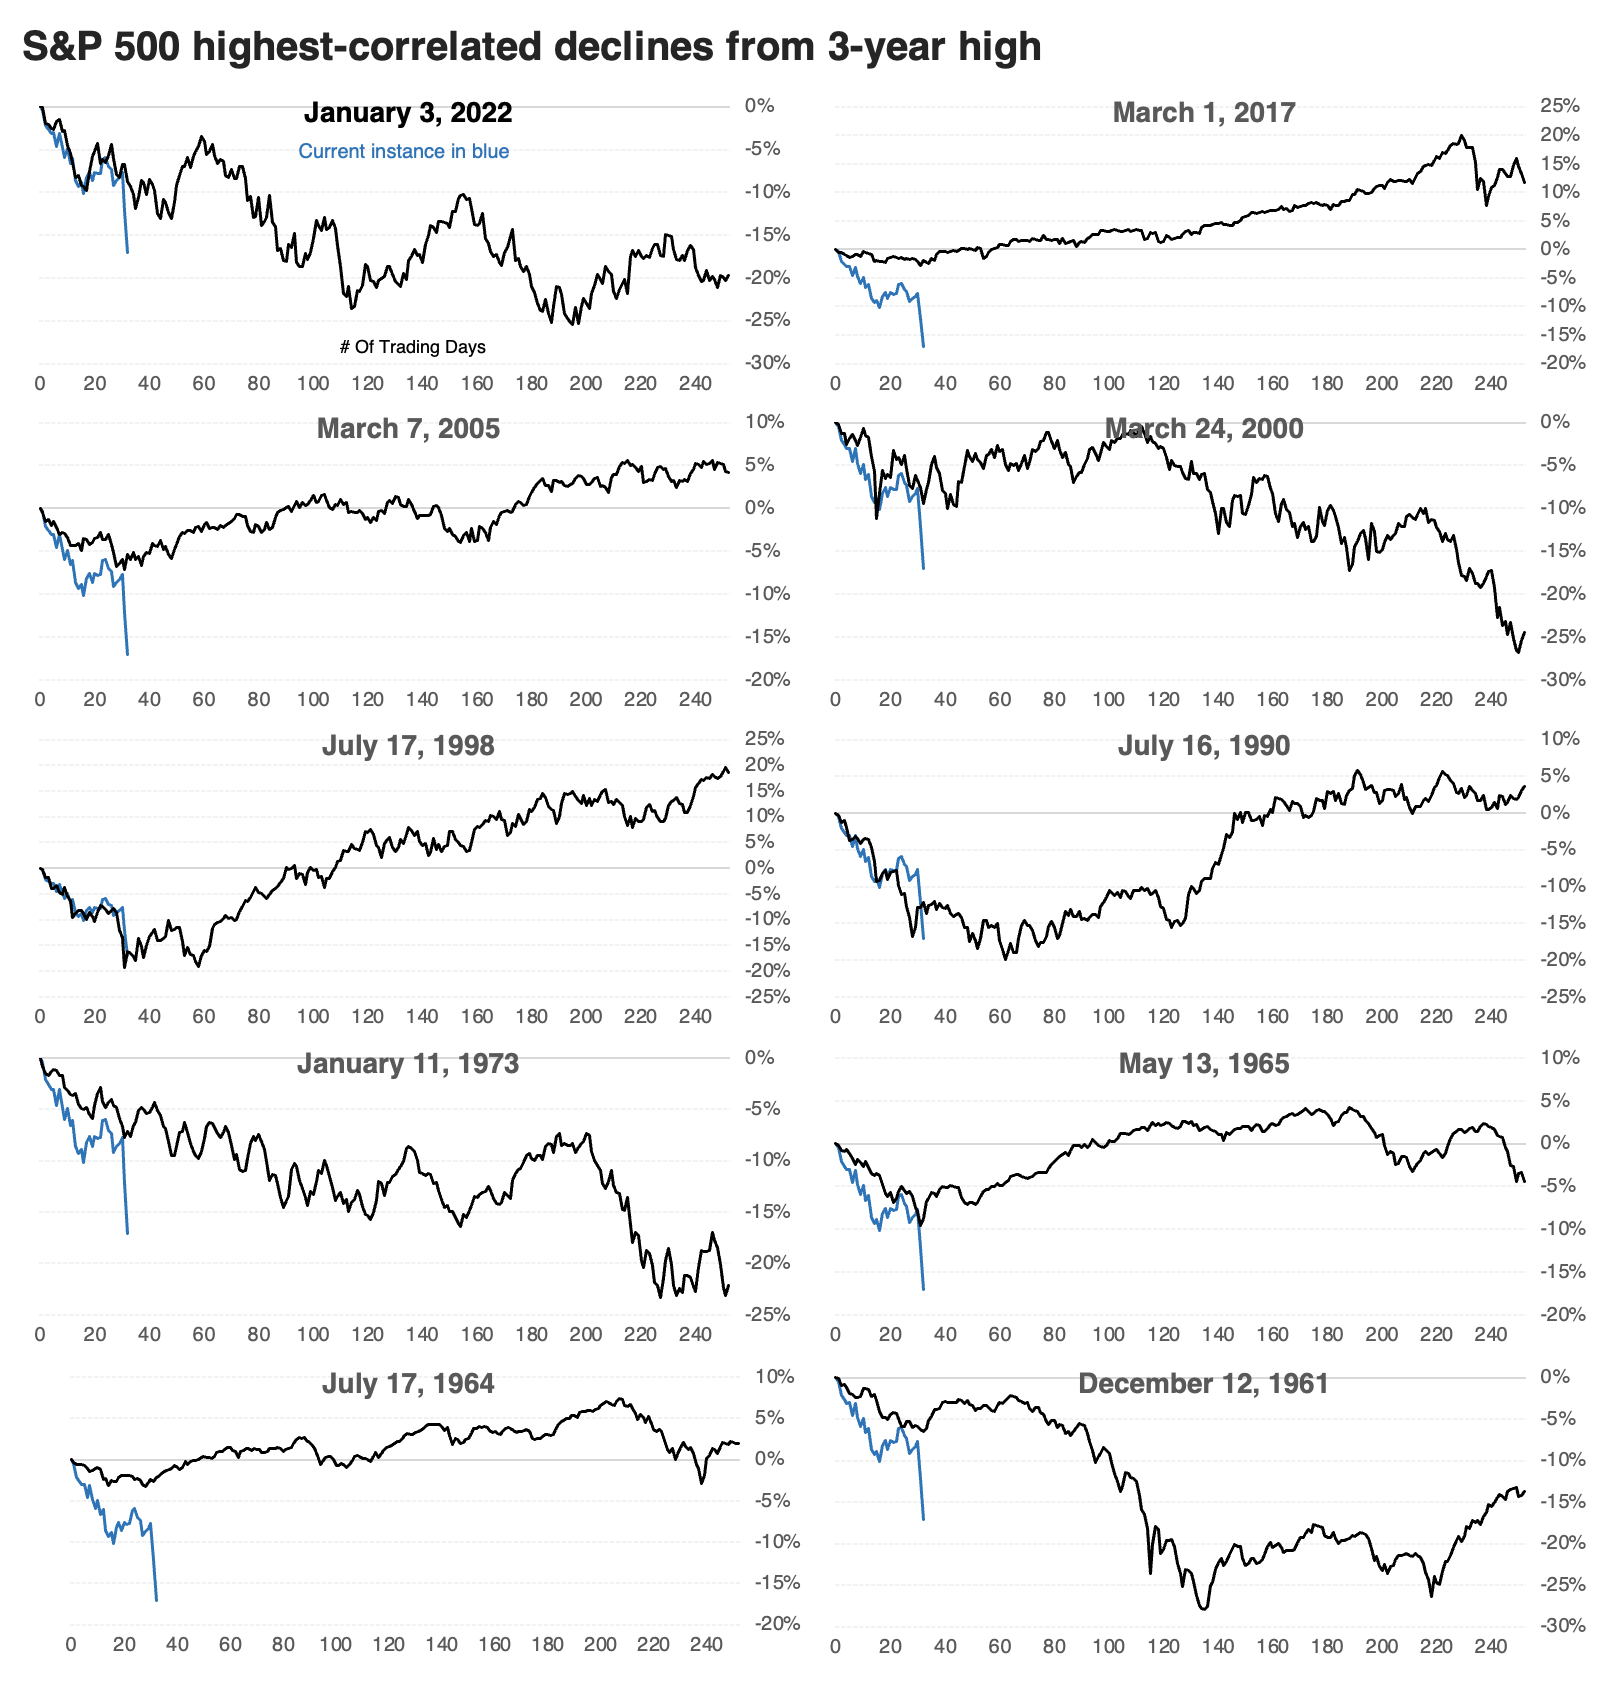
The S&P's returns following these selloffs were mostly positive. Over the following month, there was only one loss of any magnitude during the 1990 recession. That one bottomed soon after, though several other initial rallies failed.
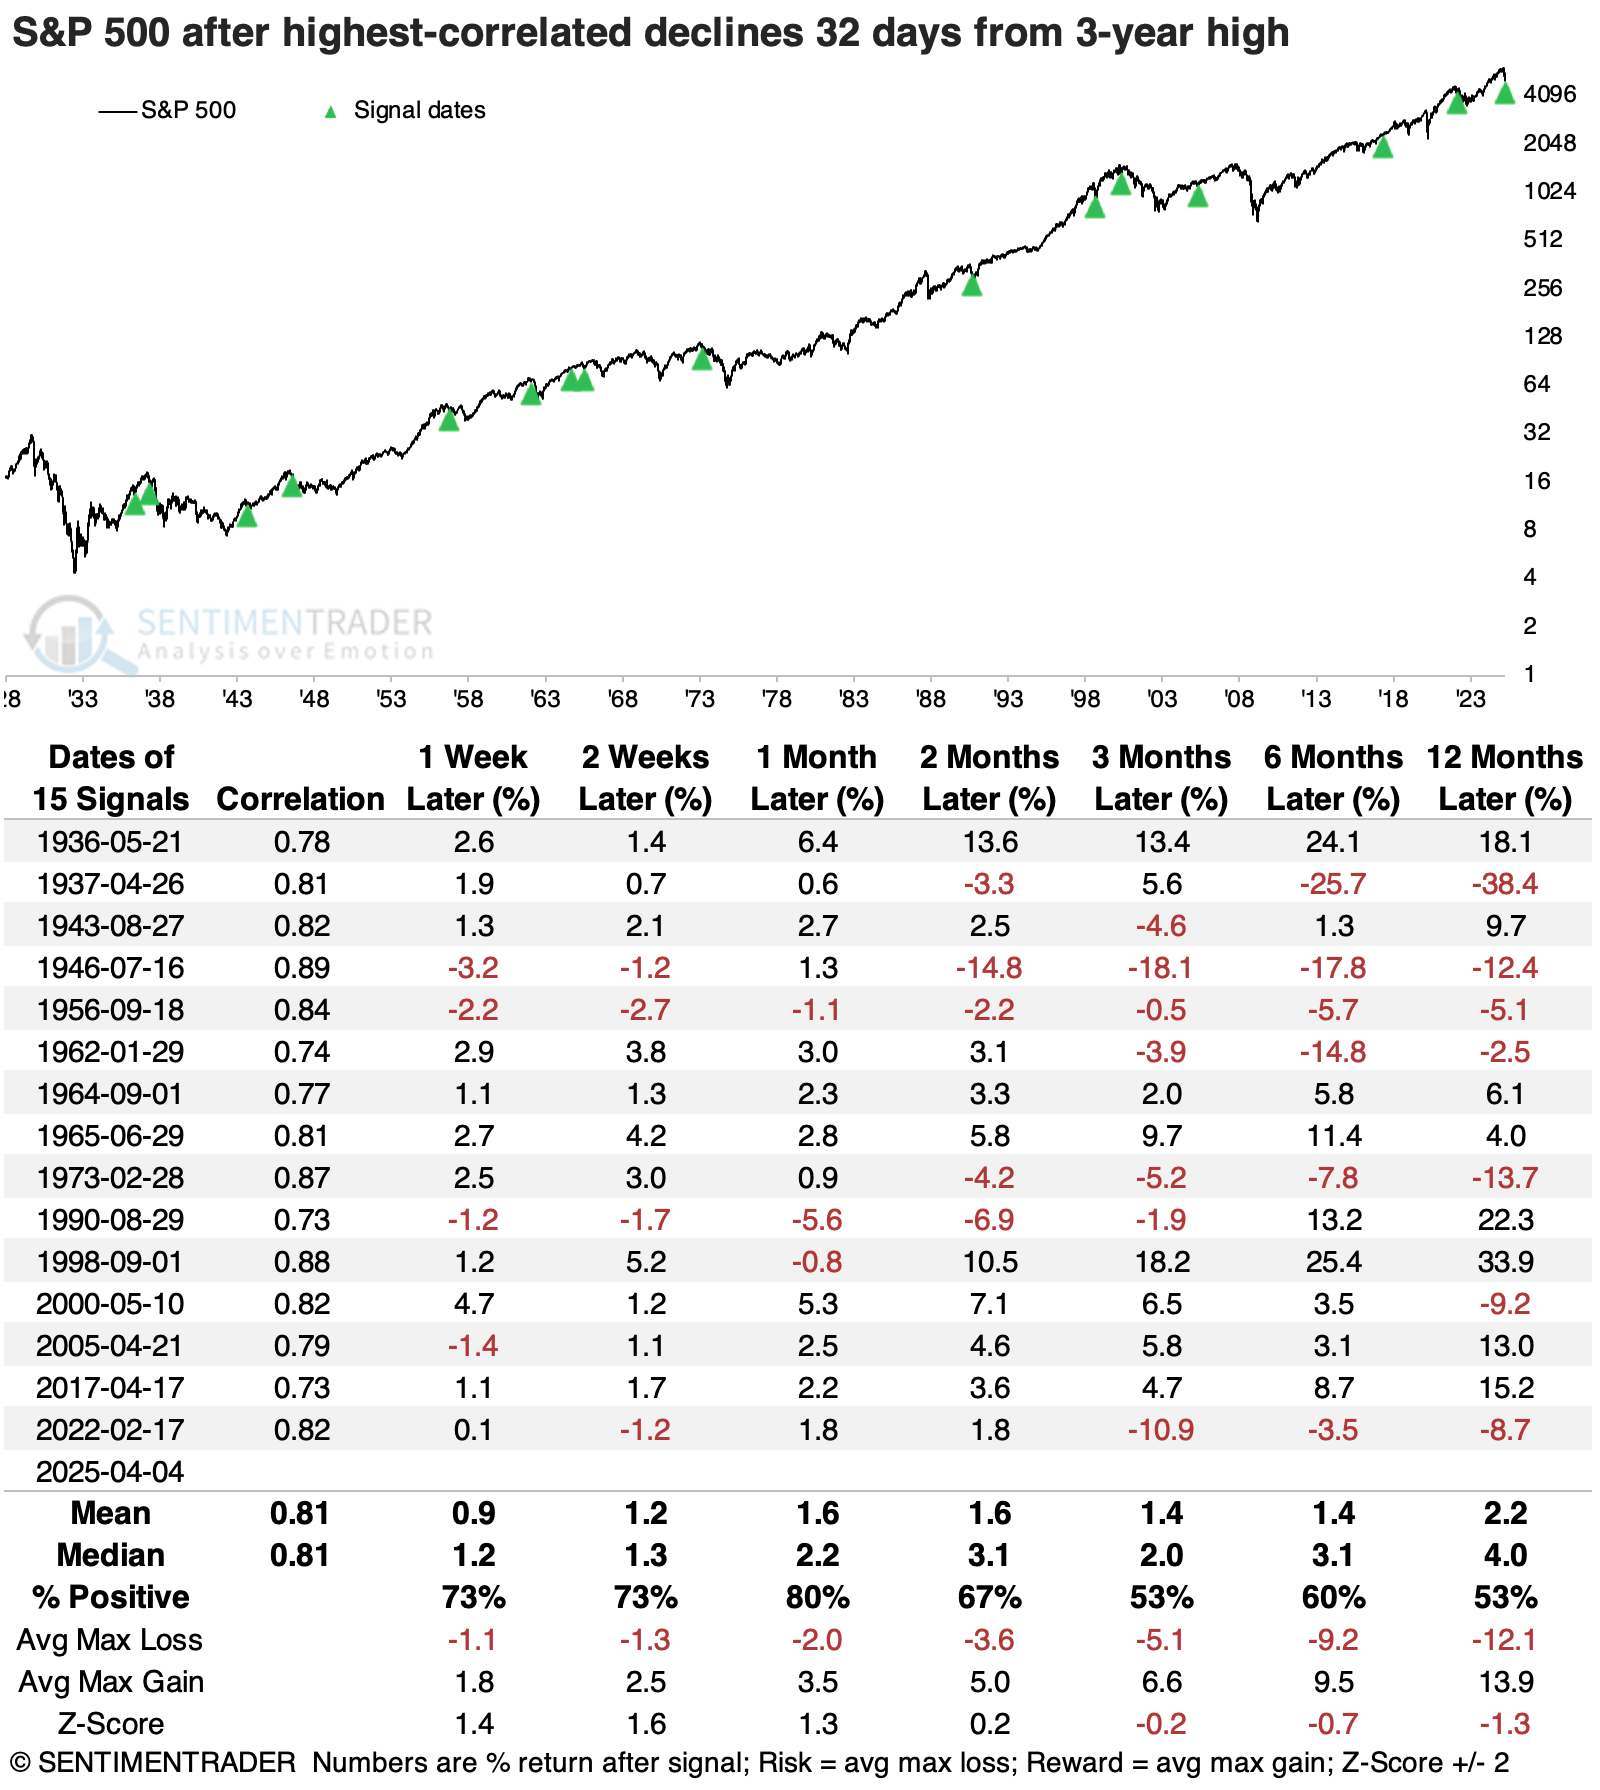
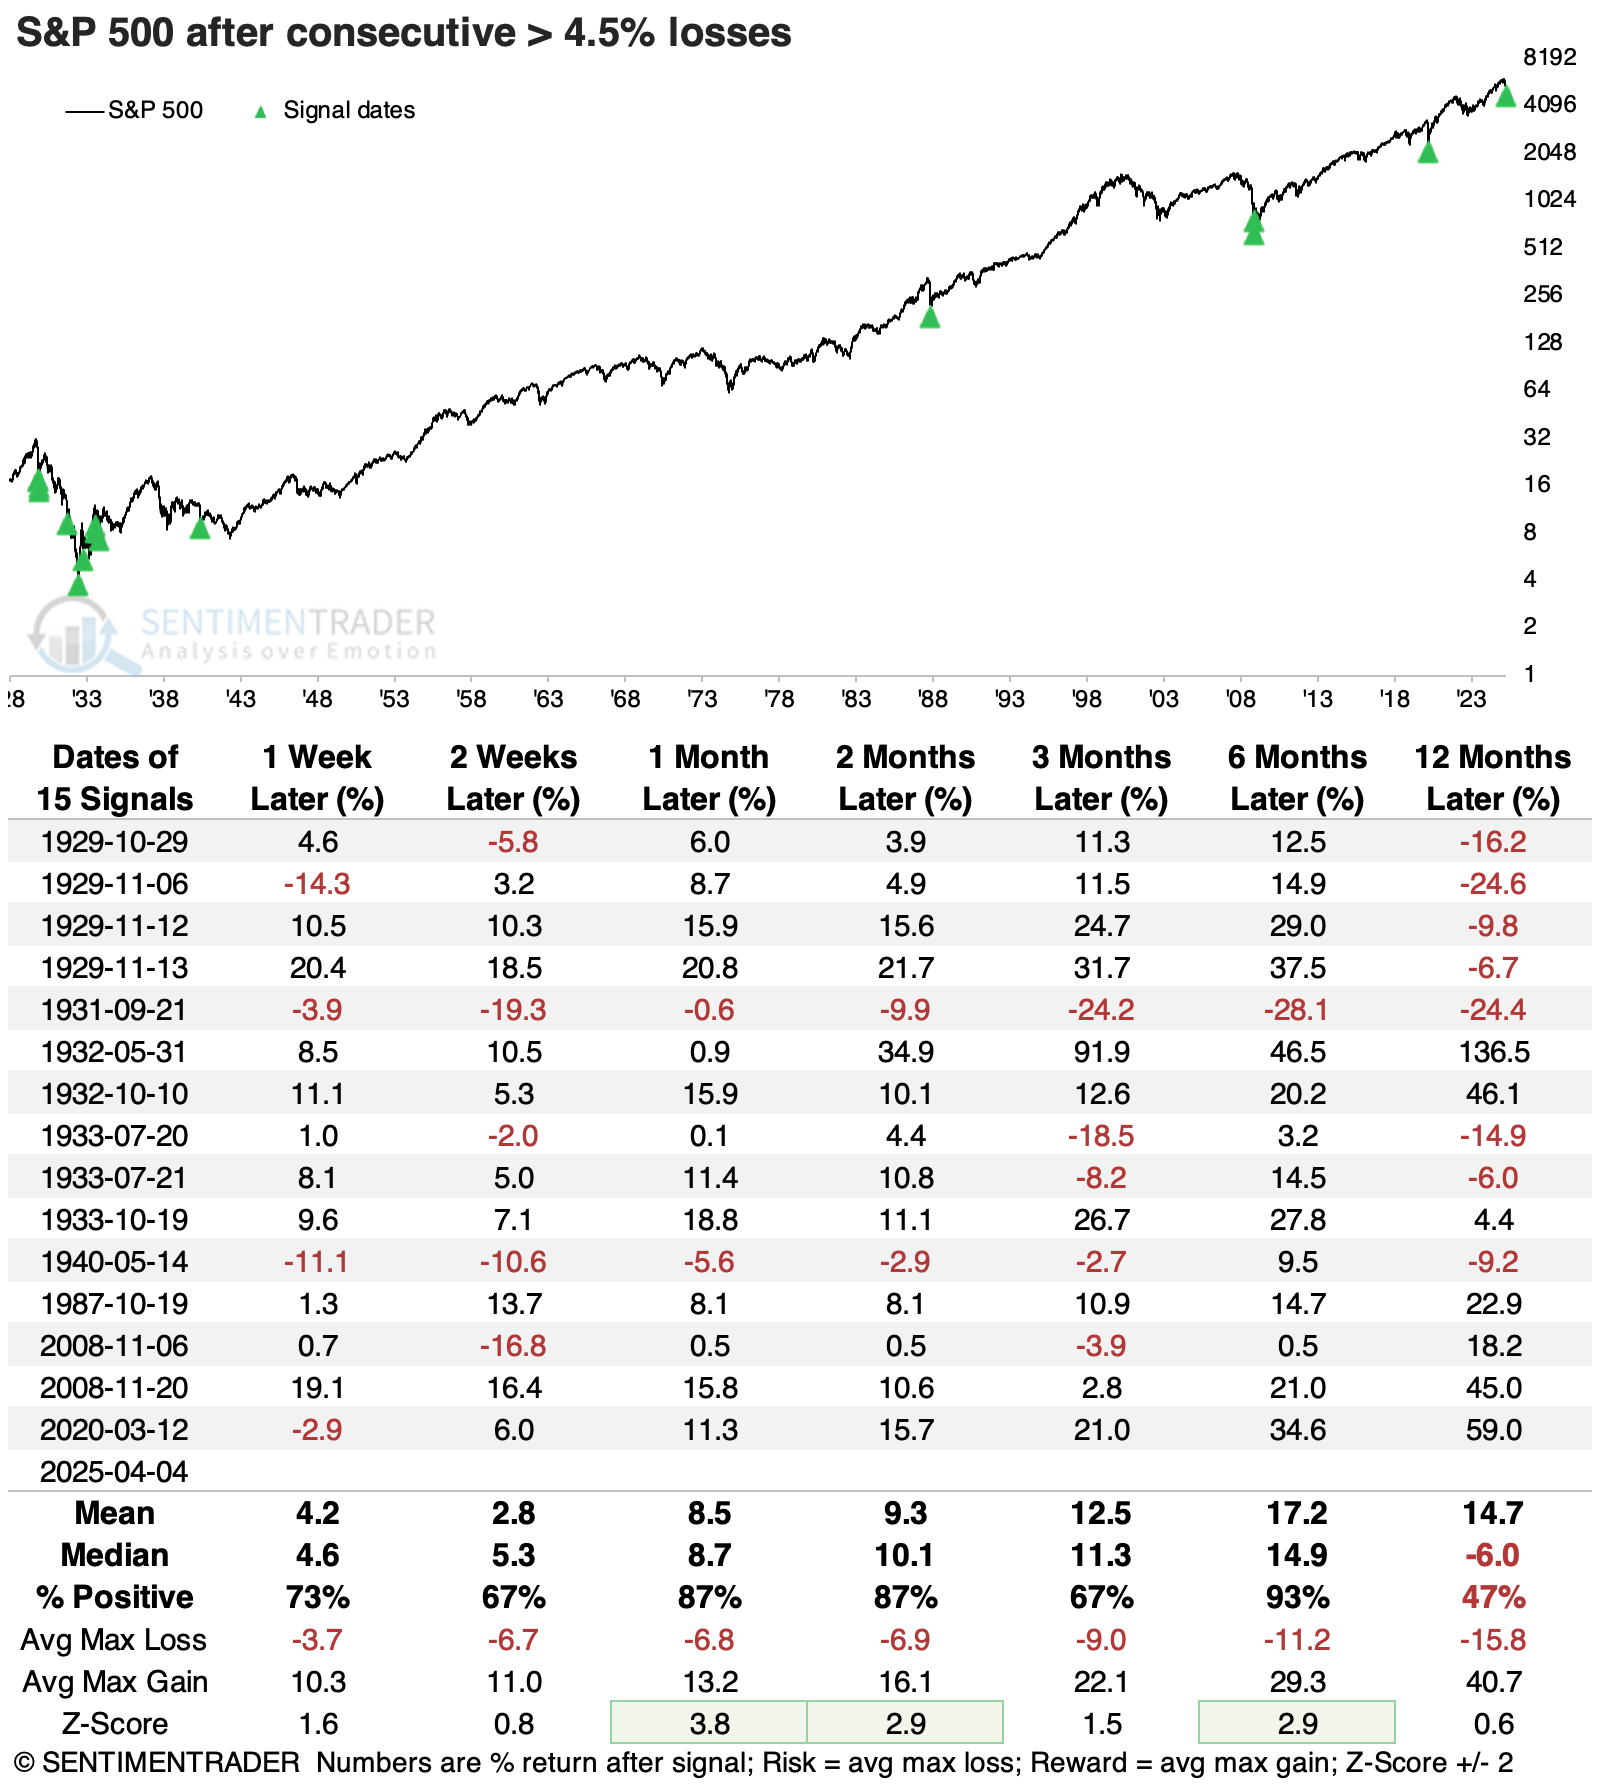
The last couple of sessions were the main reason why the S&P has endured few precedents magnitude-wise. Since 1928, the index has only had 15 instances of consecutive daily losses greater than -4.5%. Over the next one to two months, the S&P lost more ground only twice and only once over the following six months.
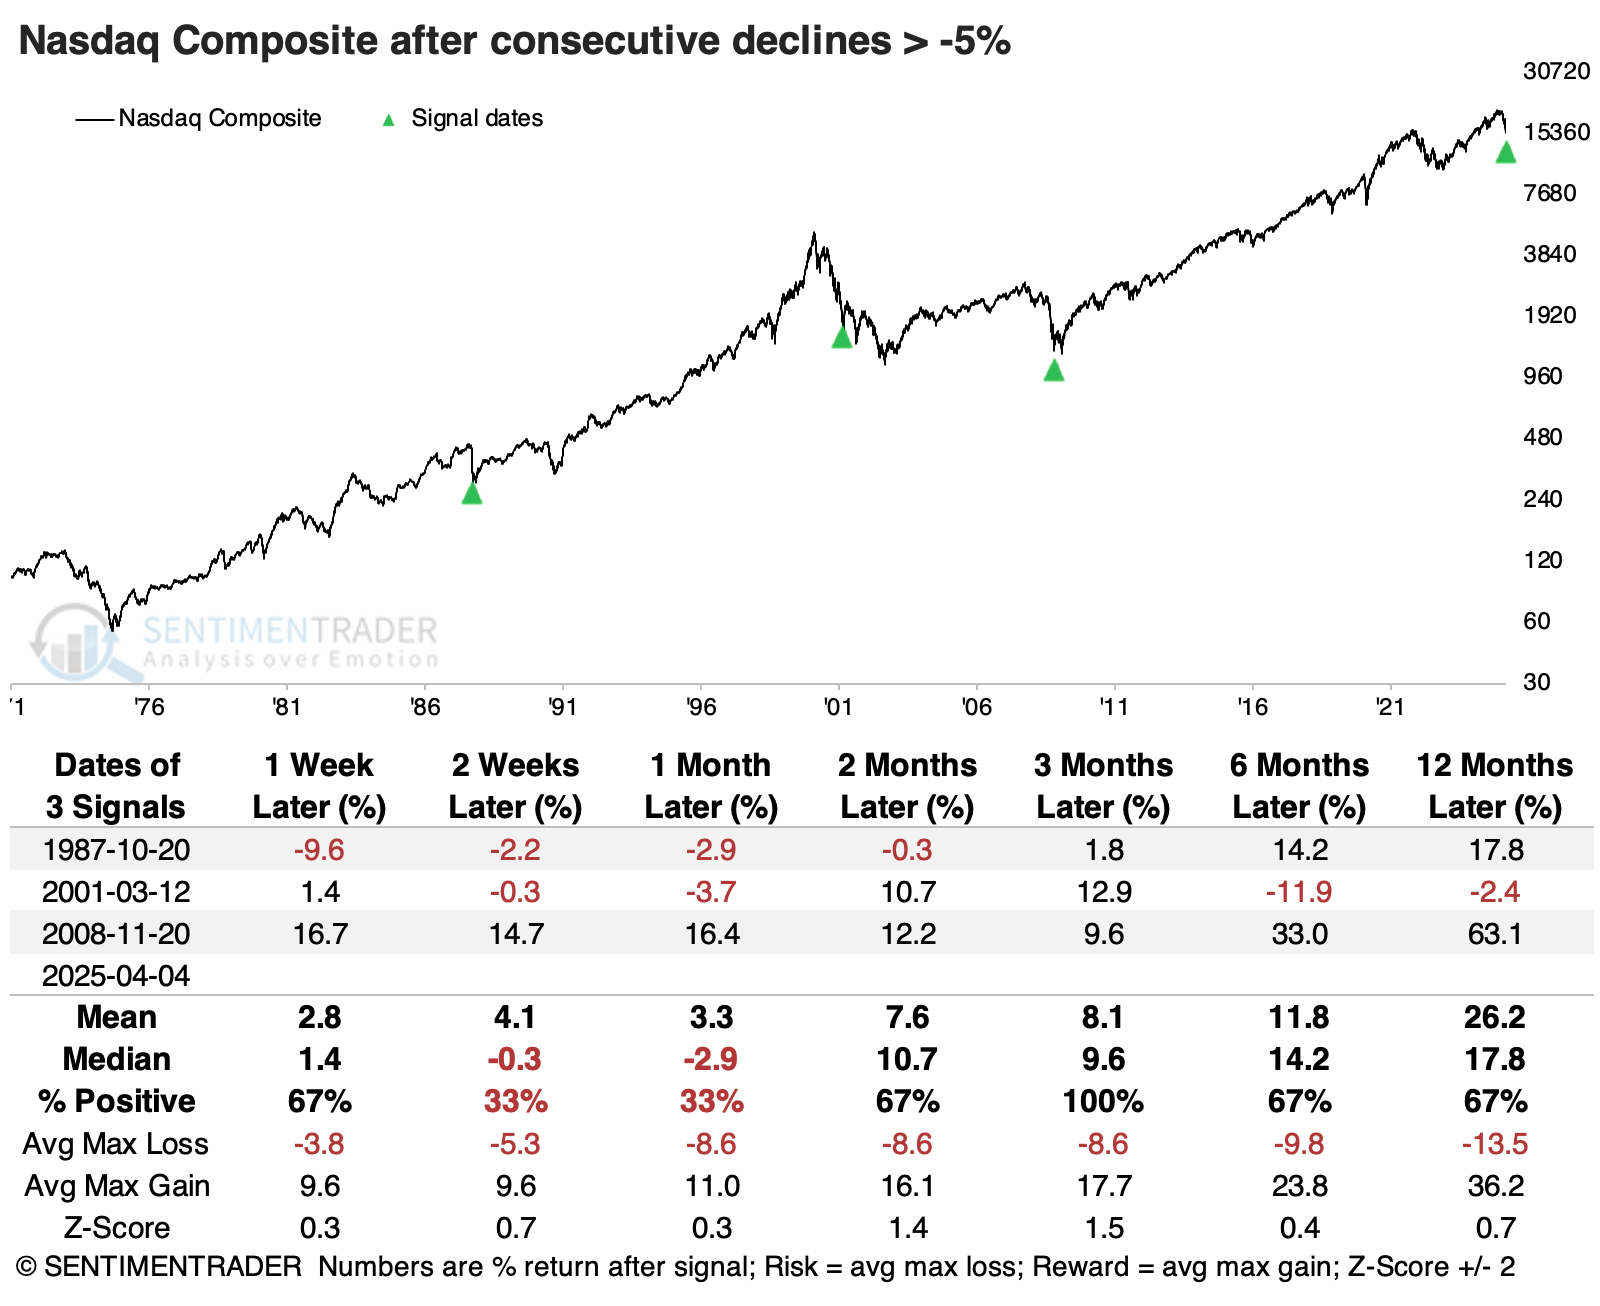
Even worse on the Nasdaq
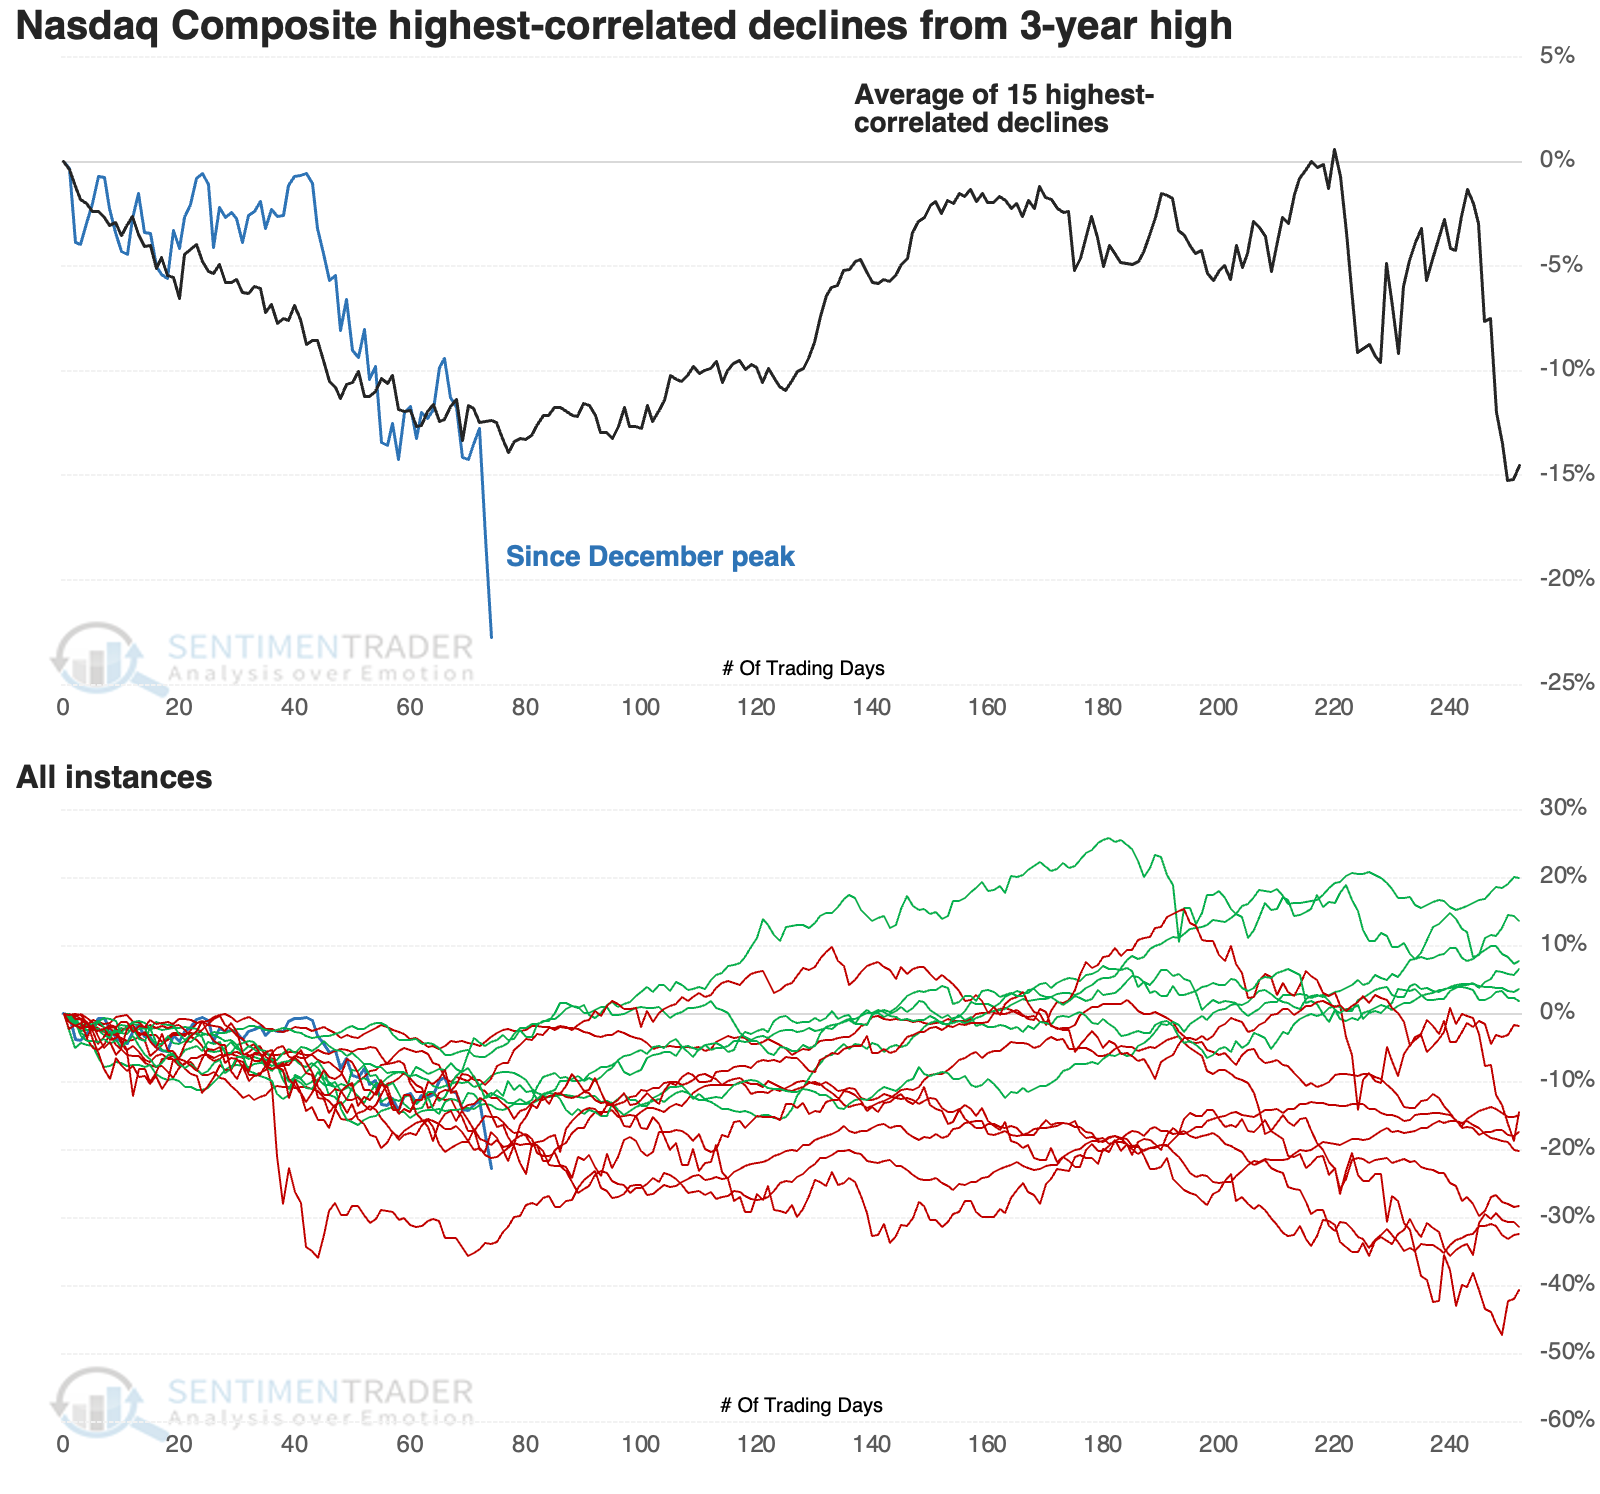
The Nasdaq Composite has suffered more than the S&P 500. While there have been more than a dozen sell-offs of similar direction, the magnitude of this decline is exceptional.
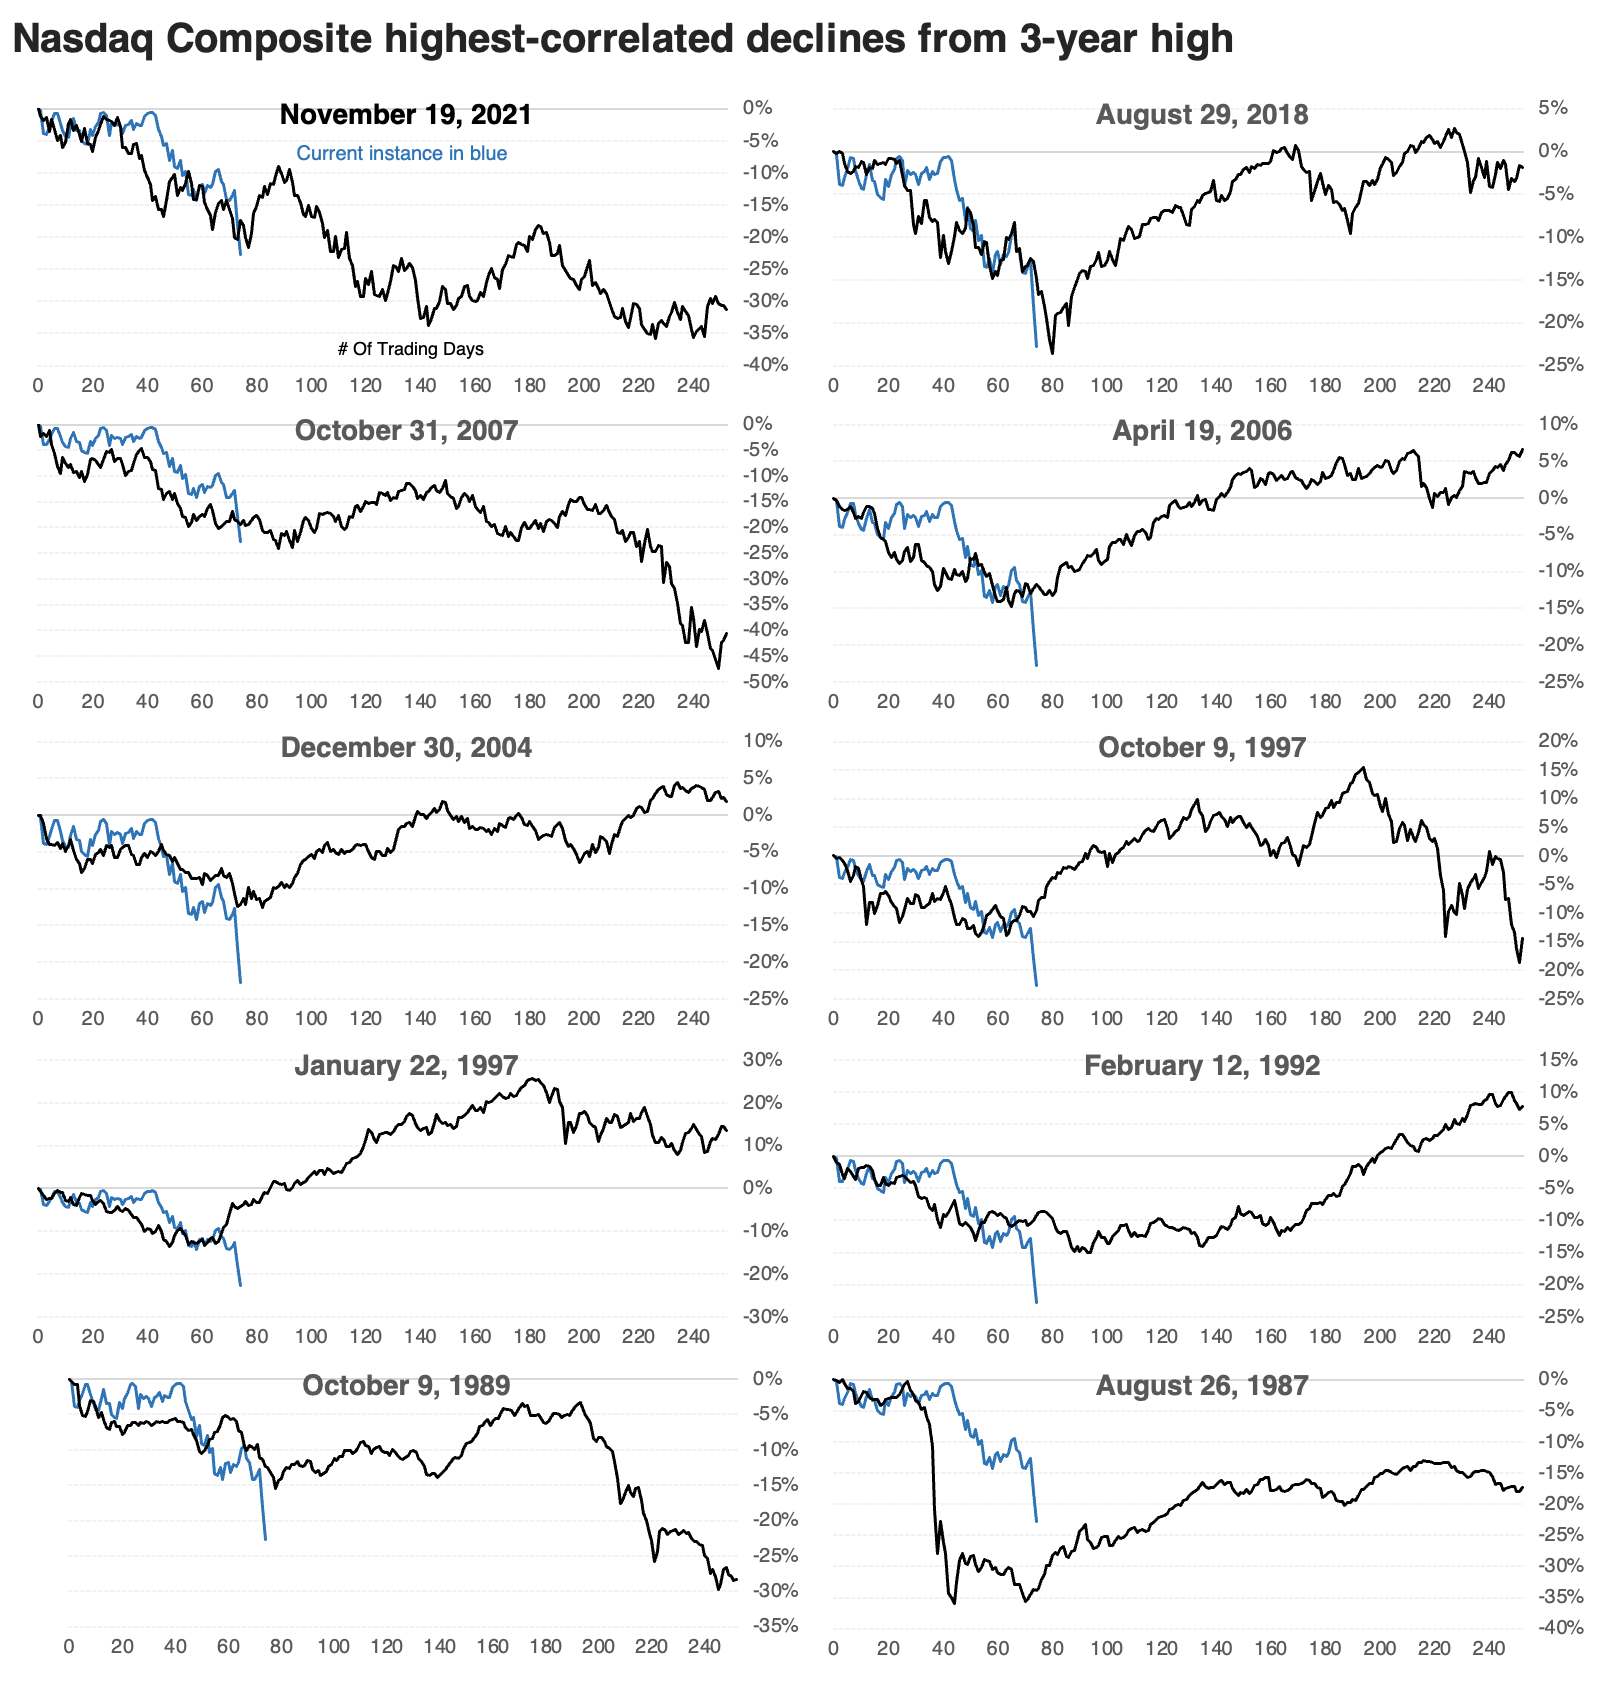
Several of the most recent are close in terms of both behavior and magnitude. The Nasdaq formed at least a short-term bottom after the similar selloff in 2021, 2018, and 2007, though two failed miserably.
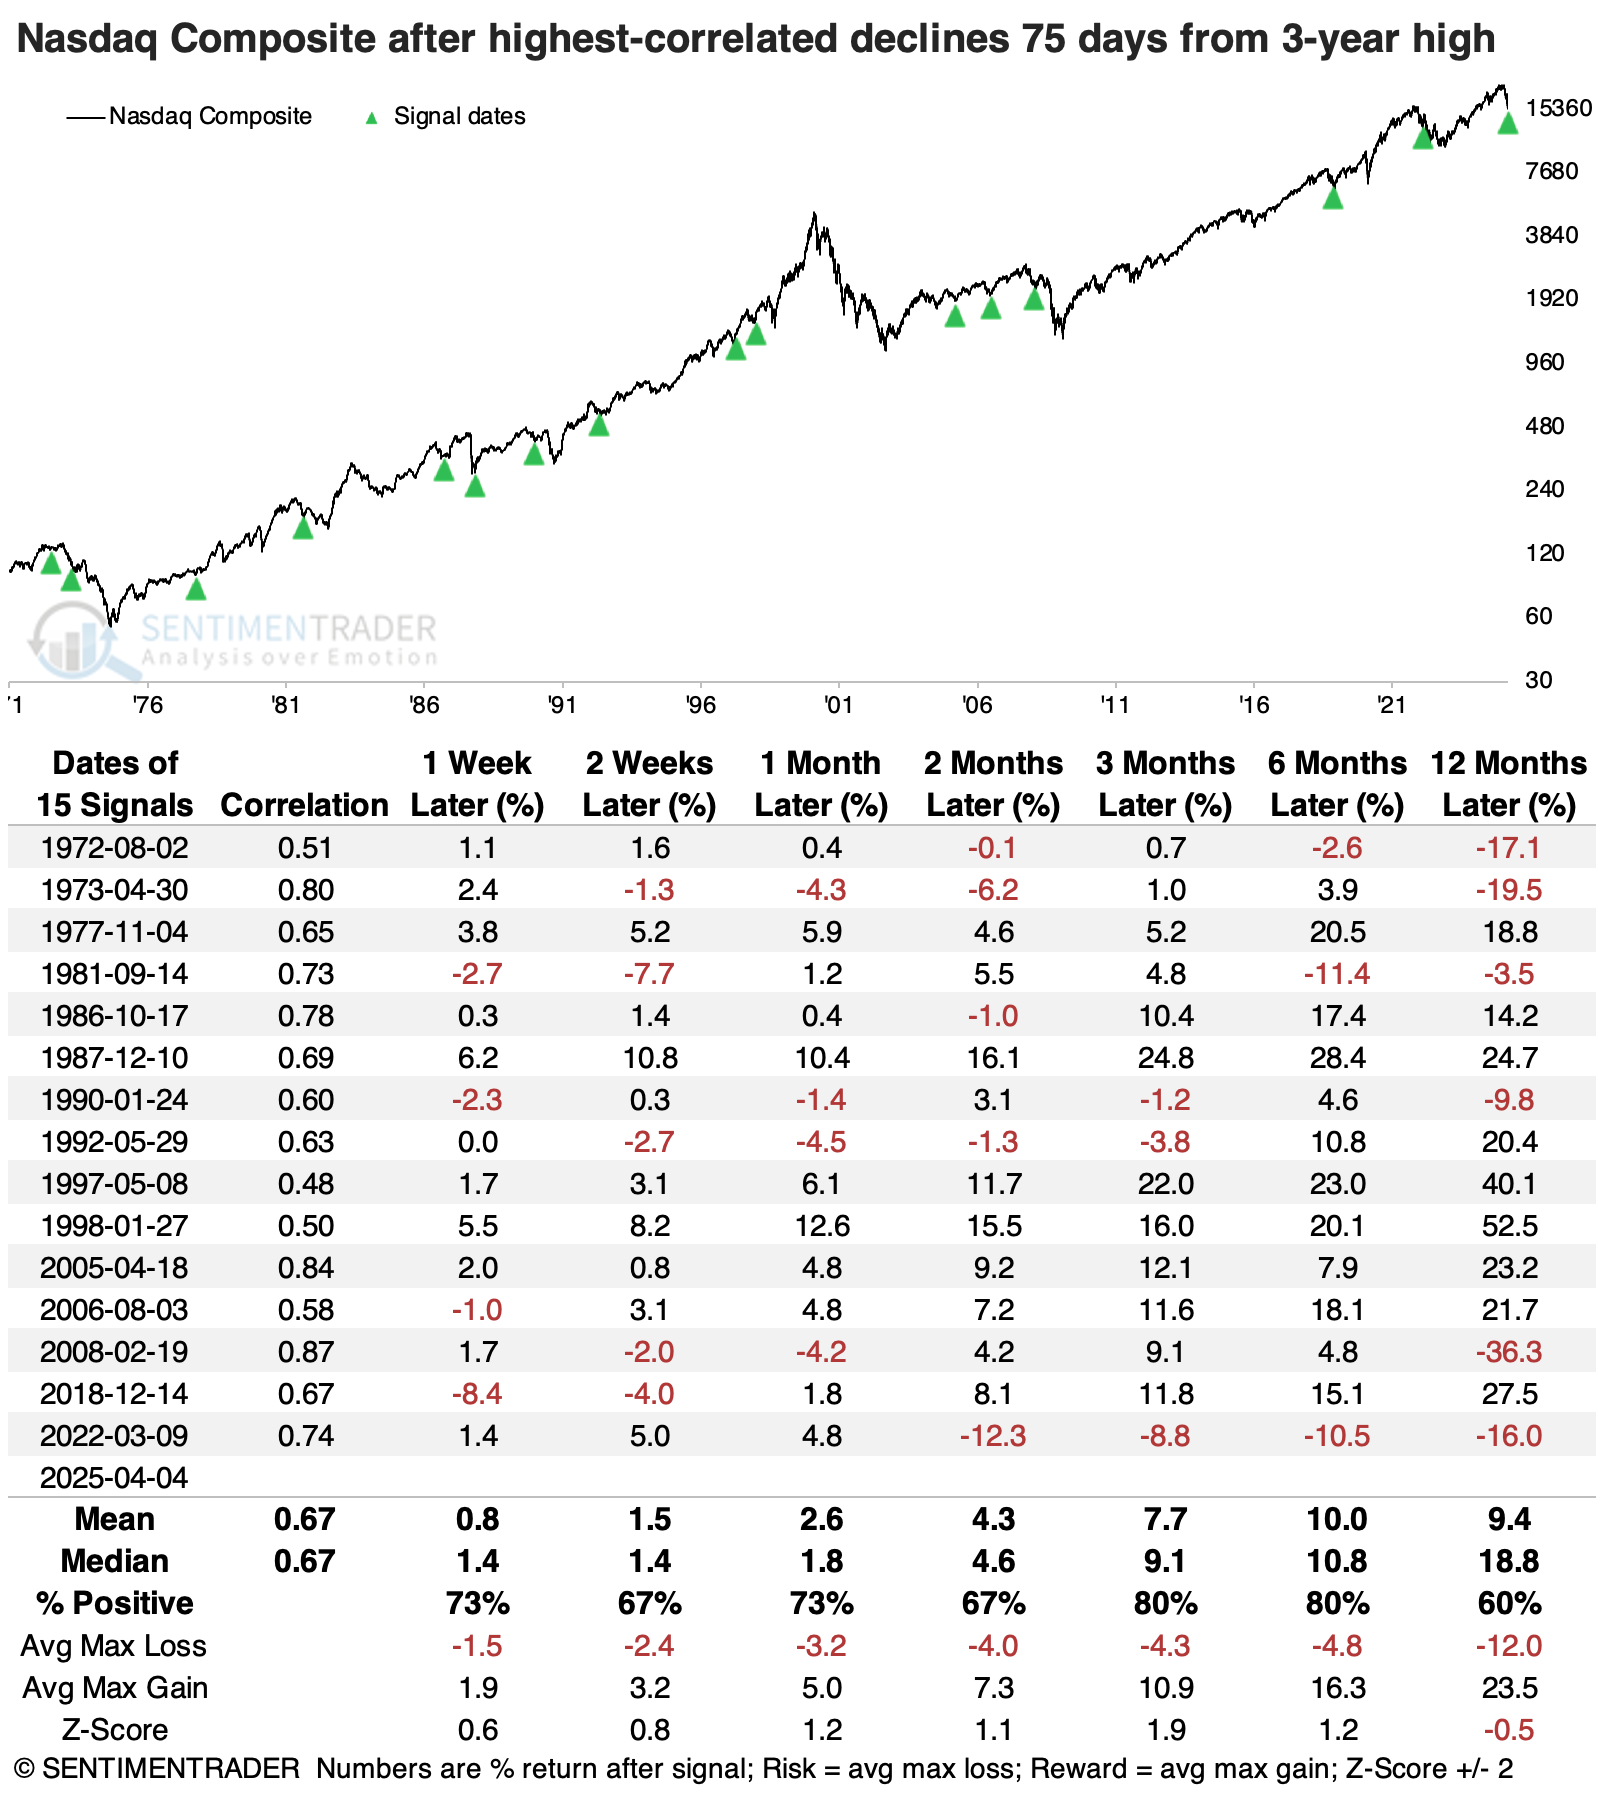
After the most similar declines, the Nasdaq mainly showed positive returns. The index witnessed a positive return either three or six months later after 14 of the 15 instances.
The past two days are only the fourth time the Nasdaq suffered back-to-back drops larger than -5%. The other three were the worst sell-offs in the index's history, during the 1987, 2001, and 2008 crashes. Even during those volatile times, the Nasdaq gained over the following three months each time.
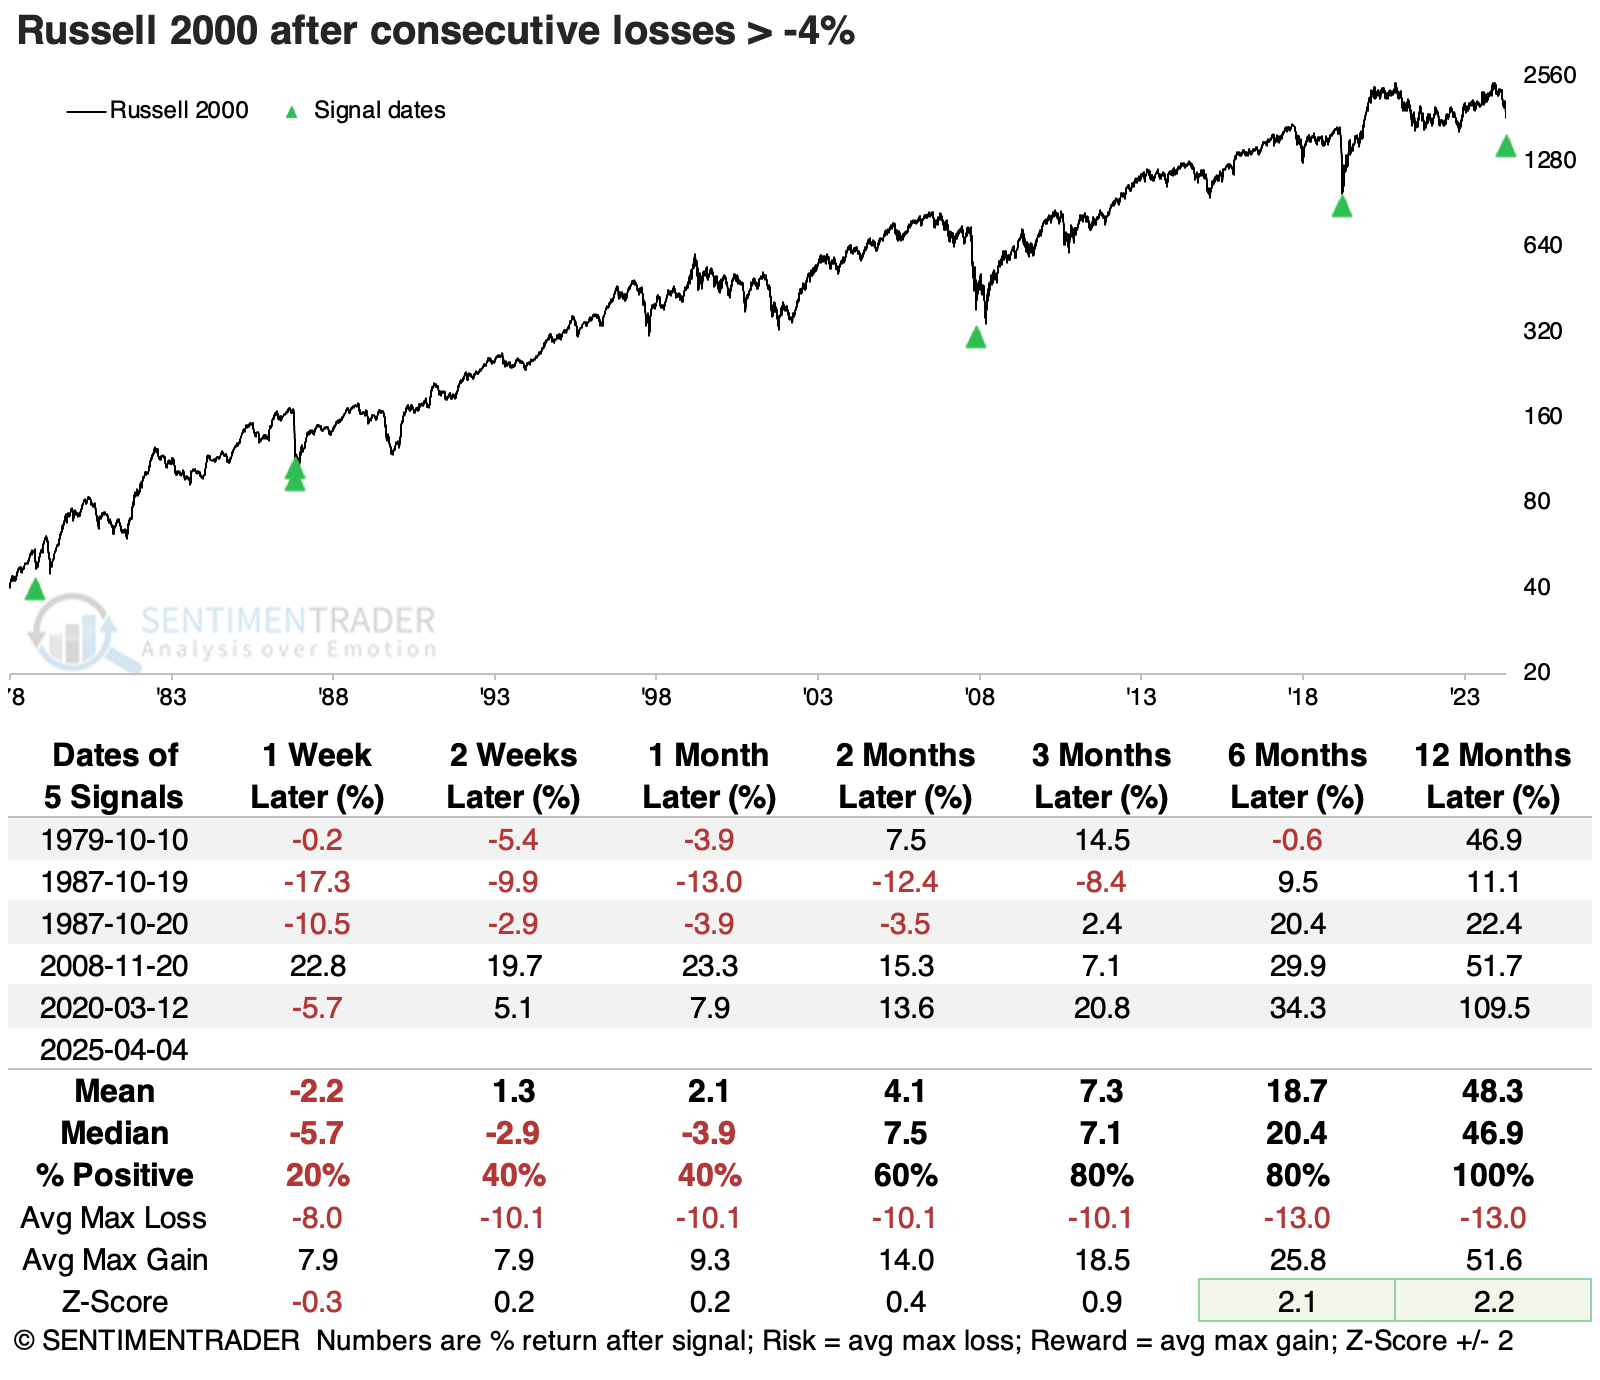
And the Russell 2000 was even worse than the Nasdaq
The small-cap Russell 2000 has endured losses more significant than the other two indices. Its decline has taken longer to play out, but the magnitude is accelerating.
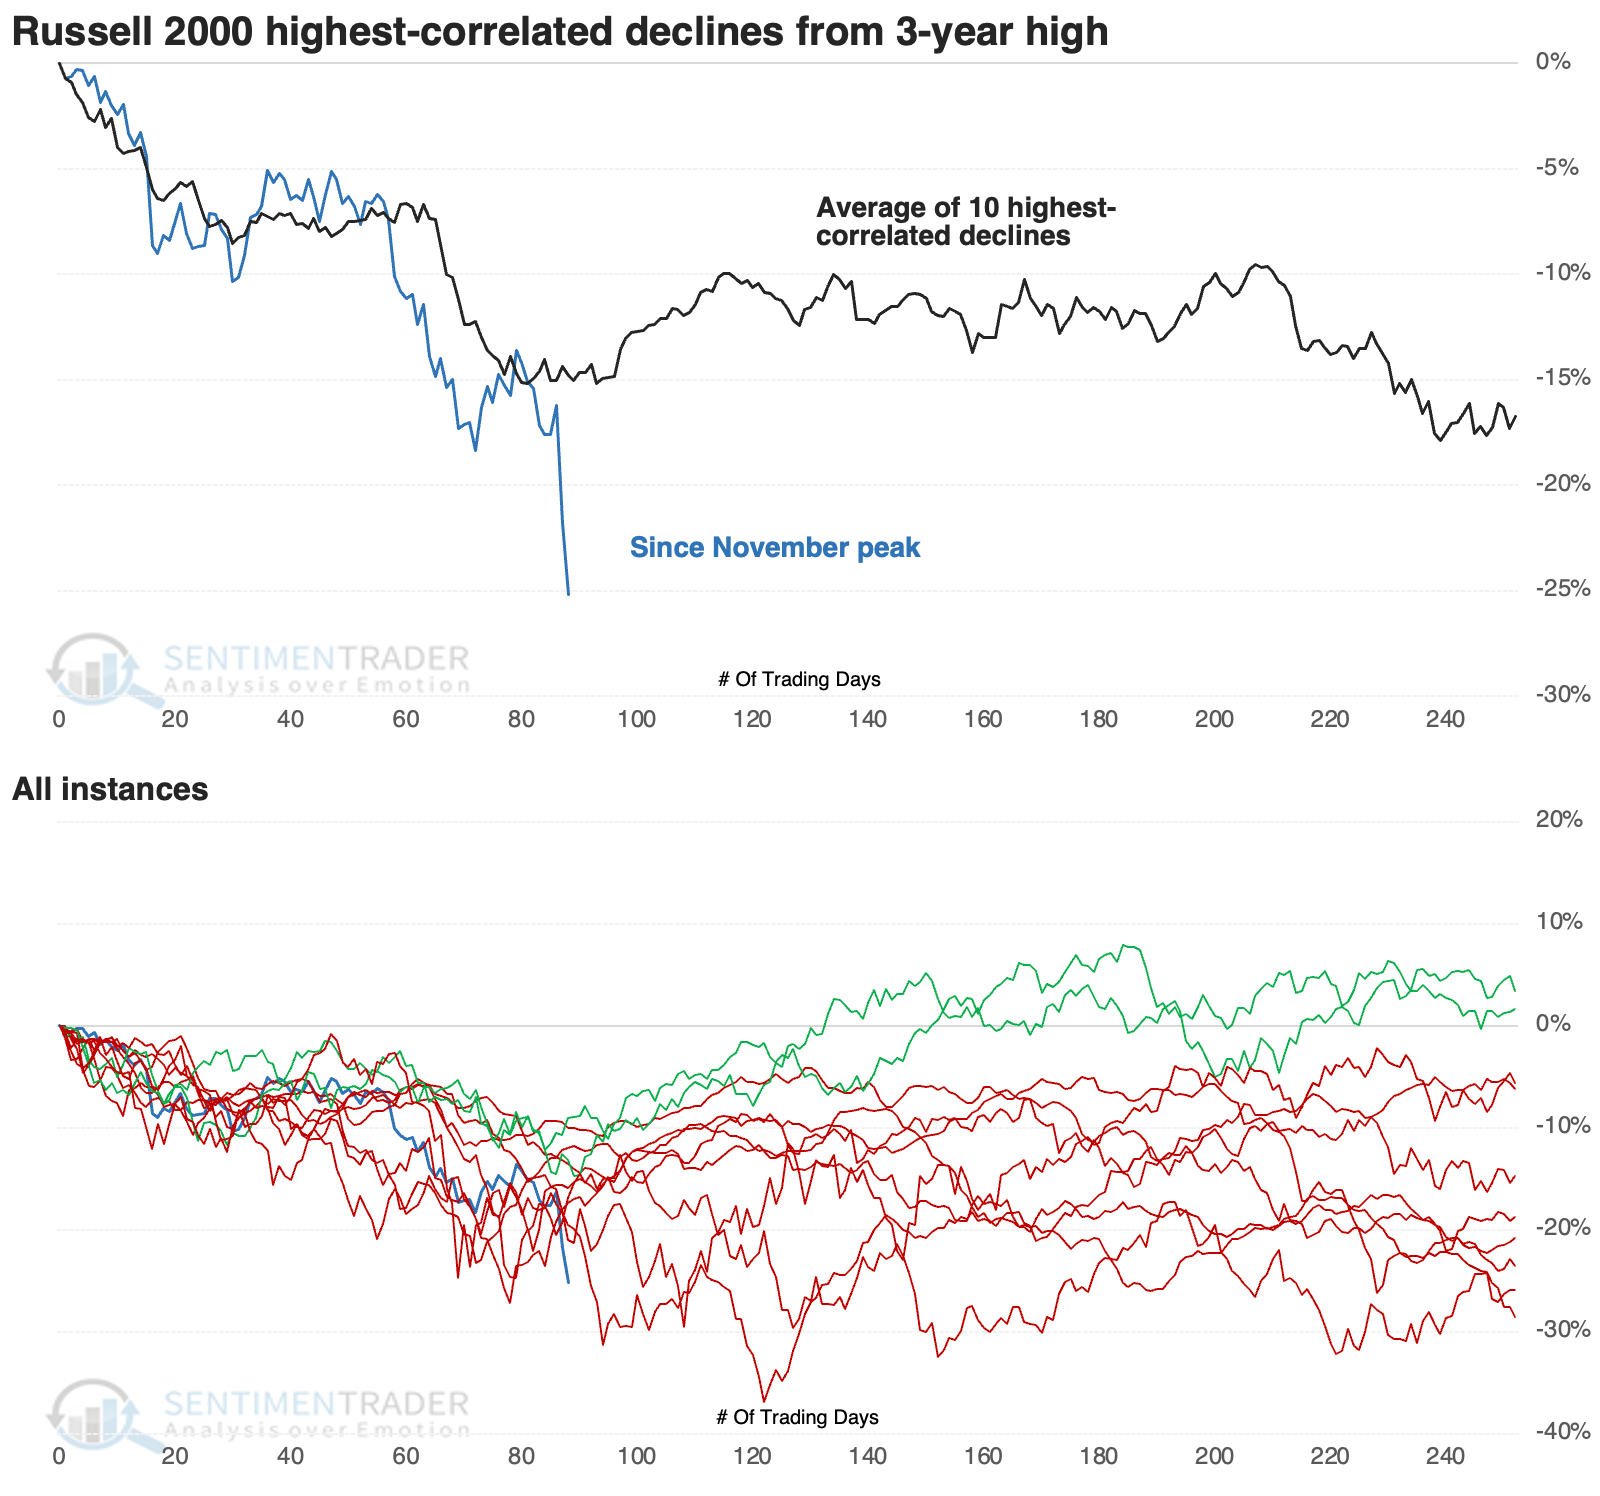
The losses were most similar in 2018, 2011, 1998, and 1981. The Russell showed mixed performance after those instances, but it was generally around at least a temporary bottoming phase.
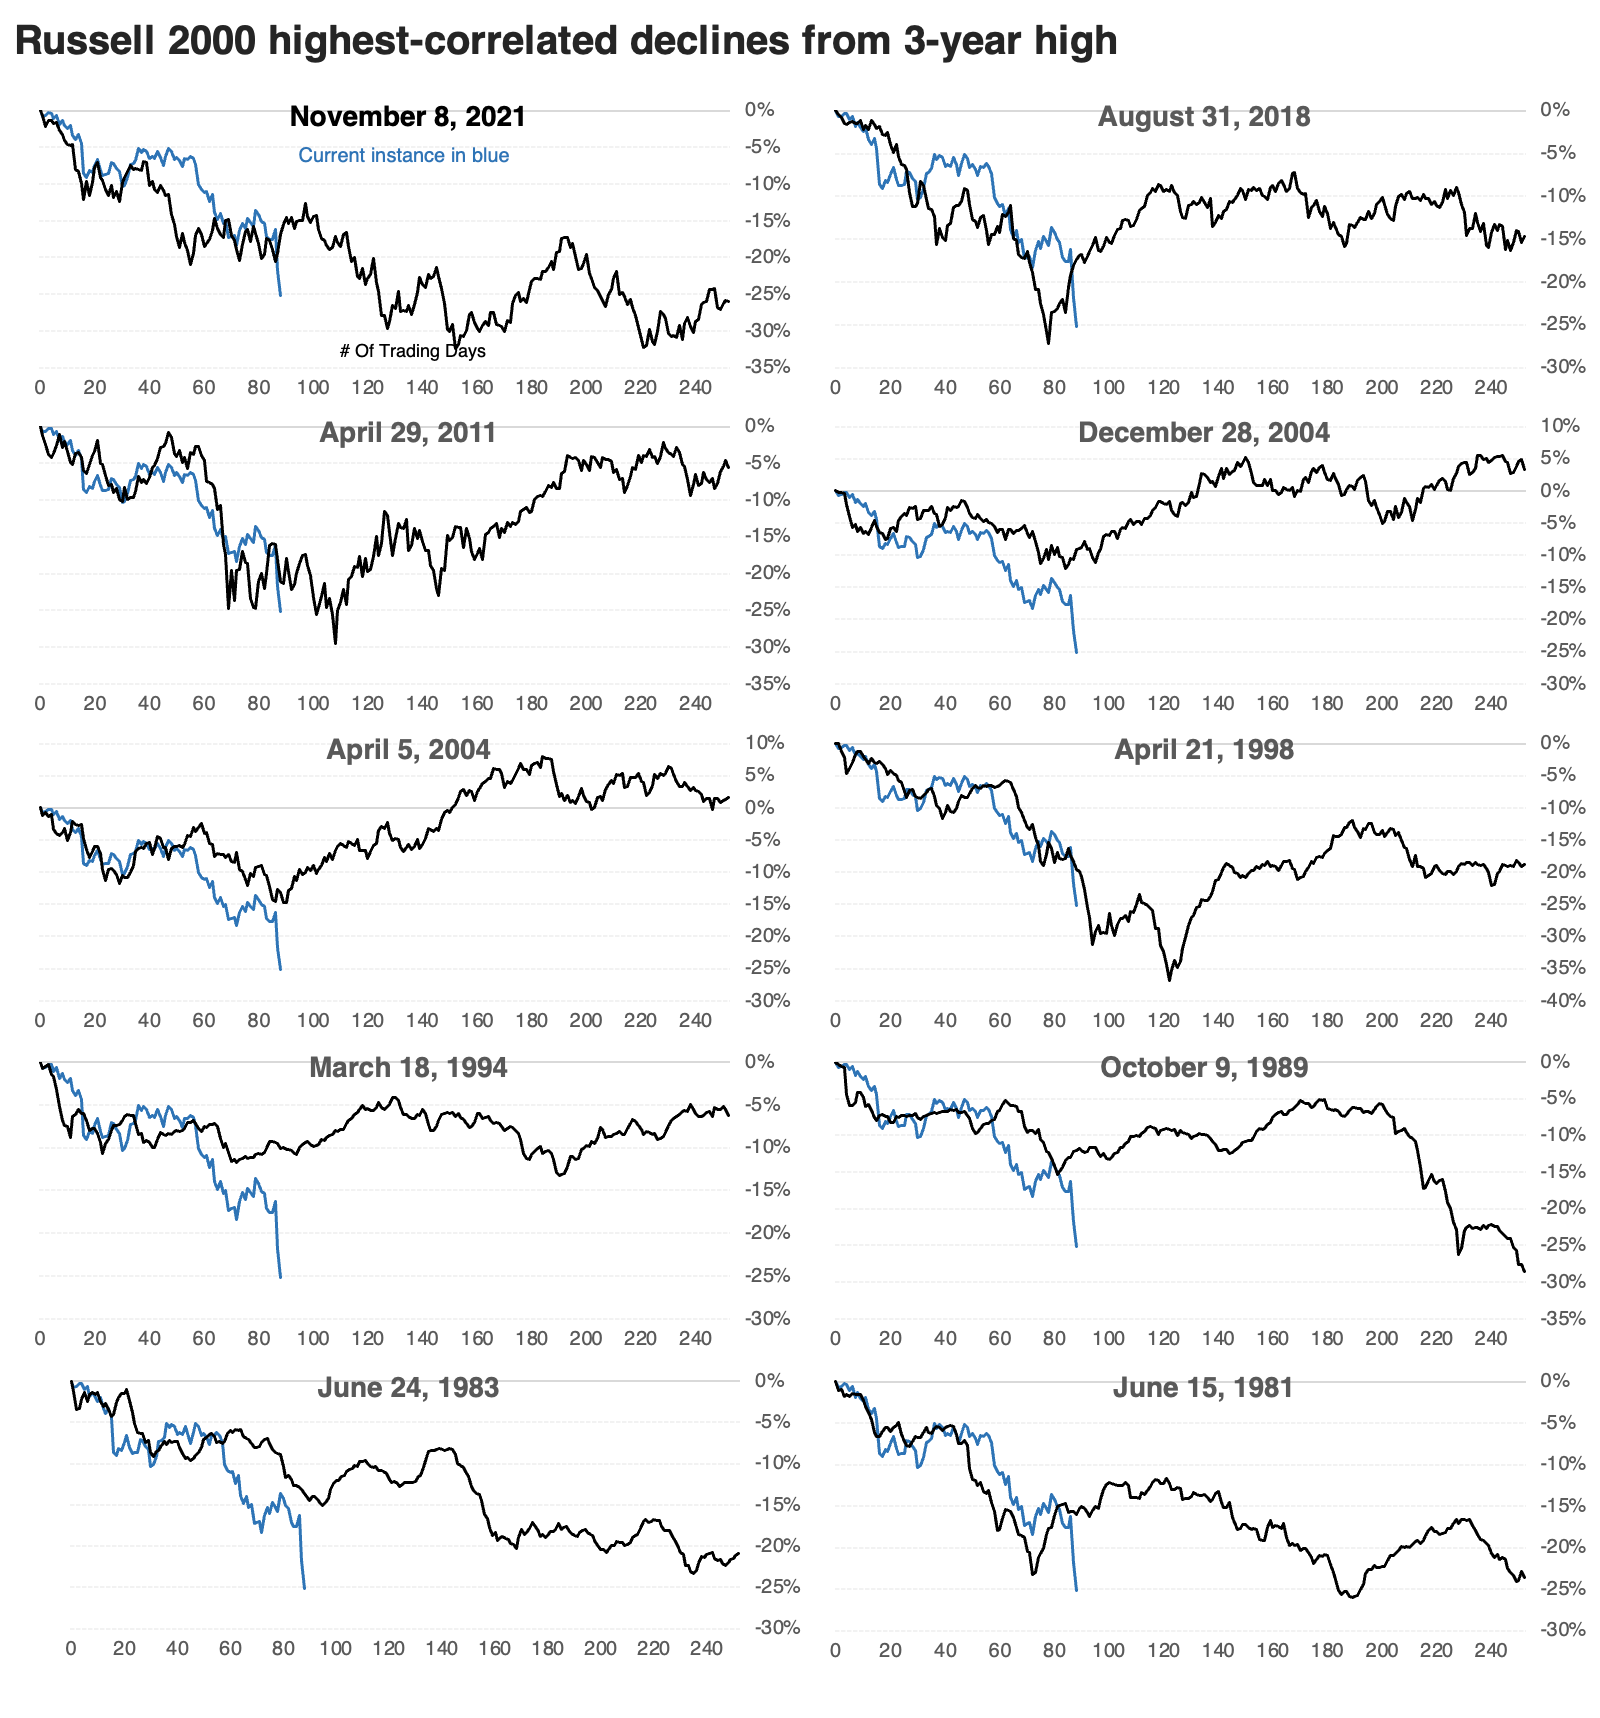
Overall, the Russell did tend to rebound over the next two months, with 1998 and 2022 being the notable exceptions. Those losses were also approximately when the index formed a more sustainable bottom.
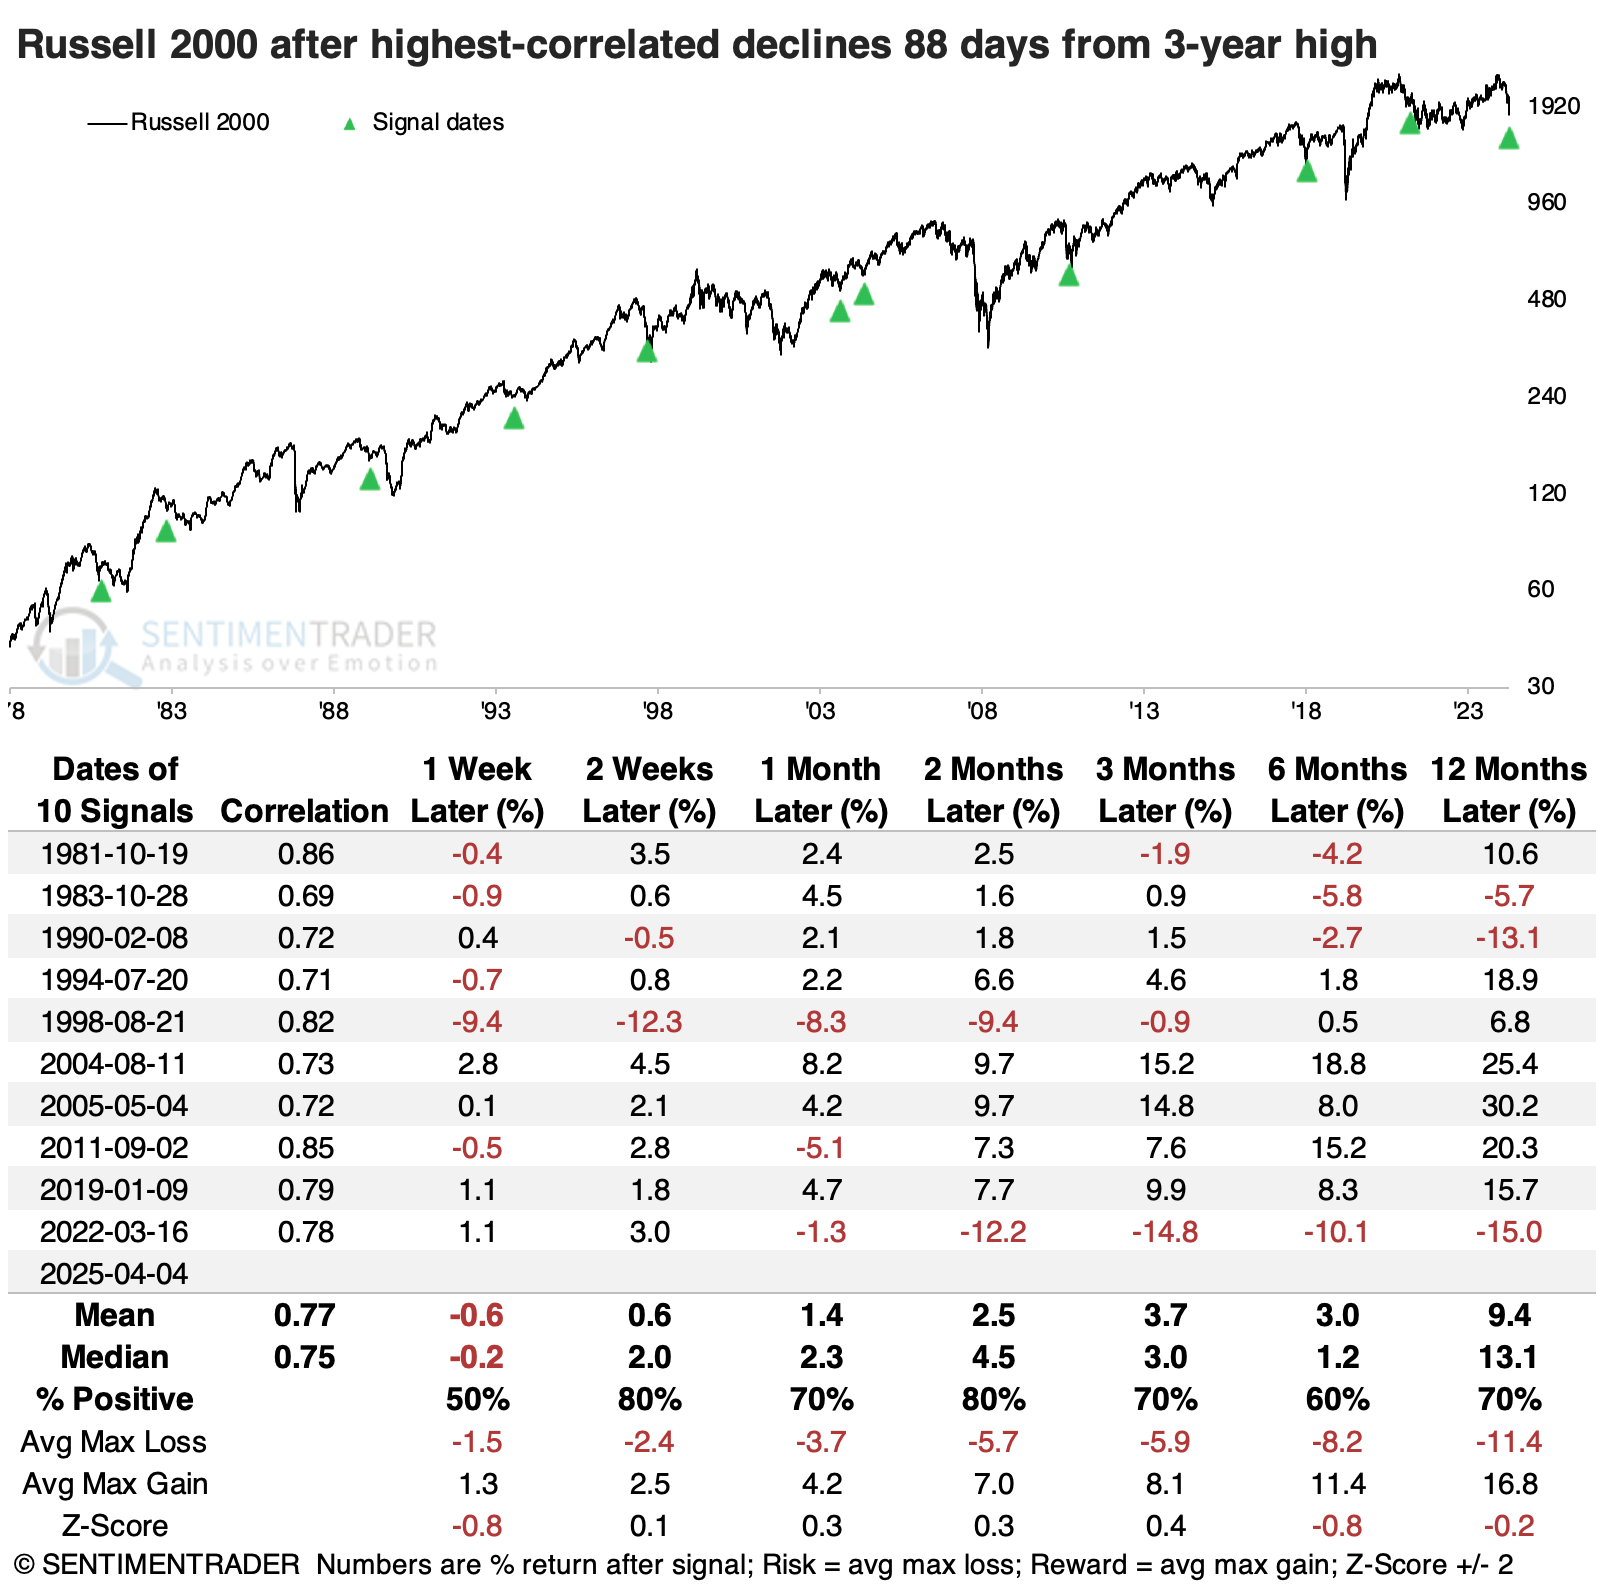
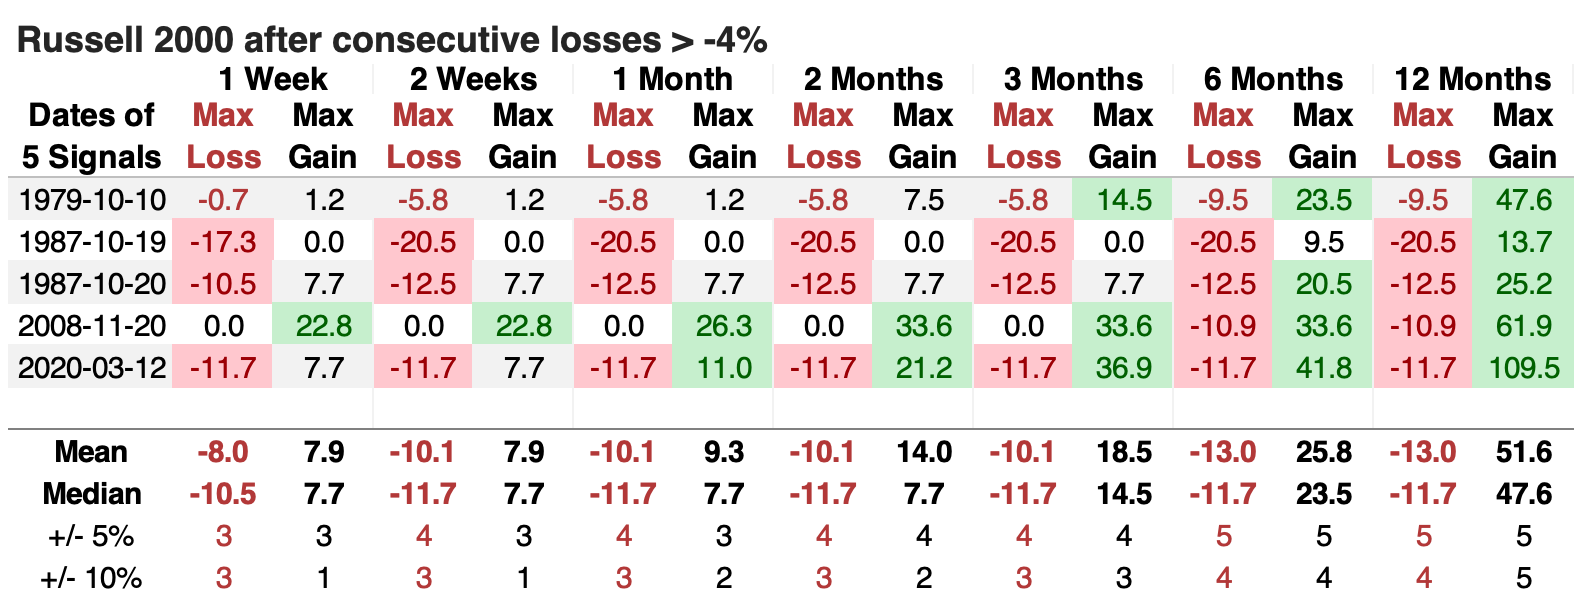
Losses in the Russell 2000 over the past two days have only five precedents. Dip-buyers suffered painful regret each time, except during the global financial crisis (for a while). But that short-term pain eventually preceded gains over the following year.
The table of maximum gains and losses across time frames shows that while the Russell suffered double-digit losses within the following year every time but once, its maximum gains were +48%, +14%, +25%, +62%, and +110%.
What the research tells us...
It's not our schtick to pretend to have any expertise in tariff strategy, political plotting, or economic ramifications. We prefer to look at investor behavior from a multitude of perspectives and see if we can glean some insight into how investors have behaved in the past. After testing thousands of indicators and correlations, we've found this approach to be the most reliable.
Just because it might be more reliable does not mean it's always right. Even during times of highest confidence, when nearly everything lines up in the same direction, this approach has a success rate that has hovered around 75% over the past two decades. And this is not one of those high-confidence times.
We'd spent much of late 2024 and early 2025 looking at the probability of limited upside and a preference for defensive areas of the market. As we've seen over the past week, volatility can quickly change those preferences, and we're starting to see some glimpses of that now. There isn't much of a smoking gun suggesting buying now is necessarily a wise move, especially for those with a conservative streak. After bouts like this, the generally better approach for risk versus reward has been to wait for signs of impressive and sustained buying interest. We're far from that yet.