
A Santa Claus rally in - Soybeans(?)

Key points
- Due to the planting cycle in the U.S. soybeans are one of the most reliable seasonal markets
- Soybeans have shown a tendency to advance late in the year
- However, from year-to-year to results can vary widely
Soybean strength is often - though notably, not always - evident late in the year
Due to the planting cycle in the U.S., soybeans have displayed reasonably reliable seasonal trends over many decades. In a nutshell:
- Late fall to early spring: There are no soybeans in the ground (there is doubt about next year's crop, price tend to rise)
- Early spring to late summer: Bean seeds are planted and grow (there are clues regarding the current year's crop, price typically rise)
- Late summer to late fall: Beans are harvested (the crop is known, price tend to decline as doubts are eliminated)
In a nutshell, from late fall into early summer, there are either no beans in the ground or beans are starting to grow. This is when doubt about the current crop is at its highest, and prices tend to rise as farmers hedge their crops and end users hedge their supply. During mid-summer into late fall, it is usually pretty evident if this year's crop is good or bad - and tends to be the time when prices are most likely to fall.
The chart below displays the annual seasonal trend for soybean futures. The green box in the chart highlights the period from Trading Day of Year (TDY) #209 and TDY #249. For 2023, this period extends from the close on 2023-10-31 through 2023-12-28.
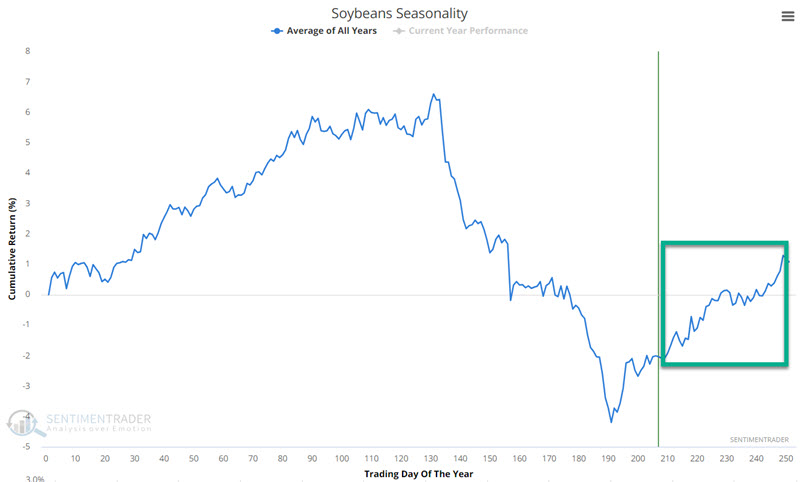
As you can see, soybeans tend to show strength late in the year. The relevant questions then become, "How much strength?" and "How often?"
A closer look at the late-year period
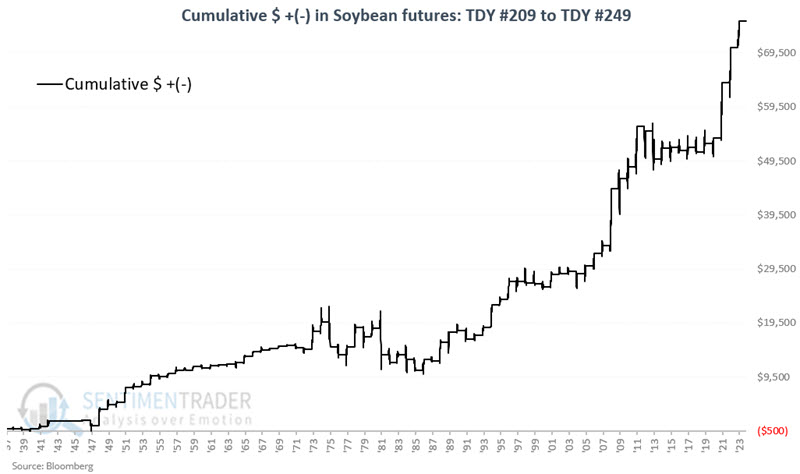
The chart below displays the hypothetical cumulative $ gain/loss achieved by holding long one soybean futures contract during the TDY #209 through #249 period every year since 1937.
The table below summarizes soybean futures performance results.
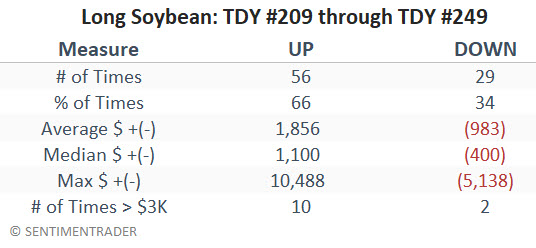
It is important to note that the Win Rate is not exceptional (66%). However, the Average and Median gains were significantly greater than the Average and Median losses and moves over $3,000 skewed 10 to 2 in favor of winners.
Non-futures traders who wish to consider gaining exposure to the soybean market can buy shares of the Teucrium Soybean Fund (ticker SOYB) in a standard stock brokerage account. Shares of SOYB can be bought and sold just like shares of stock. The fund is designed to track the S&P GSCI Soybeans Index.
More relevant information regarding SOYB from ETF.com/SOYB:
SOYB tracks an index of soybean futures contracts. It reflects the performance of soybeans by holding Chicago Board of Trade soybean futures contracts with three different expiration dates.
SOYB is the first ETF option for pure exposure to soybeans. The fund allocates exposure to three soybean futures contracts: holding 35% exposure to the second month to expire, 30% to the third month, and 35% to the November contracts. The fund avoids August and September contracts. This laddered strategy sets SOYB apart from its front-month benchmark, as it can work in its favor should soybeans fall into steep contango. Structured as a commodities pool, SOYB distributes K-1 forms and is marked-to-market yearly. Short-term traders can benefit from 60% of all gains being taxed as long-term, regardless of the holding period. But on the flip side, long-term holders may find the tax consequences troublesome since there's no beneficial tax rate for holding over one year.
A bigger picture look at soybean seasonality
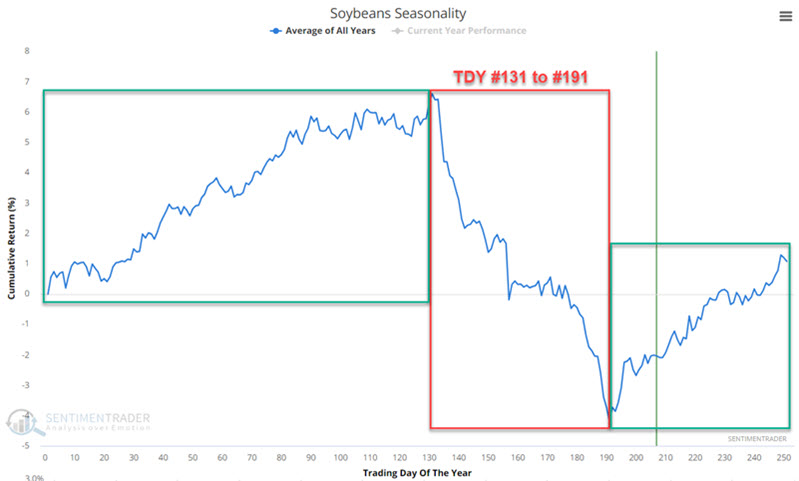
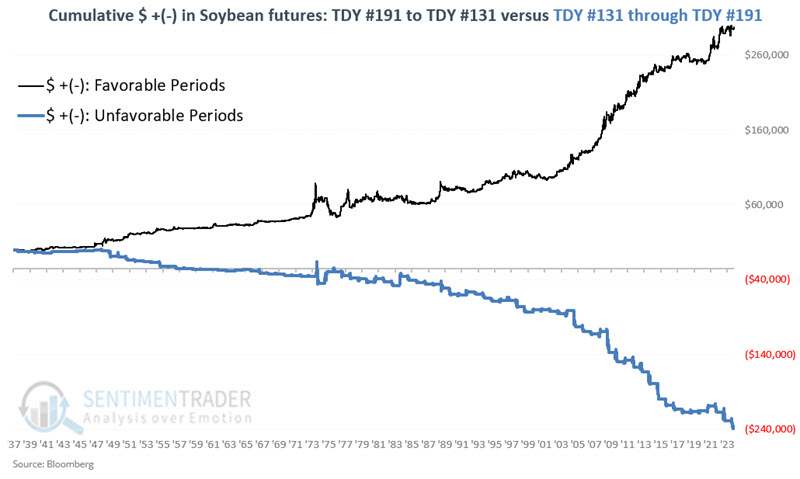
A bigger-picture look at soybean seasonality finds that the year can be divided into two halves. In the chart below, the period in red extends from TDY #131 to TDY #191 (essentially the Late summer to late fall period mentioned above) and is considered "seasonally unfavorable." The rest of the year - from TDY #191 to TDY #131 the next year - is considered "seasonally favorable." Does this matter?
The chart below displays the hypothetical cumulative $ gain/loss from holding long one soybean futures contract during the TDY #191 through #131 the following year (black line) versus holding long one soybean futures contract during the TDY #131 through TDY #191 period (blue line) every year since 1937. The difference is stark.
The chart below displays the hypothetical growth of $1 similarly invested in SOYB since SOYB started trading in 2011.
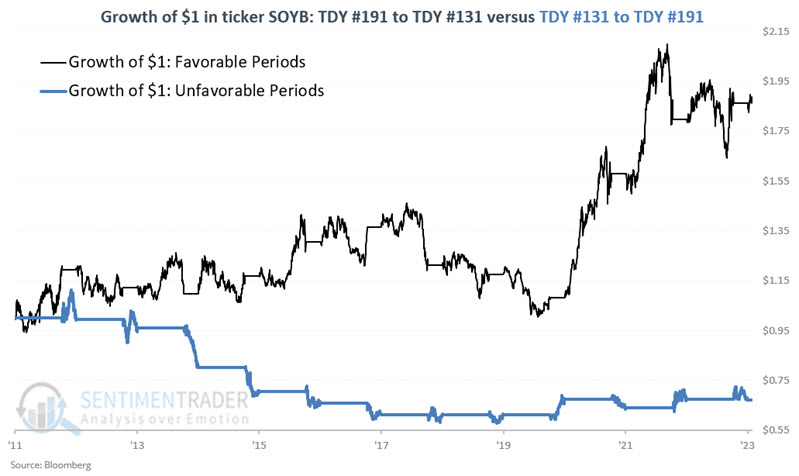
While "favorable periods" have witnessed some choppy action at times, the relevant point here is that a trader would have come out ahead being bullish during the "favorable" periods and bearish during the "unfavorable" periods.
What the research tells us…
The good news is that soybeans have been a reliable seasonal market for over eight decades. The other good news is that non-futures traders can now gain exposure to the soybean market via ticker SOYB. The bad news is that the term "reliable" in no way implies a "sure thing" on a year-to-year basis. Losses on long or short trades must be expected, and "reliable seasonality" does not relieve a trader of their responsibility to intelligently allocate capital and ruthlessly control risk.