
A S-TCTM Risk Warning Model member triggers a risk-off signal

Key points
- A specific component of the S-TCTM Risk Warning Model has triggered an alert due to an unusual concentration of new lows occurring within the Financial sector.
- Historically, when Financials dominate the new low list while the S&P 500 is near its highs, the broader market tends to suffer negative returns over the following month.
- Despite this localized warning, the broader Composite Risk Warning Model has not yet triggered, as other confirming components remain quiet.
Financial sector weakness flashes a warning
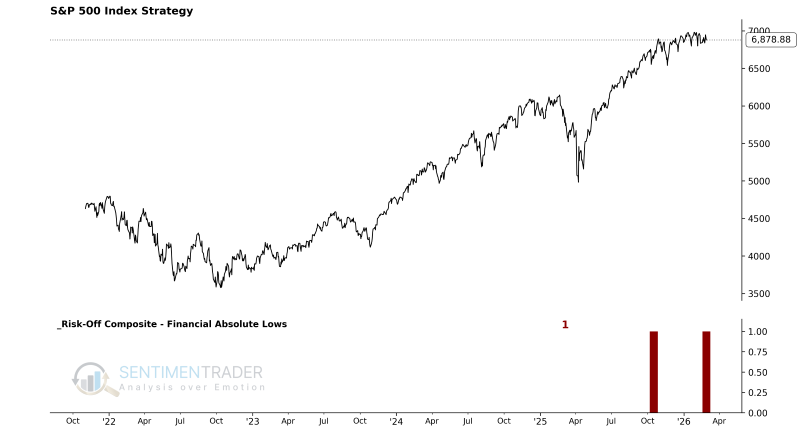
Monitoring the Percentage of Financial Sector Member Lows Risk-Off Model reveals that the percentage of 63-day lows in the S&P 500 Financial sector relative to the total 63-day lows in the broader S&P 500 has exceeded 38%. Furthermore, the percentage of Financials making new 63-day lows is ≥ 12%, all while the S&P 500 Index remains within 3.0% of its 500-day high. This specific combination has triggered a risk-off signal for this individual member of the S-TCTM Risk Warning Model.
The last time this specific warning occurred was in October 2025. It was an isolated event, highlighting the principle that no single indicator or model should be used in isolation. A weight-of-the-evidence approach is always preferable.
The Financial Absolute Lows model is designed to identify when a high proportion of lows within the S&P 500 are coming from the Financials sector, and when the percentage of lows within the Financial sector itself is unusually high.
Signal Criteria
- Condition 1 = The percentage of S&P 500 63-day lows that are Financials members is >= 38%. (i.e., Financials dominate the new low list).
- Condition 2 = The percentage of S&P 500 Financials members making a 63-day low is >= 12.0%. (i.e., weakness is broad within the sector).
- Condition 3 = S&P 500 is <= 3.0% from its 500-day high.
- If Conditions 1-3 are true, reduce market exposure.
Current Day Chart
A trend of concentrated Financial lows precedes negative returns
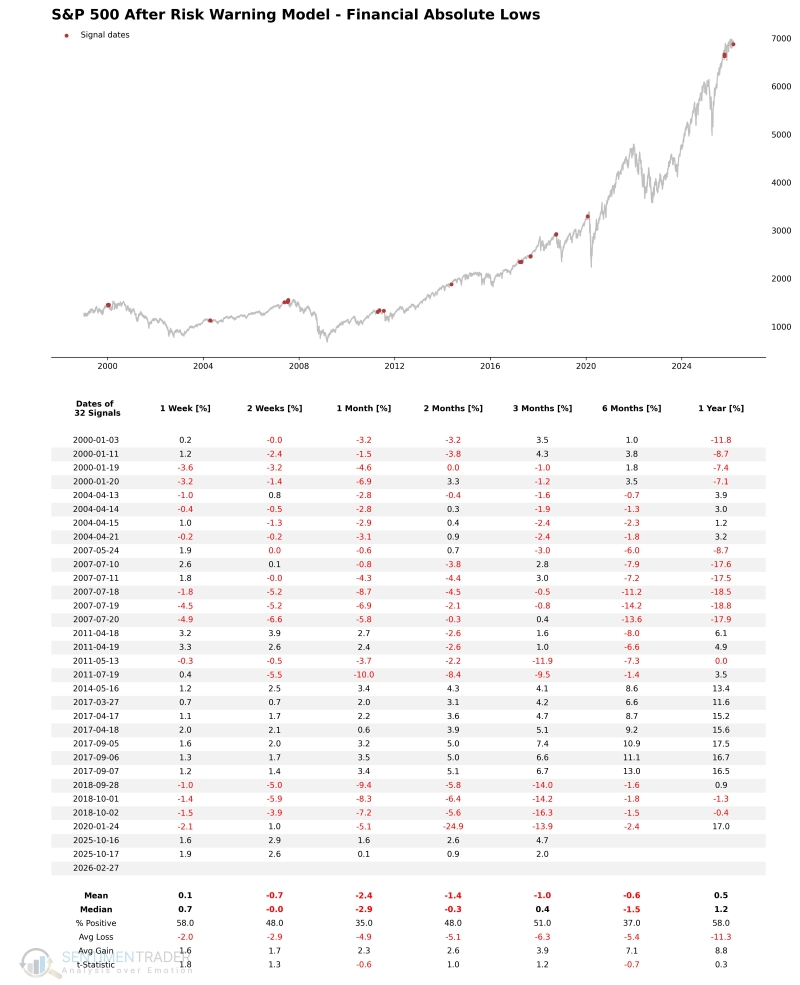
When Financials dominate the new low list (>= 38% of total S&P 500 lows), widespread sector weakness is apparent (>= 12% of Financials at lows), and the S&P 500 remains within 3.0% of a long-term high, the world's most benchmarked index typically experiences negative returns and unfavorable win rates over the subsequent month. While the S&P 500 often eventually recovers, its expected performance over the next one to six months remains inferior to its historical baseline trend.
A single arrow is easily broken, but not ten in a bundle
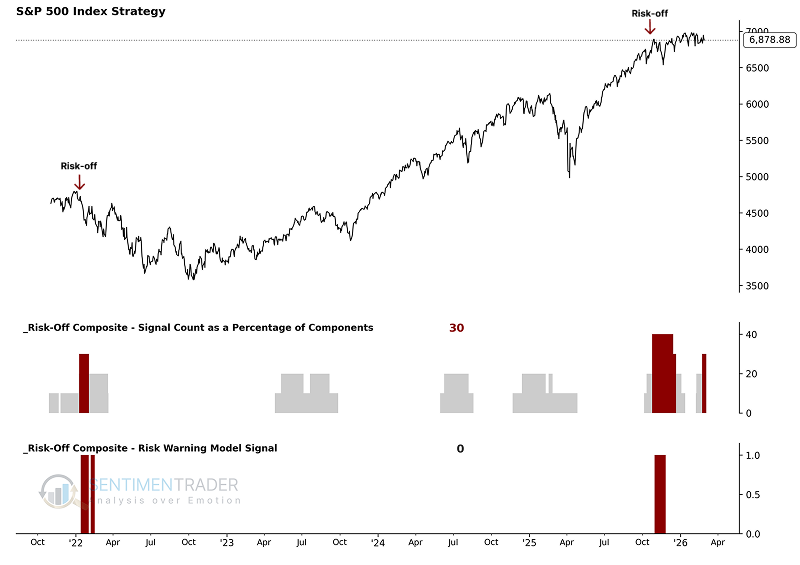
For the broader Composite Risk Warning Model to issue a formal alert, the composite signal count must reach a threshold of at least 30%, AND the S&P 500's 5-day rate of change must be -1% or worse within a 20-day window. Currently, this overarching condition has not been met.
It is common for the signal count to increase without reaching the trigger threshold for the composite model. Typically, this denotes sector rotation rather than systemic failure.
Below are the details of the components within this composite.
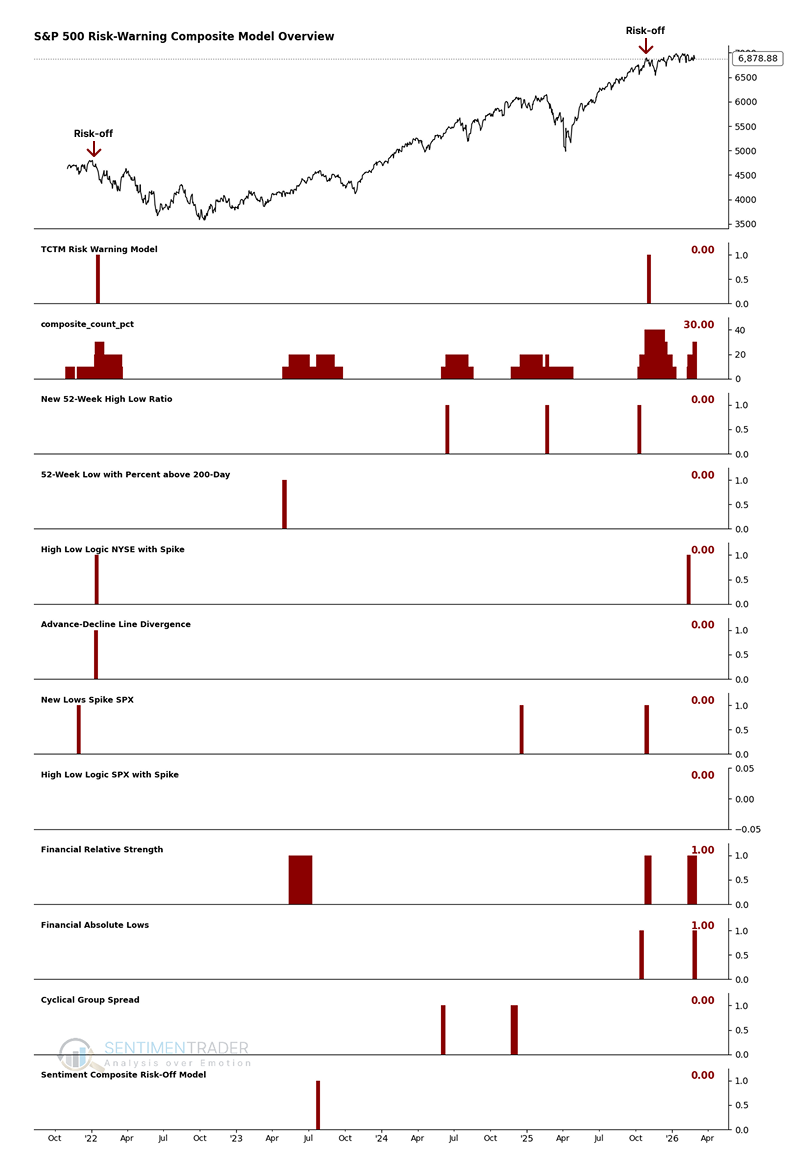
A secondary risk-off composite
The Risk-Off Composite Model is not a primary component of the S-TCTM; it can be found at the bottom of the S-TCTM Live website page. We utilize it as a secondary risk management measure.
This model currently shows a signal count of 20%, indicating that breadth-based warnings have not yet reached the threshold necessary to trigger a formal alert.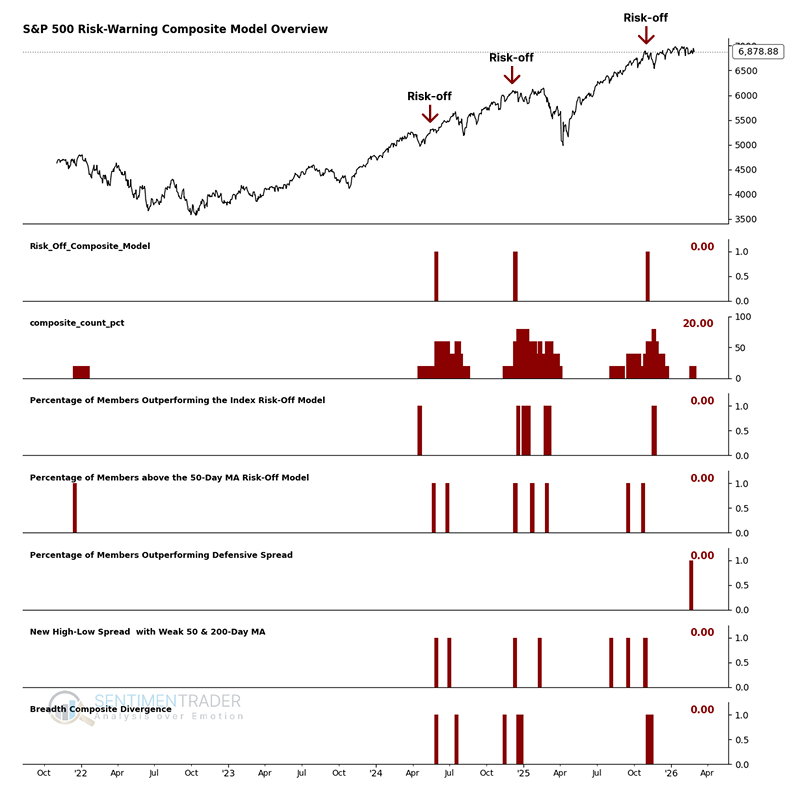
What the research tells us...
The Financial sector, a critical pillar of economic health, is generating an outsized proportion of new lows even as the S&P 500 hovers near its highs. Historically, this specific "Financial Absolute Lows" divergence is a bearish warning that often leads to a choppy, negative environment for the broader market over the next 1 to 3 months. However, because our broader, multi-component Risk-Off Composite Model has not confirmed this weakness, the current environment is better characterized as a period of intense sector rotation and near-term vulnerability, rather than the definitive start of a new bear market. Investors should monitor whether this localized weakness in Financials begins to infect other sectors.