Products
SentimenTrader Trading Tools
‍
Backtest Engine
My Trading Toolkit
Correlation Analysis
Seasonality
Market Prediction
Indicators & Data API
‍
Proprietary Indicators & Charts
Market Data API
Strategies & Scanner
‍
50+ Trading Strategies
Smart Stock Scanner
Smart Option Scanner
Research Reports
‍
Research Solutions
Reports Library
Free Resources
Simple Backtest Calculator
Simple Seasonality Calculator
The Kelly Criterion Calculator
Sentiment Geo Map
Public Research Reports
Education
Sentiment Indicators
Technical Indicators
Pricing
Company
About
In the News
Testimonials
Client Success Stories
Contact
Log inLoginSign up
< BACK TO ALL REPORTS

A reversal in utility stocks triggered a new buy signal for the S&P 500

Dean Christians
2022-02-15
On Monday, a trading model that measures the difference in medium-term uptrends for S&P 500 stocks relative to utility stocks triggered a new buy signal.

Key points:

  • Utility stocks recently showed significantly more issues in uptrends when compared to SPX members
  • The difference between S&P 500 and utility uptrends has now reversed, triggering a new buy signal
  • Similar signals preceded positive returns 83% of the time 2 months later

Utility stocks as a risk-on barometer
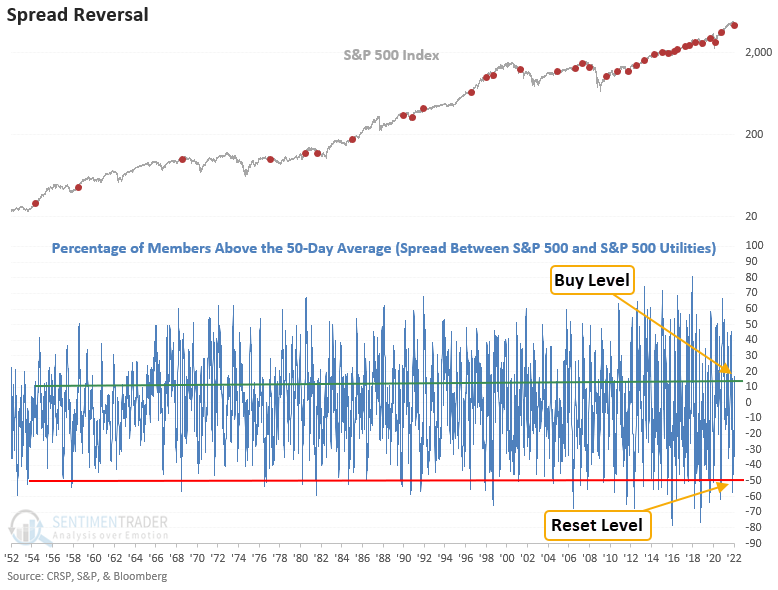
A trading model that measures the difference between medium-term uptrends for S&P 500 and S&P 500 utility sector members registered an alert on Monday at the close of trading.

The model identifies when the spread between members above the 50-day average reverses from -50% to greater than 11%. The reversal in medium-term uptrends suggests that the broad market is potentially transitioning from a more defensive environment to a more risk-seeking one. It might also indicate that interest-rate-sensitive stocks have succumbed to the pressure of higher rates.

The most recent reset in the spread occurred on 12/20/21. On that day, the S&P 500 showed only 38% of its members above the 50-day average, whereas utilities had more than 96%. So, the spread fell below the -50% reset threshold.

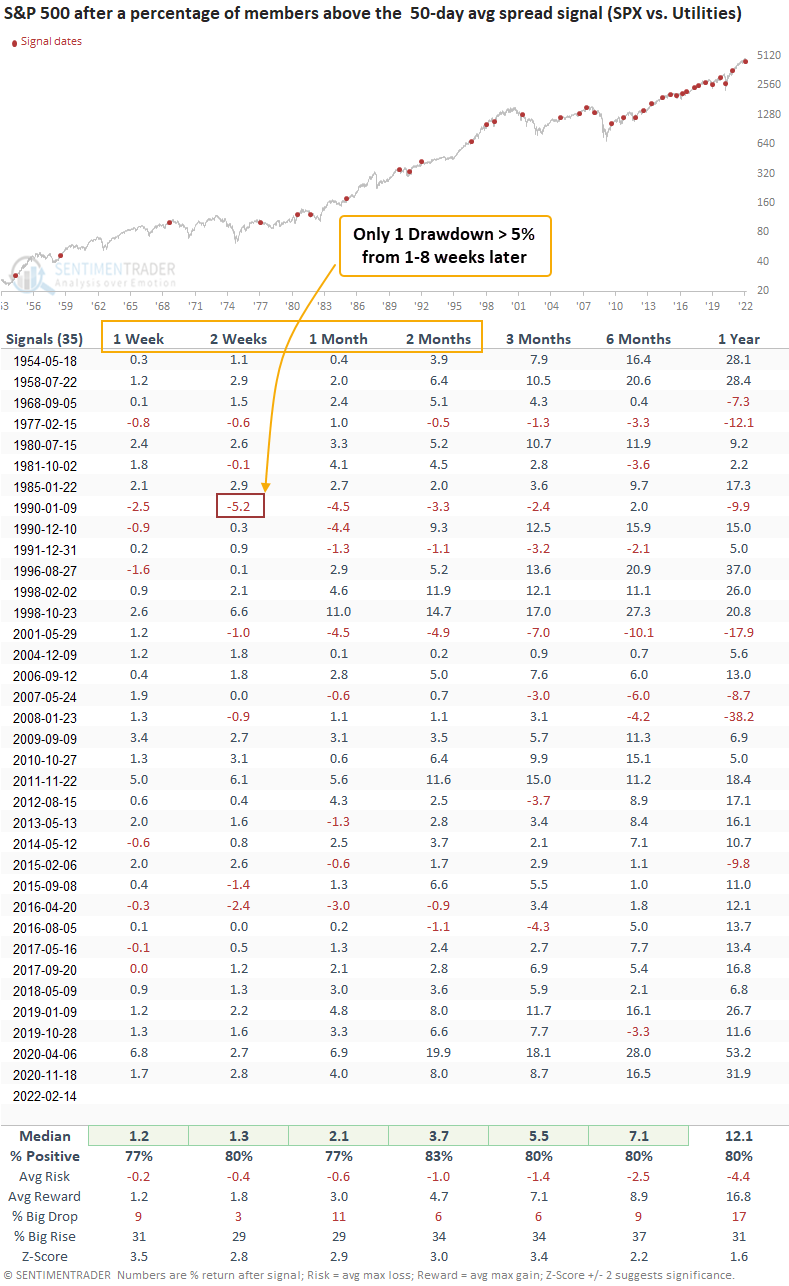
Similar signals have preceded gains 83% of the time

This signal triggered 35 other times over the past 68 years. After the others, S&P 500 future returns, win rates, and risk/reward profiles were excellent across all time frames, especially the 2-month window. Drawdowns were minimal in the first 2 months, with only 1 instance greater than 5%. However, I would be mindful that many signals occurred post the GFC low in 2009. Today's inflation and interest rate environment looks vastly different than most of that period.

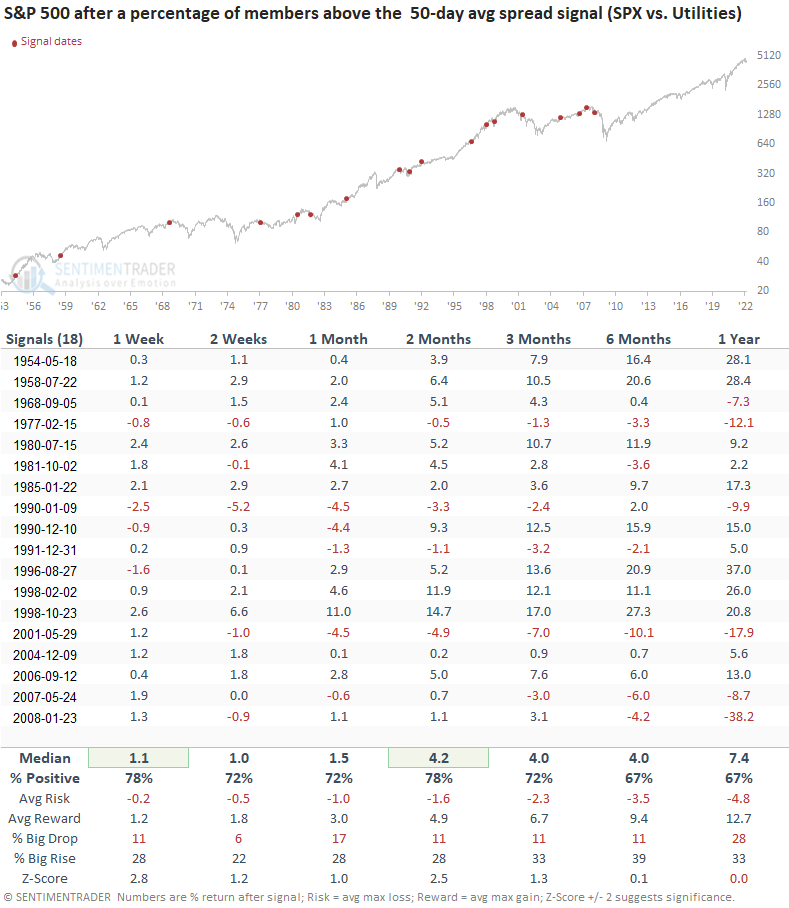
Signals before the GFC low in 2009 

If we review signals that occurred before the GFC low in 2009, the returns, win rates, and risk/reward profiles still look solid.

What the research tells us...

The reversal in medium-term uptrends suggests that the broad market is potentially transitioning from a more defensive environment to a more risk-seeking one. Similar setups to what we're seeing now have preceded excellent returns, win rates, and risk/reward profiles, especially on a 2-month basis.

Even though we've seen an improvement in the market environment, several headwinds continue to linger. With the market stuck in a trading range, I'm employing a buy the dip, sell the rip mindset until we get a more explicit message from the market. Historically, breadth thrusts are among the best indicators to monitor for a signal that would suggest a change in character. So far, panic buying that triggers a thrust signal has been absent.

PRODUCTS
SentimenTrader
Trading Tools
Indicators & Data API
‍
Strategies & Scanner
‍
Research Reports
FREE
RESOUrCES
Simple Backtest
Calculator
Simple Seasonality
Calculator
The Kelly Criterion
Calculator
Sentiment Geo Map
‍
Public Research Reports
‍
Education
Sentiment Indicators
‍
Technical Indicators
‍
Pricing
Bundle pricing
‍
FAQ
‍
Announcements
‍
COMPANY
‍
About
‍
In the News
‍
Testimonials
‍
Client Success Stories
CONTACT
‍
General Inquiries
‍
Media Inquiries
‍
Financial Professionals Inquiries
‍
© 2026 Sundial Capital Research Inc. All rights reserved.
Setsail Marketing
TermsPrivacyAffiliate Program
Risk Disclosure: The information and tools provided are for research and analytical purposes only and are not intended as investment advice. Market analysis involves uncertainty, and outcomes may differ from expectations. Users should conduct their own due diligence and consider their individual circumstances before making any financial decisions. Past performance is not necessarily indicative of future results.

Hypothetical Performance Disclosure: Hypothetical performance results have many inherent limitations, some of which are described below. No representation is being made that any account will or is likely to achieve profits or losses similar to those shown; in fact, there are frequently sharp differences between hypothetical performance results and the actual results subsequently achieved by any particular trading program. One of the limitations of hypothetical performance results is that they are generally prepared with the benefit of hindsight. In addition, hypothetical trading does not involve financial risk, and no hypothetical trading record can completely account for the impact of financial risk of actual trading. for example, the ability to withstand losses or to adhere to a particular trading program in spite of trading losses are material points which can also adversely affect actual trading results. There are numerous other factors related to the markets in general or to the implementation of any specific trading program which cannot be fully accounted for in the preparation of hypothetical performance results and all which can adversely affect trading results.

Testimonial Disclosure: Testimonials appearing on this website may not be representative of other clients or customers and is not a guarantee of future performance or success.