Data &
Technology
Research
Reports
Report Solutions
Reports Library
Actionable
Strategies
Free
Resources
Simple Backtest Calculator
Simple Seasonality Calculator
The Kelly Criterion Calculator
Sentiment Geo Map
Public Research Reports
Free Webinar
Pricing
Company
About
Meet Our Team
In the News
Testimonials
Client Success Stories
Contact
Log inLoginSign up
< BACK TO ALL REPORTS

A reversal in optimism suggests the metals and mining industry group continues higher

Dean Christians
2022-03-22
The optimism index reversed from a pessimistic level relative to its recent range, triggering a buy signal for the metals and mining industry with a 75% win rate.

Key points:

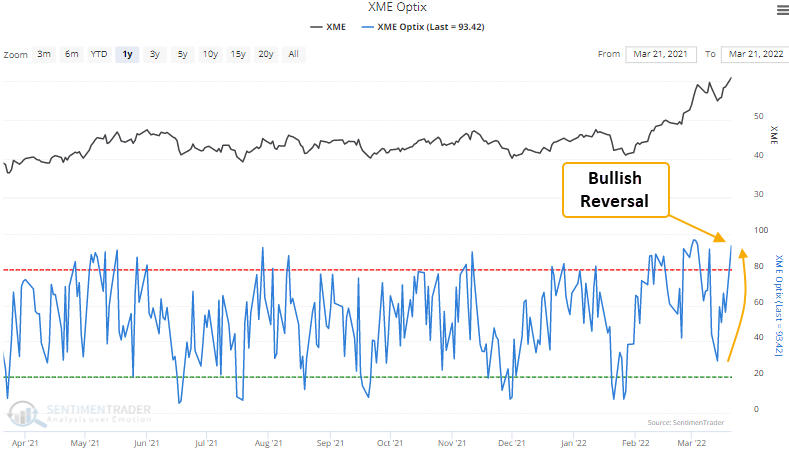
  • The optimism index for the metals and mining industry reversed higher relative to its recent range
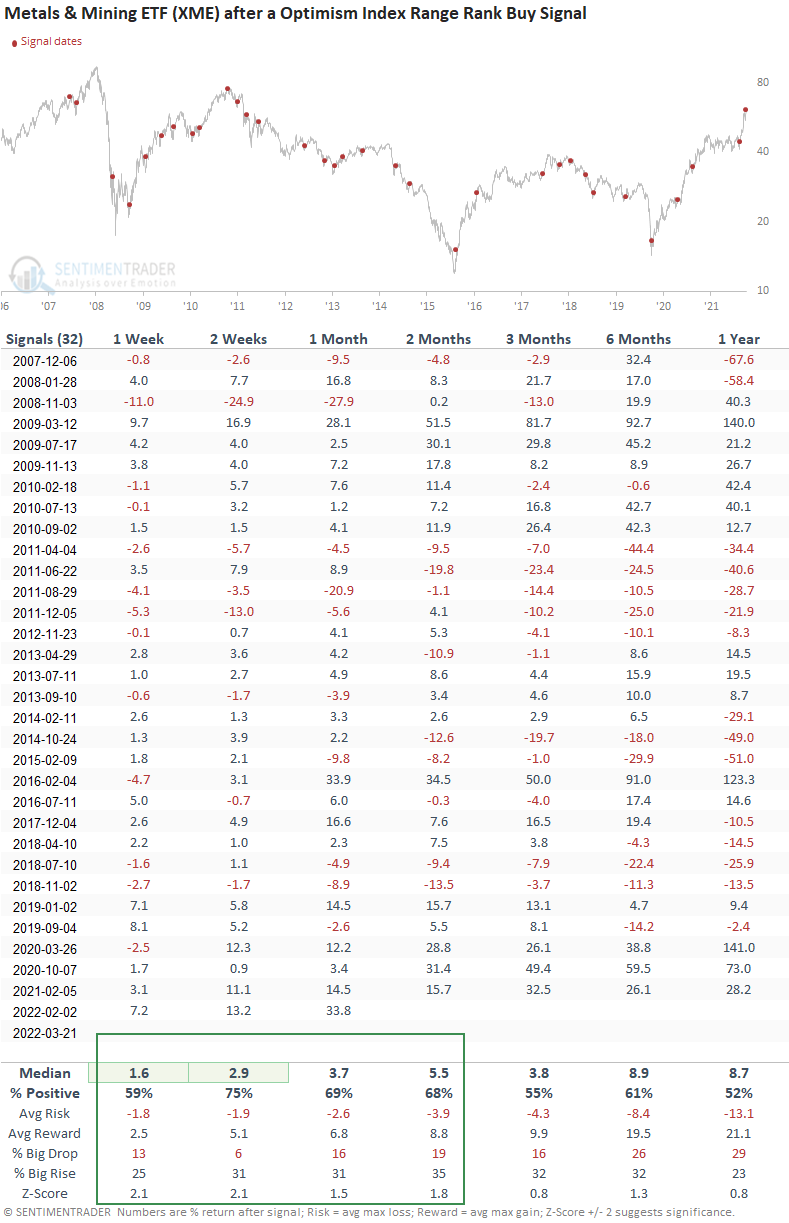
  • The Metals & Mining ETF (XME) has rallied 75% of the time over the next 2 weeks after other signals

Using the optimism index as a way to identify bullish sentiment reversals

A trading model that uses the Optix Index to identify when sentiment reverses from a period of pessimism issued a buy signal for the metals and mining industry on 3/21/22. 

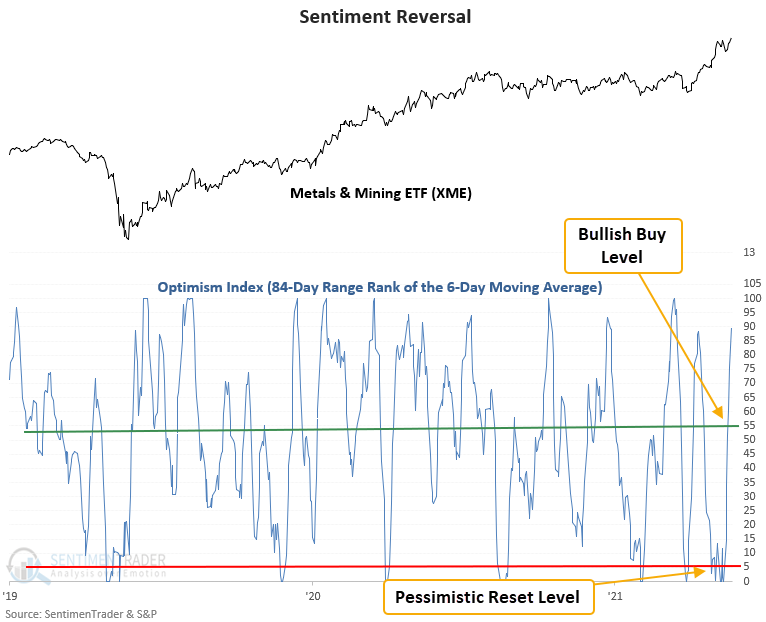
A trading model that identifies a reversal in the optimism index

The model applies an 84-day range rank to the 6-day moving average of the Optimism Index for the XME ETF. The range rank indicator measures the current value relative to all other values over a lookback period. 100 is the highest, and 0 is the lowest. The pessimistic reset condition occurs when the range rank for the Optix Index crosses below the 5th percentile. A new buy signal triggers when the range rank exceeds the 53rd percentile, and ETF momentum turns positive within 5 days of the cross. The 5-day rate of change for the XME ETF must be >= 2.5%.

The metals and mining ETF rallied 75% of the time after other signals

This signal has triggered 32 other times over the past 15 years. After the others, the XME ETF future returns, win rates, and risk/reward profiles were solid across the 1-8 week time frames, especially the 2-week window. The near-term results are even more impressive considering the problematic long-term backdrop since the peak in 2008. Unfortunately, the ETF's history is limited. It would have been interesting to see how the signal performed across the 2002-08 natural resource/value-driven bull market.

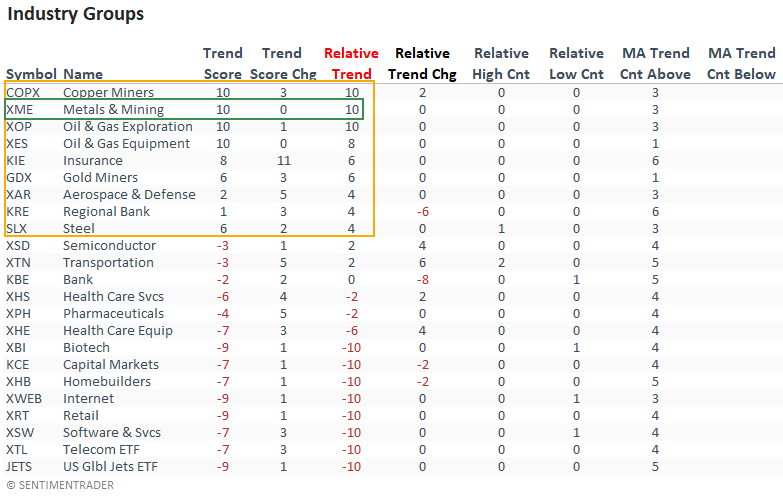
The absolute and relative trends for the metals and mining industry look solid

The metals and mining industry has been one of the top industry groups in my trend score tables for some time now. The rankings skew toward natural resource and value groups. I'm a momentum type of investor. So, I like to buy oversold reversals in the most robust groups. Rinse and repeat.

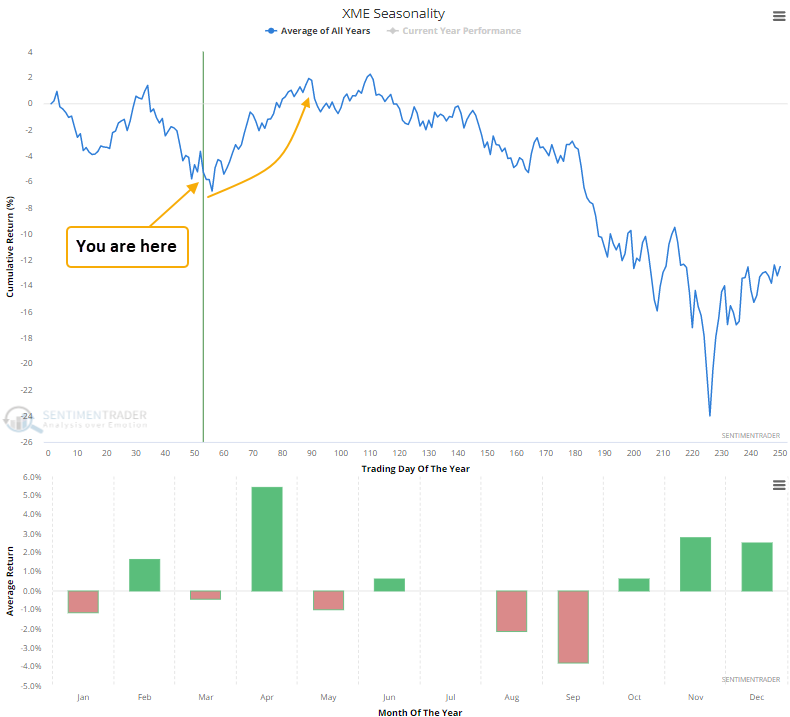
The seasonality chart looks compelling

Seasonality for the Metals and Mining ETF (XME) is about to turn favorable. The month of April is noteworthy.


What the research tells us...

When the optimism index for the metals and mining industry reverses from a pessimist level, it signals that traders have become more optimistic about the industry's future direction. Using the Optix index to measure that change in sentiment, similar setups to what we're seeing now have preceded rising metals and mining stock prices, especially in the 2-week window.

Sorry, you don't have access to this report

Upgrade your subscription plan to get access
Go to Dasboard
DATA &
TECHnologies
IndicatorEdge
‍
BackTestEdge
‍
Other Tools
‍
DataEdge API
RESEARCH
reports
Research Solution
‍
Reports Library
‍
actionable
Strategies
Trading Strategies
‍
Smart Stock Scanner
‍
FREE
RESOUrCES
Simple Backtest
Calculator
Simple Seasonality
Calculator
The Kelly Criterion
Calculator
Sentiment Geo Map
‍
Public Research Reports
‍
Free Webinar
COMPANY
‍
About
‍
Meet our Team
‍
In the News
‍
Testimonials
‍
Client Success Stories
Pricing
Bundle pricing
‍
Announcements
‍
FAQ
© 2024 Sundial Capital Research Inc. All rights reserved.
Setsail Marketing
TermsPrivacyAffiliate Program
Risk Disclosure: Futures and forex trading contains substantial risk and is not for every investor. An investor could potentially lose all or more than the initial investment. Risk capital is money that can be lost without jeopardizing ones’ financial security or life style. Only risk capital should be used for trading and only those with sufficient risk capital should consider trading. Past performance is not necessarily indicative of future results.

Hypothetical Performance Disclosure: Hypothetical performance results have many inherent limitations, some of which are described below. No representation is being made that any account will or is likely to achieve profits or losses similar to those shown; in fact, there are frequently sharp differences between hypothetical performance results and the actual results subsequently achieved by any particular trading program. One of the limitations of hypothetical performance results is that they are generally prepared with the benefit of hindsight. In addition, hypothetical trading does not involve financial risk, and no hypothetical trading record can completely account for the impact of financial risk of actual trading. for example, the ability to withstand losses or to adhere to a particular trading program in spite of trading losses are material points which can also adversely affect actual trading results. There are numerous other factors related to the markets in general or to the implementation of any specific trading program which cannot be fully accounted for in the preparation of hypothetical performance results and all which can adversely affect trading results.

Testimonial Disclosure: Testimonials appearing on this website may not be representative of other clients or customers and is not a guarantee of future performance or success.