
A reversal in optimism for the lithium and battery technology industry suggests higher prices

Key points:
- The optimism index for the Lithium & Battery Technology ETF reversed higher relative to its recent range
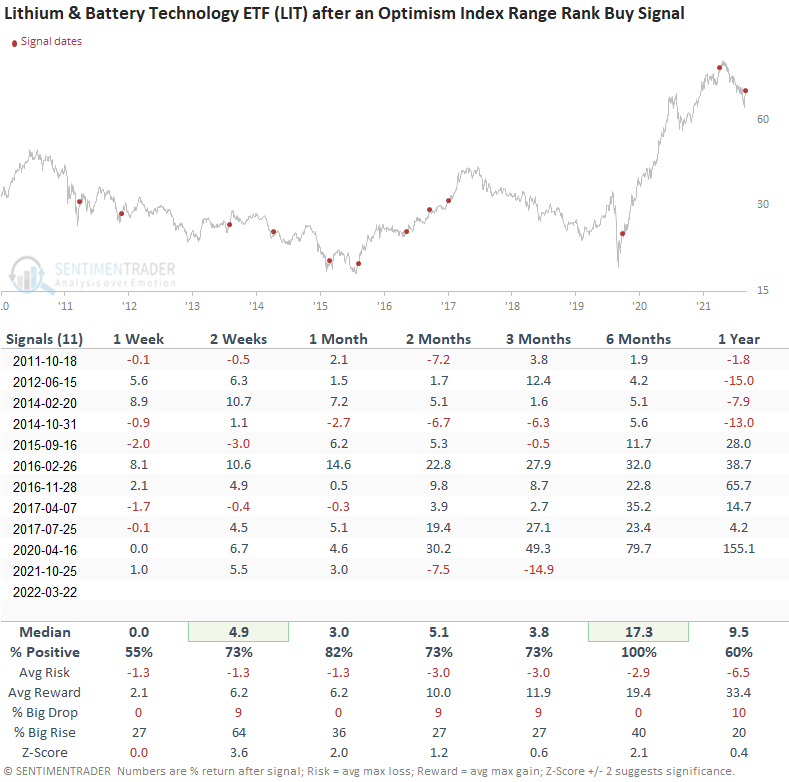
- The LIT ETF has rallied 82% of the time after other signals
Using the optimism index to identify bullish sentiment reversals
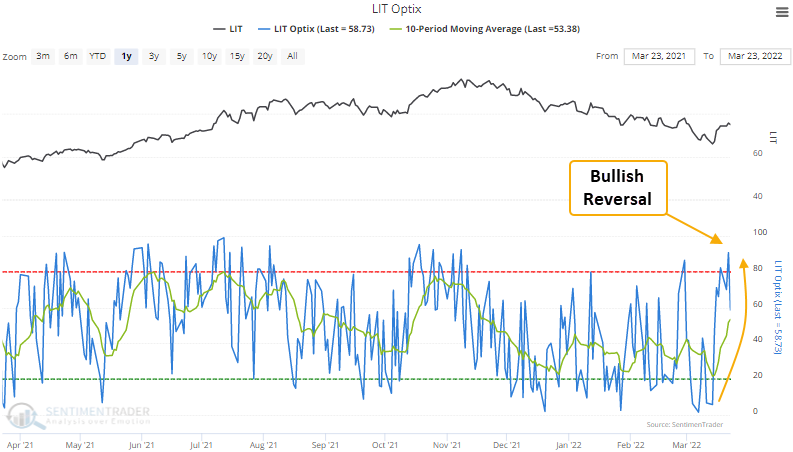
A trading model that uses the optimism index (Optix) to pinpoint when sentiment reverses from a period of pessimism issued a buy signal for the Lithium & Battery Technology ETF on 3/22/22.
A trading model that identifies a reversal in the optimism index
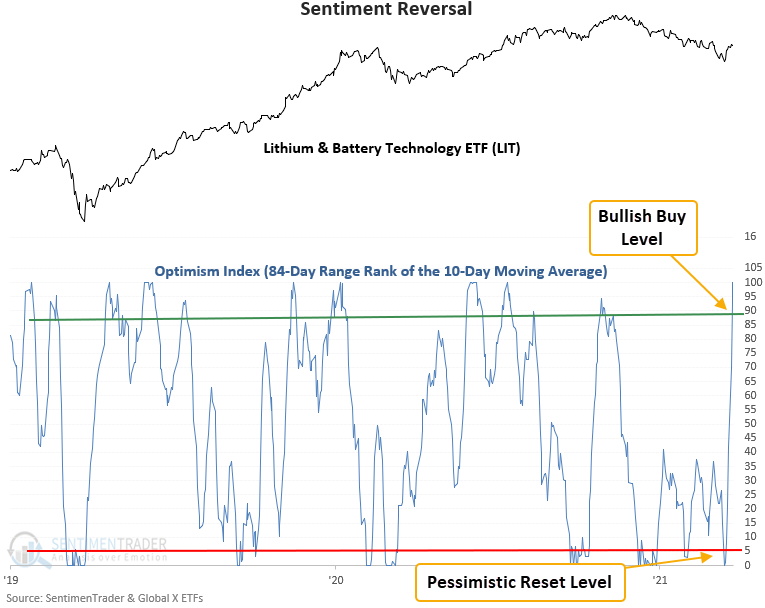
The model applies an 84-day range rank to the 10-day moving average of the Optimism Index for the LIT ETF. The range rank indicator measures the current value relative to all other values over a lookback period. 100 is the highest, and 0 is the lowest. The pessimistic reset condition occurs when the range rank for the Optix Index crosses below the 5th percentile. A new buy signal triggers when the range rank exceeds the 89th percentile, and ETF momentum turns positive within 5 days of the cross.
The Lithium & Battery Technology ETF rallied 82% of the time after other signals
This signal triggered 11 other times over the past decade. After the others, the LIT ETF future returns, win rates, and risk/reward profiles were solid across almost all time frames. The signal showed a positive return in all 11 instances at some point in the first 2 months, which is impressive considering the amount of time the ETF has spent in a downtrend. The LIT ETF is a relatively new instrument. Therefore, the sample size is small.
What the research tells us...
When the optimism index for the lithium & Battery Technology ETF reverses from a pessimist level, it signals that traders have become more optimistic about the industry's future direction. Using the Optix index to measure that change in sentiment, similar setups to what we're seeing now have preceded rising Lithium & Battery Technology stock prices, especially in the 1-month time frame.