
A reversal in momentum for S&P 500 members suggests the bounce continues

Key points:
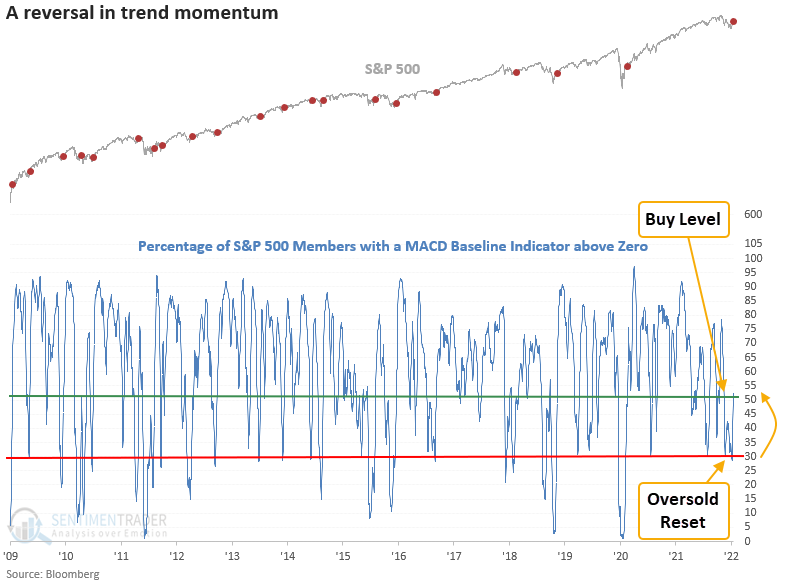
- The number of S&P 500 members with a MACD indicator above zero reversed higher
- The reversal comes after a period where most stocks exhibited weak trend momentum
- The S&P 500 rallied 80% of the time after other signals
A model that uses the MACD indicator to identify broad-based trend momentum reversals
The MACD indicator model identifies when the number of members with a MACD indicator above zero reverses from < 30% to > 50% in 15 sessions or fewer.
With slightly different parameters, the same model triggered a buy signal for the energy sector on 1/6/22.
If you're interested in learning more about the MACD indicator, click here.
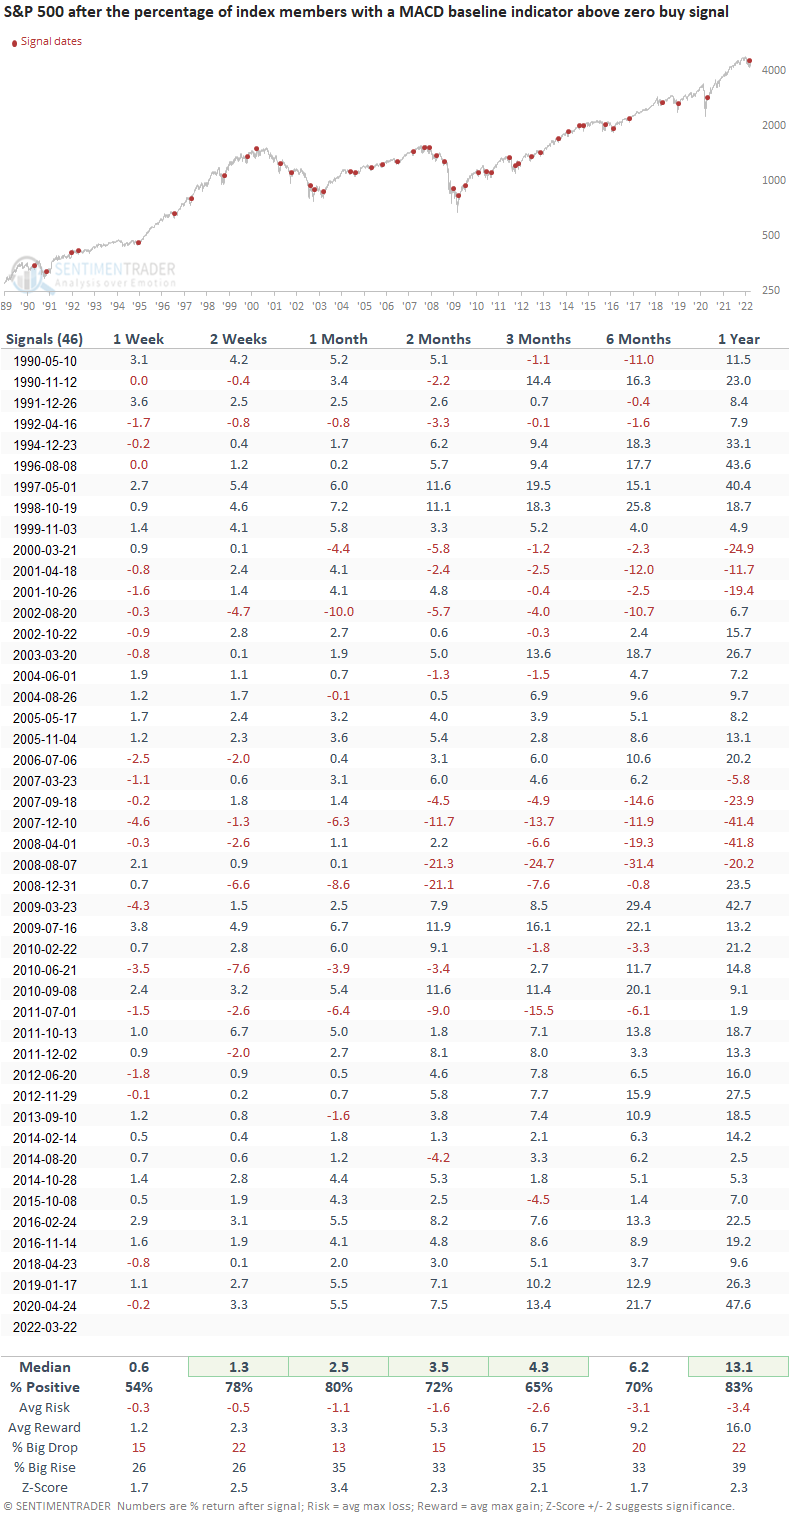
Similar reversals in trend momentum preceded gains 80% of the time
This signal triggered 46 other times over the past 32 years. After the others, S&P 500 future returns, win rates, and risk/reward profiles were solid across all time frames. Suppose you're looking for some perspective on whether we should continue to play the relief rally. In that case, the 4 and 6-week time frames offer the best outlook. The 1-month window provides the best risk-reward in our outlook table. However, when I run an optimization, it shows a 30-day holding period works best. Remember, the Fed doesn't meet again until early May. So, we have a 6-week window whereby the market could grind higher, notwithstanding some backing and filling after the recent surge.
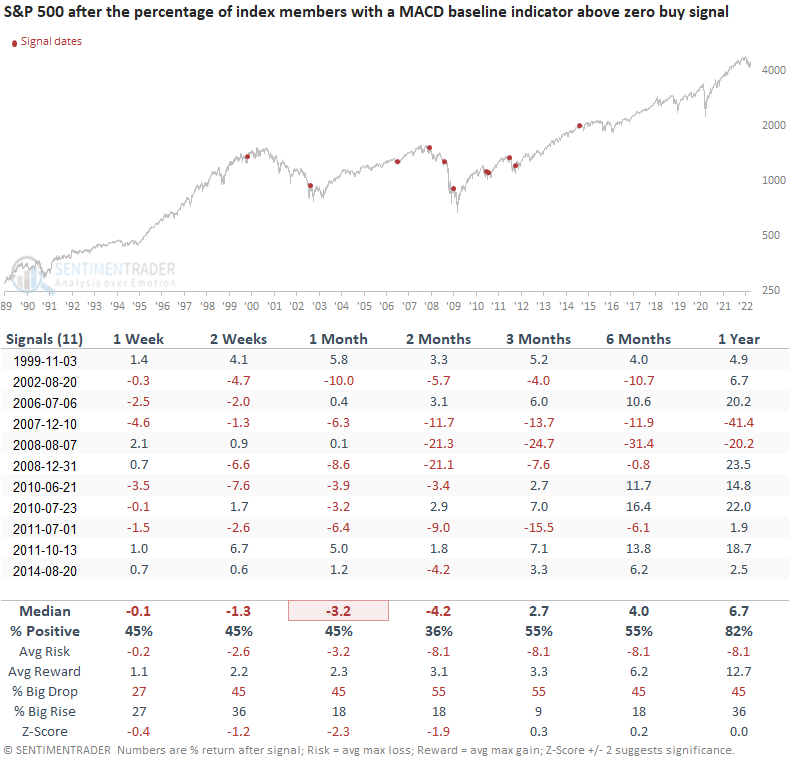
What could we use as a risk control mechanism given the current market environment
Let's conduct a study to identify a potential stop for the trading signal. I will keep the optimal days-in-trade holding period of 30 days and run an additional optimization to determine the best level for a stop based on the MACD percentage. The test returned 43% as the optimal parameter for a risk control exit. The outlook table shows 11 instances that hit the risk control parameter before the 30 day holding period ended. So, 76% of the signals achieved the optimal days-in-trade holding period. If we look at the 2-month time frame, which is the first window past the optimal holding period, it shows a median drawdown of 4.2%. However, some of the bear market instances show significantly worse drawdowns.
What the research tells us...
When the percentage of S&P 500 members with a MACD indicator above zero reverses from < 30% to > 50% in 15 sessions or fewer, the positive momentum will likely generate more positive momentum. Similar setups to what we're seeing now have preceded solid returns, win rates, and risk/reward profiles across all time frames, especially in the 1-month window. Suppose the MACD percentage crosses below 43 before the expiration of the optimal holding period. In that case, we should be mindful of a failed signal.