
A Reversal From a New High and a Surging VIX Suggests Market Headwinds

Key points:
- A sharp reversal from an all-time high, combined with a significant volatility spike, has triggered a rare technical signal for the S&P 500.
- Historically, this setup has often been followed by a deceptive one-month bounce that gives way to a period of market weakness and inconsistency.
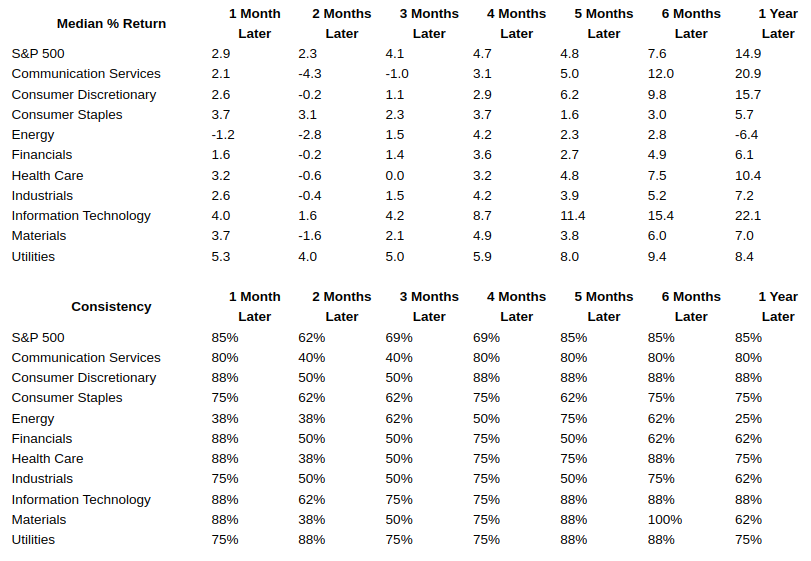
- Sector-level performance following the signal shows a clear historical pattern of rotation into defensive sectors like Utilities and out of growth-oriented sectors like Technology.
A Sharp Reversal From a New High Flashes a Warning Sign for Stocks
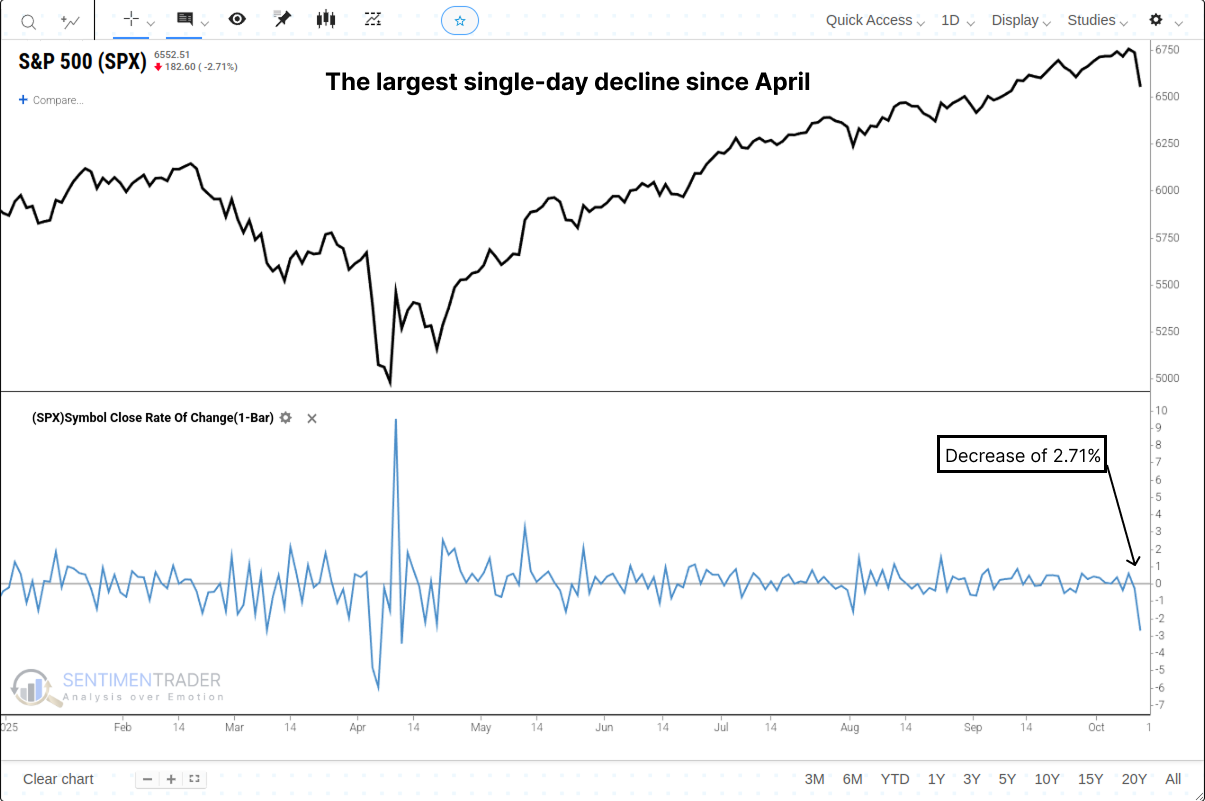
What began as a day of record-breaking optimism on Friday, October 10th, ended in a wave of intense selling, shattering the market's recent sense of calm. The core catalyst was an abrupt escalation in the U.S.-China trade conflict, triggered by a threat from U.S. President Trump to impose "massive" new tariffs. The sell-off in equities was swift and severe.
The S&P 500 plunged to close with a loss of 2.71%-its largest single-day decline since April. The technology sector was the epicenter of the decline, with the Nasdaq Composite plummeting 3.6%. This type of sharp reversal raises a critical question: Was this merely a one-off, news-driven event, or does it represent the start of a more significant downturn?
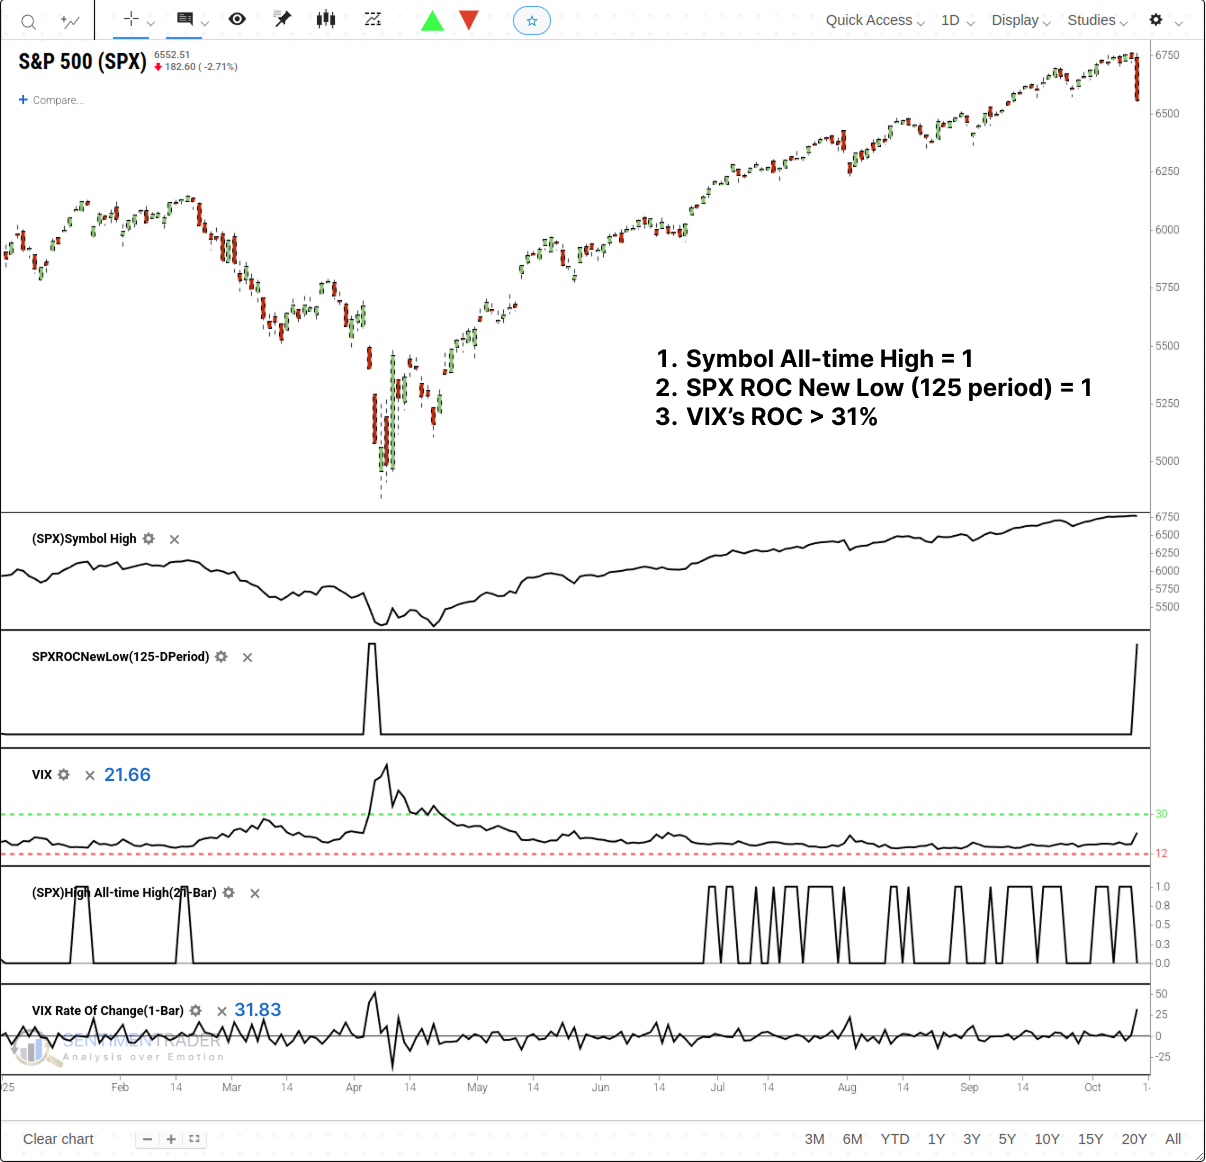
To assess the potential implications, we can quantify this series of events into a specific, testable signal. Let's conduct a study based on the following conditions, all of which must occur within a 21-session window:
- The S&P 500 Index sets a new all-time high.
- The S&P 500 then registers its largest single-day percentage decline over a 125-session period.
- The Volatility Index (VIX) experiences a single-day rate of change greater than 31%.
This precise combination of a market high, a volatility spike, and a momentum breakdown is a rare occurrence, and it has now triggered. For related backtest, clike here.
A Historical Pattern of a Deceptive Bounce, Then Weakness
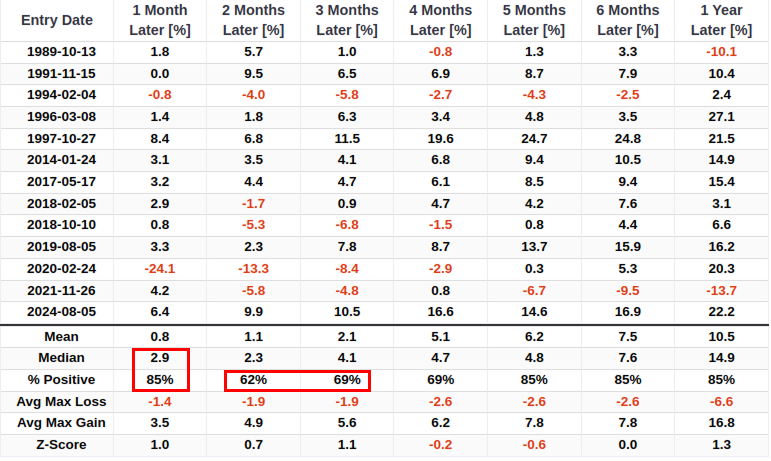
When this rare combination of events has occurred in the past, the S&P 500's performance has followed a distinct and potentially deceptive pattern. The data shows a tendency for a strong initial bounce, which then gives way to a period of significant weakness. One month after a signal, the market was higher 85% of the time with a median return of +2.9%. This suggests an initial "buy the dip" reaction has been common.
However, that strength has historically proven to be a bull trap. By the two-month mark, the win rate plummeted to 62%, barely better than a coin flip, and the three-month win rate was only 69%. This two-to-three-month window appears to be the point of maximum vulnerability for the market after this signal. The most dramatic recent example was the signal on February 24, 2020, right at the onset of the COVID-19 crash, where the S&P 500 plunged -24.1% in the following month.
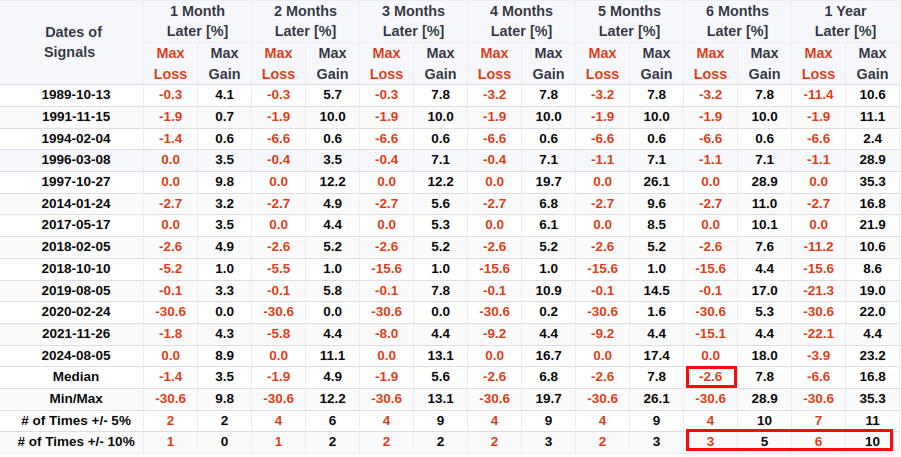
The data on maximum drawdowns further underscores the seriousness of the risk. While the median maximum loss over the subsequent six months was a seemingly manageable -2.6%, this figure masks the true danger. A deeper look reveals that 3 of the 13 historical precedents saw a maximum loss exceeding -10% within the subsequent six months. Even more concerning, over a one-year horizon, 6 of the 13 signals (46% of cases) experienced a -10% or greater drawdown. This is a historically unfavorable risk profile that is far more severe than a typical, healthy consolidation.
A Clear Defensive Rotation Has Historically Followed
The sector-level performance following these signals provides another powerful layer of corroborating evidence, painting a clear picture of a risk-off rotation. The historical data shows a clear pattern of capital fleeing from riskier, growth-oriented sectors and into safer, defensive areas of the market. This historical tendency is not just theoretical; it mirrors precisely what unfolded during Friday's session, where Consumer Staples was the sole sector to finish in the green.
The performance of growth sectors was particularly weak. Two months after a signal, Communication Services showed a median loss of -4.3%. In contrast, defensive sectors held up significantly better. Utilities, for instance, showed a median return of +5.3% one month later, serving as a clear relative safe haven during these periods of market stress.
What the research tells us...
The market's sharp reversal on October 10th, which occurred in the context of a specific news event, has created a technical setup that has occurred rarely in the past. It is important to recognize that the current market environment is fluid and reacting to a developing news cycle.
An objective review of similar historical setups reveals a distinct data pattern. The precedents show a tendency for an initial rebound in the first month, which was then followed by a period of market weakness and inconsistency. The historical data also shows that a significant portion of these signals were followed by drawdowns exceeding 10% and a rotation into defensive sectors. While every market event is unique, this historical data provides context for the type of market behavior and sector performance that has followed similar technical patterns in the past.