
A relative trend composite score for the Nasdaq 100 surged by a historic amount

Key points:
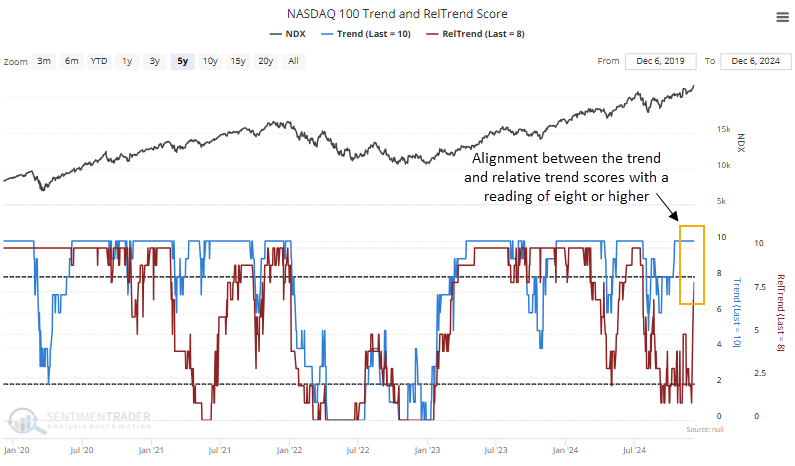
- The Nasdaq 100's relative trend score climbed to eight, aligning with a favorable trend score
- Similar trend score profiles saw the NDX 100 rally 78% of the time over the next two months
- The relative trend score reading of eight was the result of a substantial week-over-week change
- Comparable 5-day net change surges saw the NDX 100 rally 100% of the time over the next year
A bullish trend score profile for the Nasdaq 100
In my November research report, The QQQ Liquidity Premium Indicator Triggered a Risk-On Signal, I highlighted a bullish outlook for the Nasdaq 100, citing a reversal in the liquidity premium indicator. Since then, the Nasdaq 100 has risen 2.44%, outperforming the S&P 500's 1.48% gain.
At the time, I raised a concern, noting that the relative trend score for the Nasdaq 100 maintained a reading of five, indicating that only 50% of the relative trend indicators showed a favorable condition. While not poor, it was less than desirable.
After falling to a reading of one in the last week of November, the relative trend score for the Nasdaq 100 surged by seven points, the most significant week-over-week increase in history. The boost pushed the overall composite score to eight, aligning it with a favorable trend score of ten.
The previous alignment between the trend scores of eight or higher occurred in May 2024, producing a 5% gain in the NDX 100 over the subsequent month.
Similar trend score profiles preceded a bullish outlook for the Nasdaq 100
When both trend and relative trend indicators maintained scores of eight or higher, coupled with positive momentum and a short-term breakout, the tech-heavy index rallied 78% of the time over the next two months. Furthermore, this two-month interval has been particularly impressive of late, with 16 out of 17 winners since 2011 and a streak of 10 consecutive wins since 2016.
The only drawback, if it can even be considered one, is that none of the time frames showed statistical significance. However, this tendency isn't entirely unexpected, given that these signals tend to arise under highly favorable trend conditions.
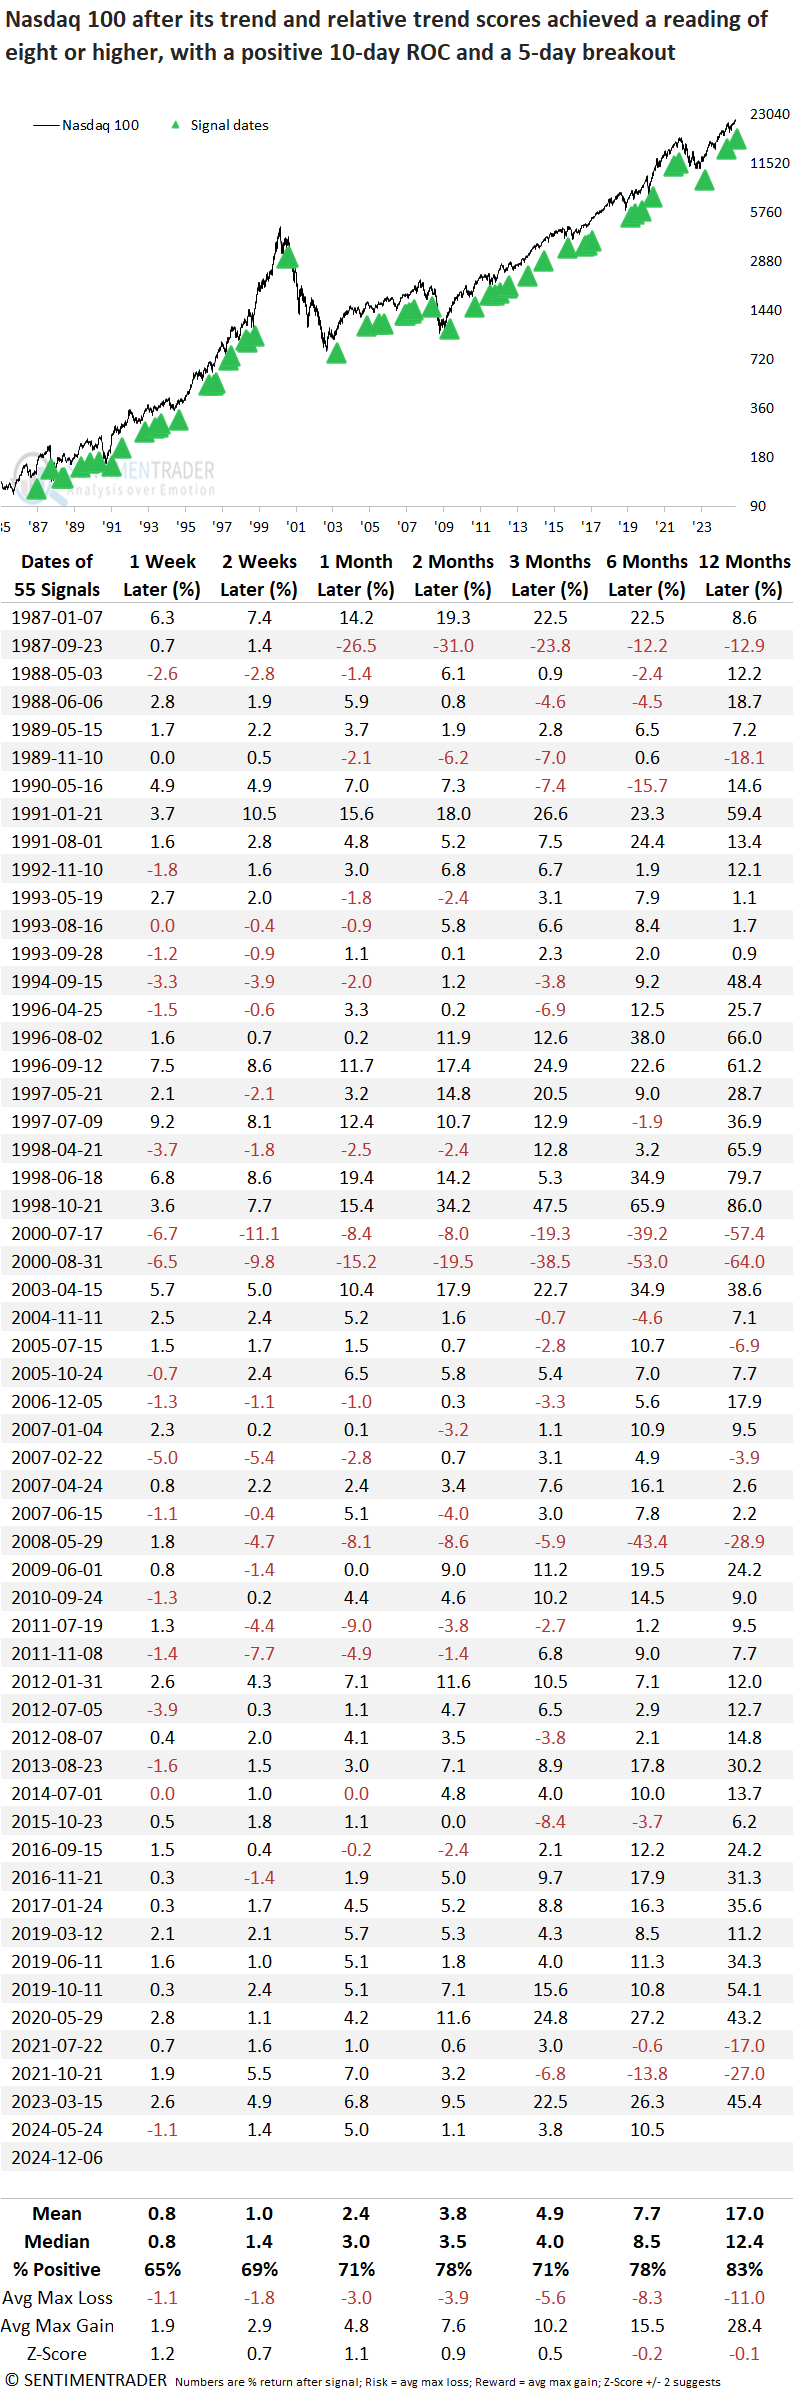
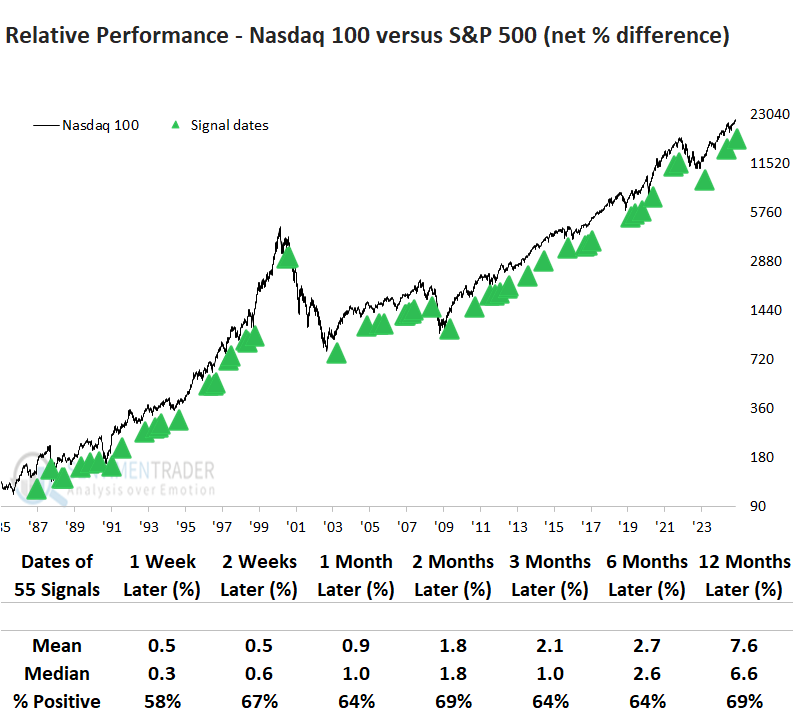
Comparing the Nasdaq 100 to the S&P 500 reveals that the tech-focused index has consistently outperformed the broader benchmark, achieving a 69% win rate over the subsequent two months.
A potent derivative of the trend score calculation
As detailed in last month's webinar, the website displays the 5-day net change for the trend and relative trend scores, providing a powerful indicator to capture trend thrust signals in advance of a favorable overall trend score. Users can adjust the net change calculation to other durations in the backtest engine. However, I've found that the 5-day change works best.
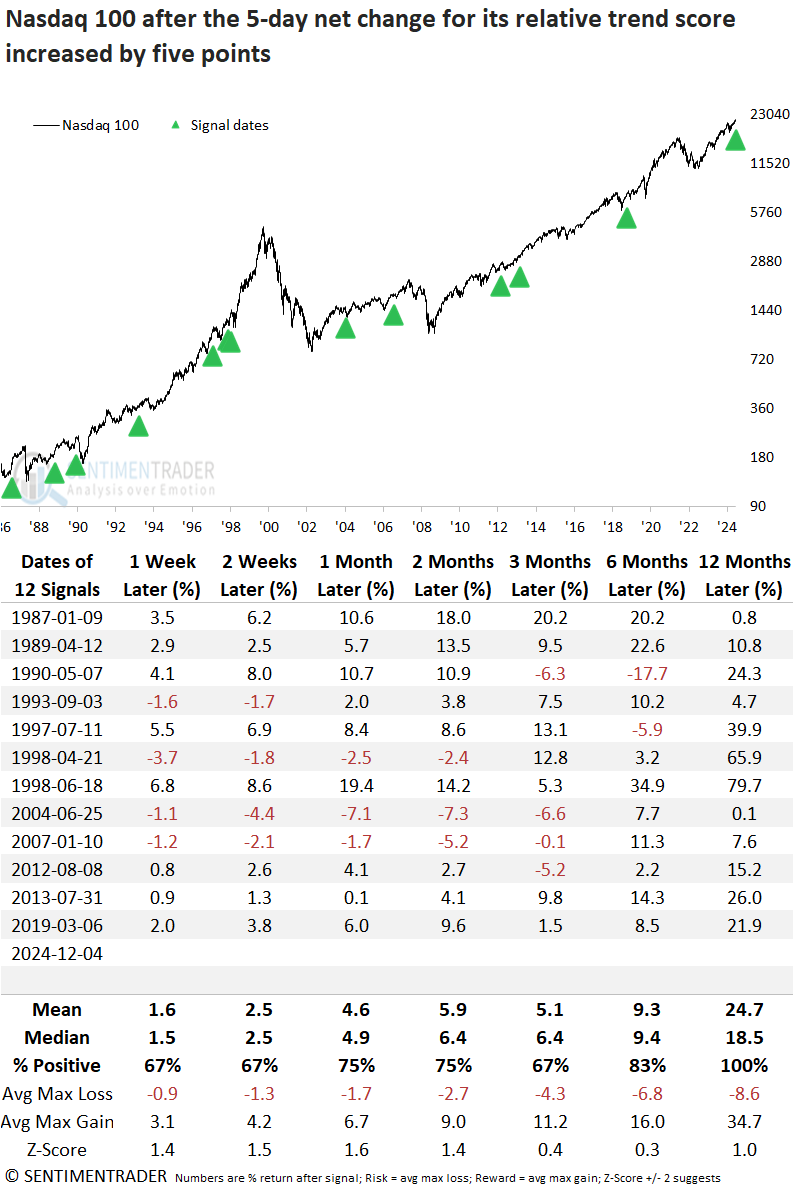
As mentioned earlier, the week-over-week or 5-day net change in the relative trend score composite for the Nasdaq 100 surged by seven points, a scenario that has never occurred since the index was created.
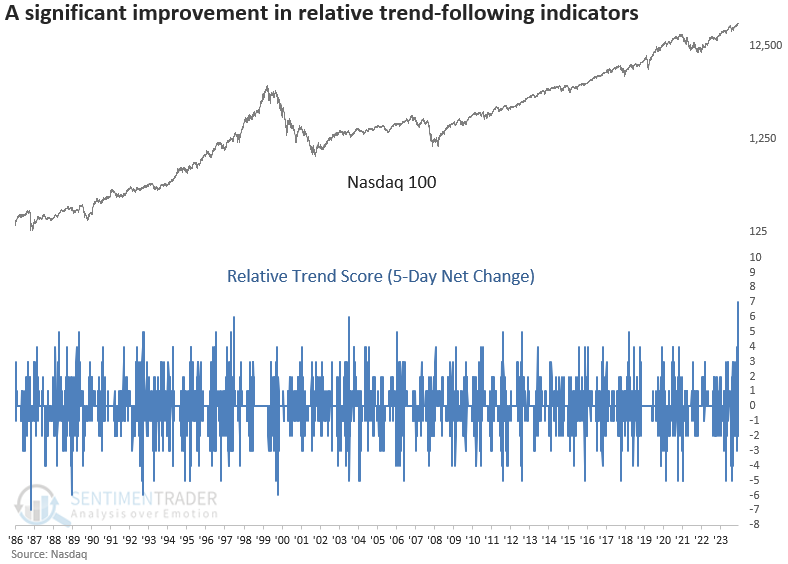
The following outlook table contains precedents when the 5-day net change for the Nasdaq 100's relative trend score surged by five points or more, a signal that can easily be created in the backtest engine for your favorite stocks or ETFs.
Similar relative trend score thrusts produced solid returns and consistency for the Nasdaq 100 over all time frames, especially a year later, with the index rising 100% of the time.
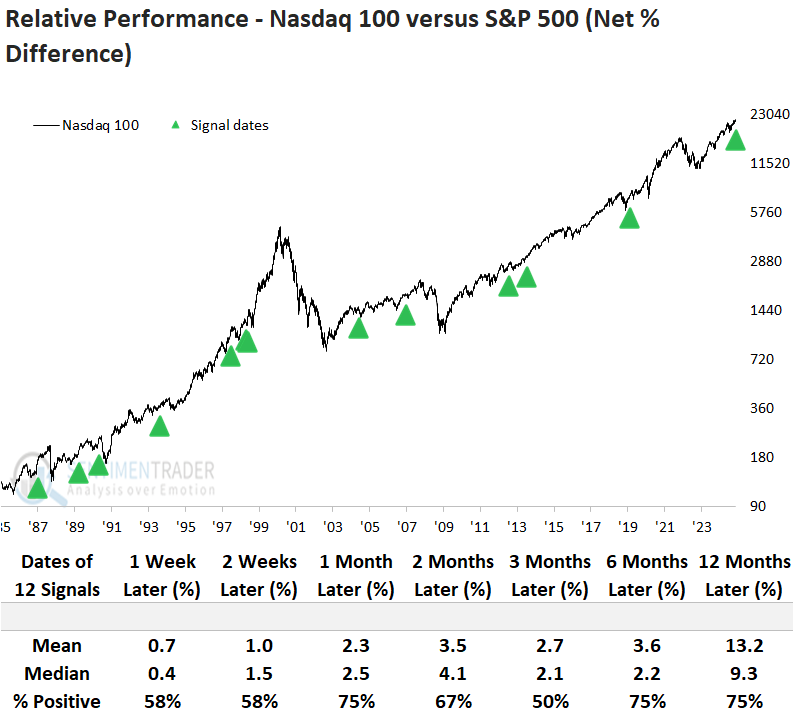
Similar to the outlook table for the trend score signals, the Nasdaq 100 displayed a solid tendency to outperform the S&P 500 following 5-day net change thrusts.
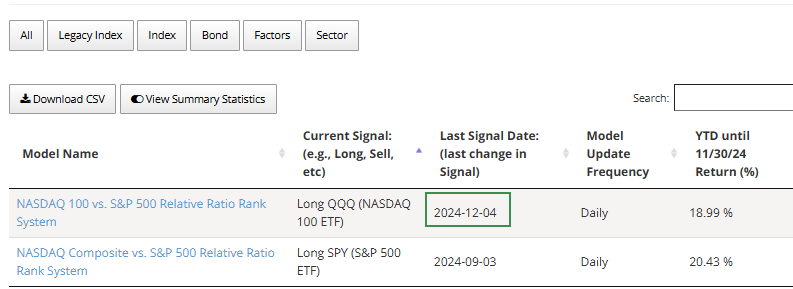
If you monitor our strategies on the website, you may have noticed that the relative strength timing system for the QQQ ETF initiated a long position on 2024-12-04, favoring the popular technology-oriented ETF over the S&P 500.
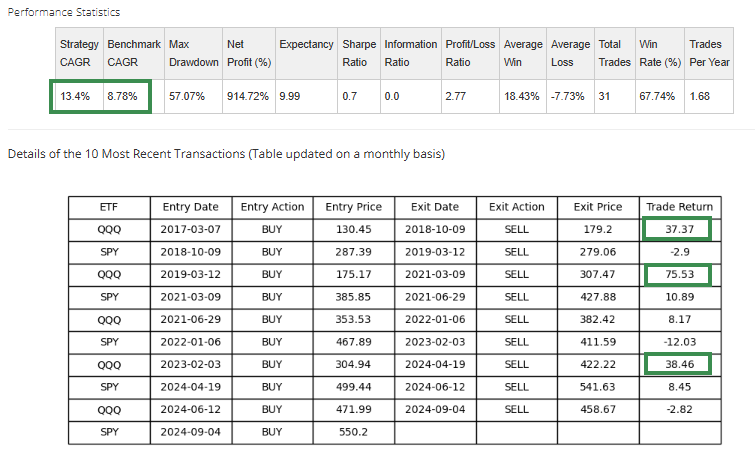
The strategy boasts an impressive annualized return of 13.4%, surpassing the S&P 500's 8.78%. Moreover, the largest gains are achieved when holding the QQQ, as highlighted in the table below.
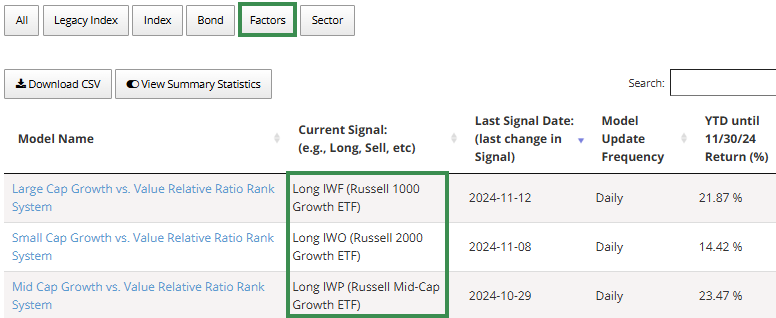
Factors favor growth
Bolstering the appeal of technology-oriented indexes such as the Nasdaq 100, relative strength timing models indicate a clear tilt toward growth ETFs over value ETFs across market caps.
What the research tells us...
After enduring a multi-month stretch of relative underperformance, the Nasdaq 100 is regaining momentum, signaling a potential shift in market leadership. The index closed at a new all-time high on Friday, and in doing so, its relative trend score surged by seven points, pushing the overall composite reading to eight, a level that aligns with its trend score, both now positioned in bullish territory. This favorable dynamic has resulted in solid returns and consistency for the tech-heavy index over the next few months, especially more recent precedents. Strengthening the case for a bullish view of the Nasdaq 100 was a relative trend score thrust, a signal that has produced a 100% win rate over the next 12 months.
While the outlook for the Nasdaq 100 looks promising, one must remember that this index is extremely top-heavy. The top 10 holdings account for 50% of the weighting. Consequently, fluctuations in the index could reflect a handful of names rather than a broad-based technology theme. Not all technology-oriented groups display favorable trends, as Jason discussed with semiconductors.