
A relative strength timing system shifts to value

Key points:
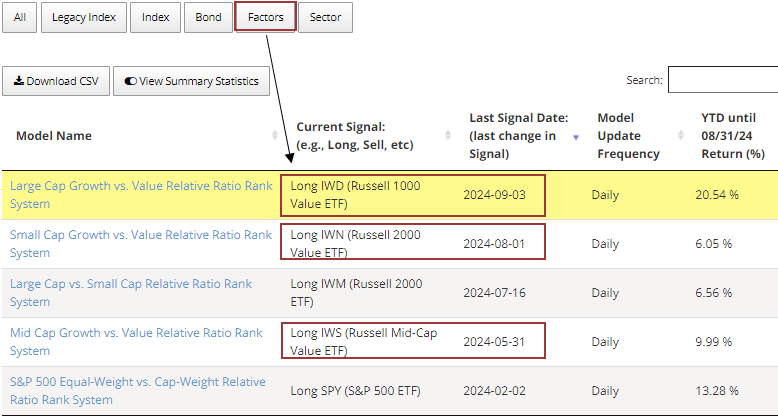
- A trading strategy that utilizes relative strength shifted from large-cap growth to large-cap value
- Other strategies maintained on our website have transitioned away from growth/technology-oriented ETFs
Several notable shifts in relative trends warrant attention
Subscribers are encouraged to regularly review our strategies page, regardless of their interest in automated trading systems. The models provide extensive information on various styles, factors, and sectors, offering a valuable market message.
At the close of trading on Tuesday, a strategy that uses relative strength to rotate between large-cap growth and value shifted in favor of value. At the same time, strategies for the Nasdaq 100 ETF (QQQ) and the Nasdaq Composite ETF (ONEQ) issued sell signals and now hold the S&P 500 ETF (SPY).
When you combine these new signals with a sell alert in Technology on 2024-07-30, the weight of the evidence suggests investors should maintain a cautious stance regarding technology/growth-oriented groups. Said another way: I would not be overweight relative to a benchmark.
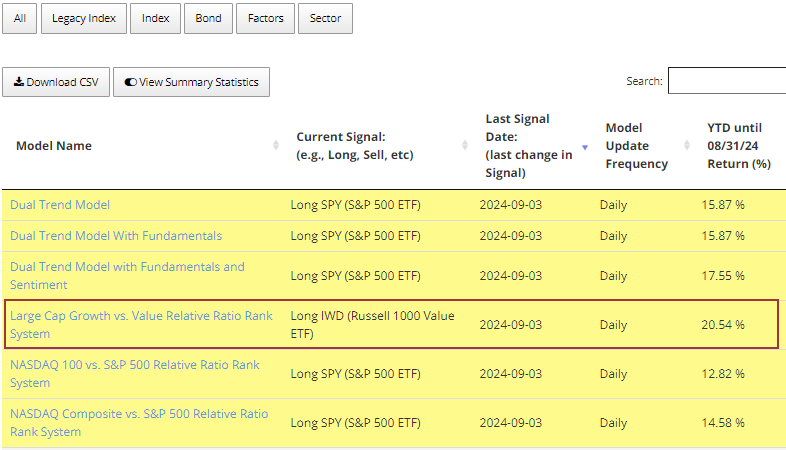
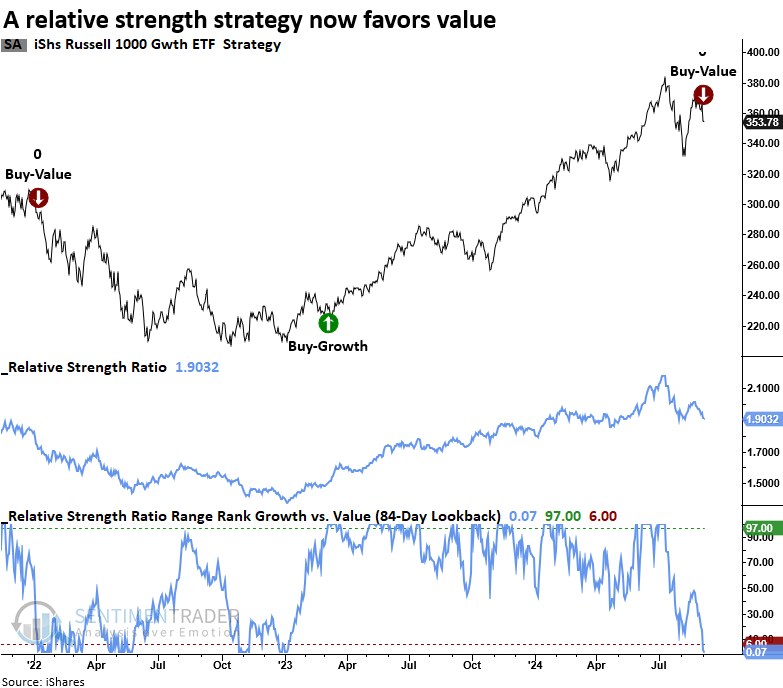
The system applies an 84-day range rank to the ratio between the iShares Russell 1000 Growth ETF (IWF) and the iShares Russell 1000 Value ETF (IWD). When the range rank rises above the 97th percentile, the system initiates a position in growth. Conversely, when the range rank falls below the 6th percentile, it rotates to value.
Since ETFs are a relatively new product with limited historical data, I used index data starting in the 1950s to test for the optimal range rank durations and signal thresholds for all relative ratio timing systems on the website.
While the strategy is based on a simple concept that uses a medium-duration lookback period, it has proven highly effective, delivering a compound annual growth rate (CAGR) of 11.45%, outperforming the S&P 500 ETF's benchmark return of 8.5%. Additionally, it requires minimal trading, averaging 1.54 transactions per year since 2006.
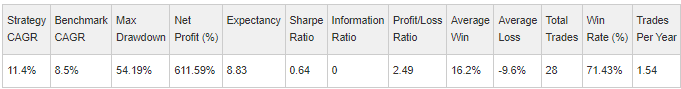
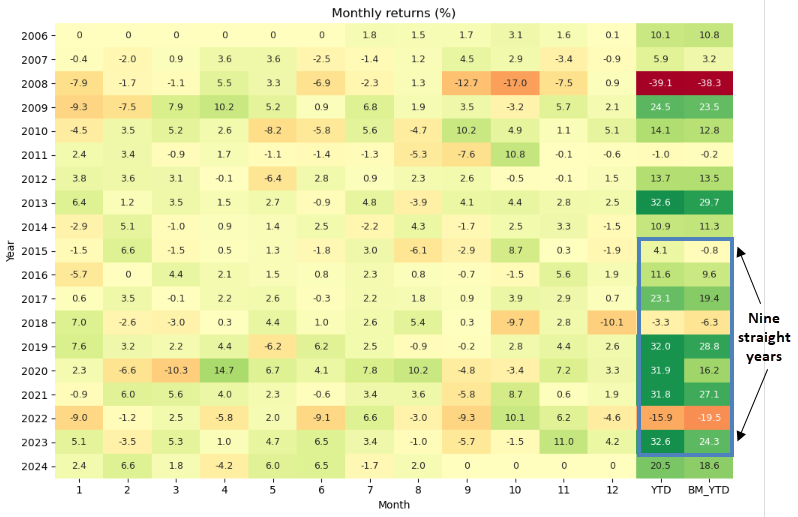
As of the end of August, the strategy was ahead of the S&P 500 by nearly 2%. If it maintains this lead through year-end, 2024 will represent its 10th consecutive year of outperforming the benchmark.
With the shift from large-cap growth to value, value-focused ETFs exhibit a favorable relative trend across small, mid, and large-cap stocks.
Defensive sectors exhibit positive relative trends
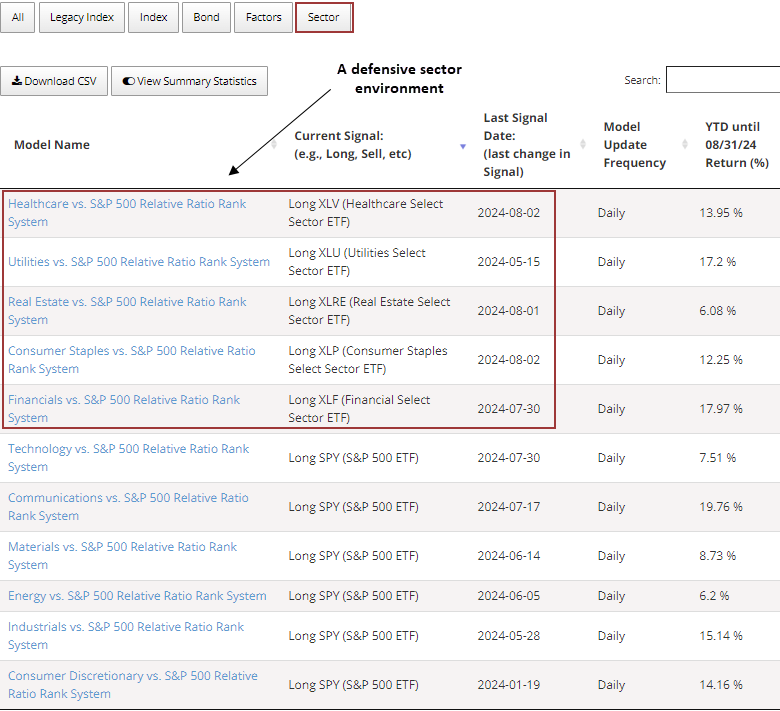
In my research report on Wednesday, I highlighted that my composite relative trend models maintained a positive score for all four traditionally defensive sectors: Consumer, Staples, Healthcare, Real Estate, and Utilities.
The relative strength timing systems available on the website, which are more timely than my composite models due to shorter duration inputs, are positioned in these defensive groups. I would monitor these systems closely. Should the defensive sectors reverse to sell signals, a concern hanging over the market likely has been alleviated.
What the research tells us...
A relative strength timing system that favored growth stocks since March 2023 has shifted its preference toward value stocks. Sell signals in technology-oriented ETFs most likely contributed to the change in factor leadership as technology stocks dominate growth indexes. In light of the unfavorable relative trends affecting growth and technology ETFs, investors should reconsider taking an overweight stance compared to a benchmark. Can gains still be found in select individual stocks within these groups? Yes, but it will be more difficult without a rising tide that lifts all boats.