
A relative strength timing model shifts to cash and energy

Key points:
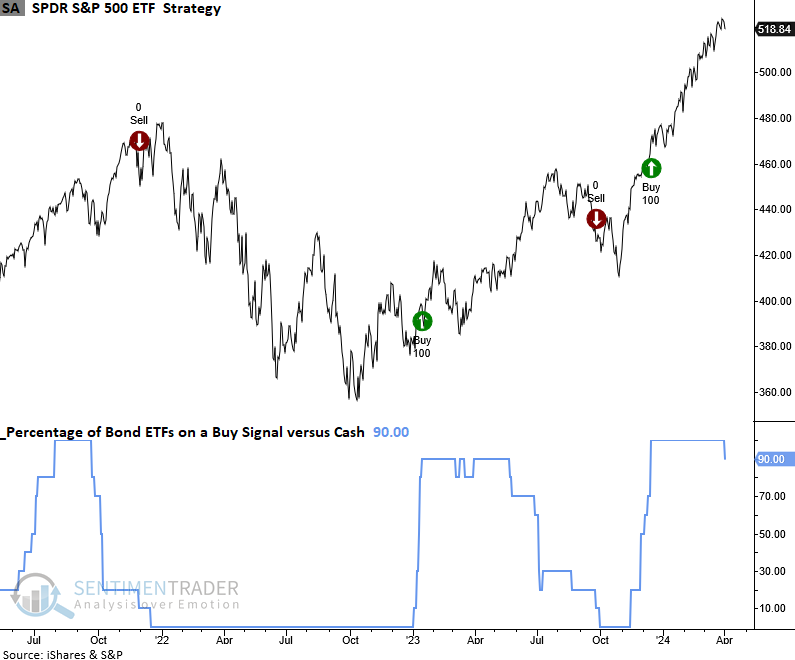
- A relative strength timing model comparing 3 to 7-year Treasury bonds to cash rotated in favor of cash
- Similar rotations preceded falling prices for a medium-term Treasury bond ETF over the subsequent three months
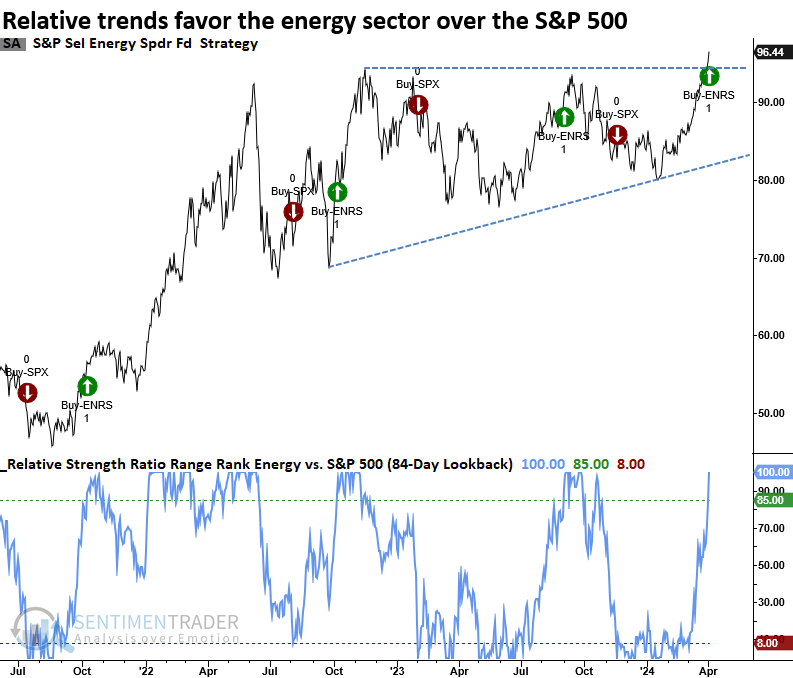
- A relative strength timing model comparing the energy sector to the S&P 500 rotated in favor of energy
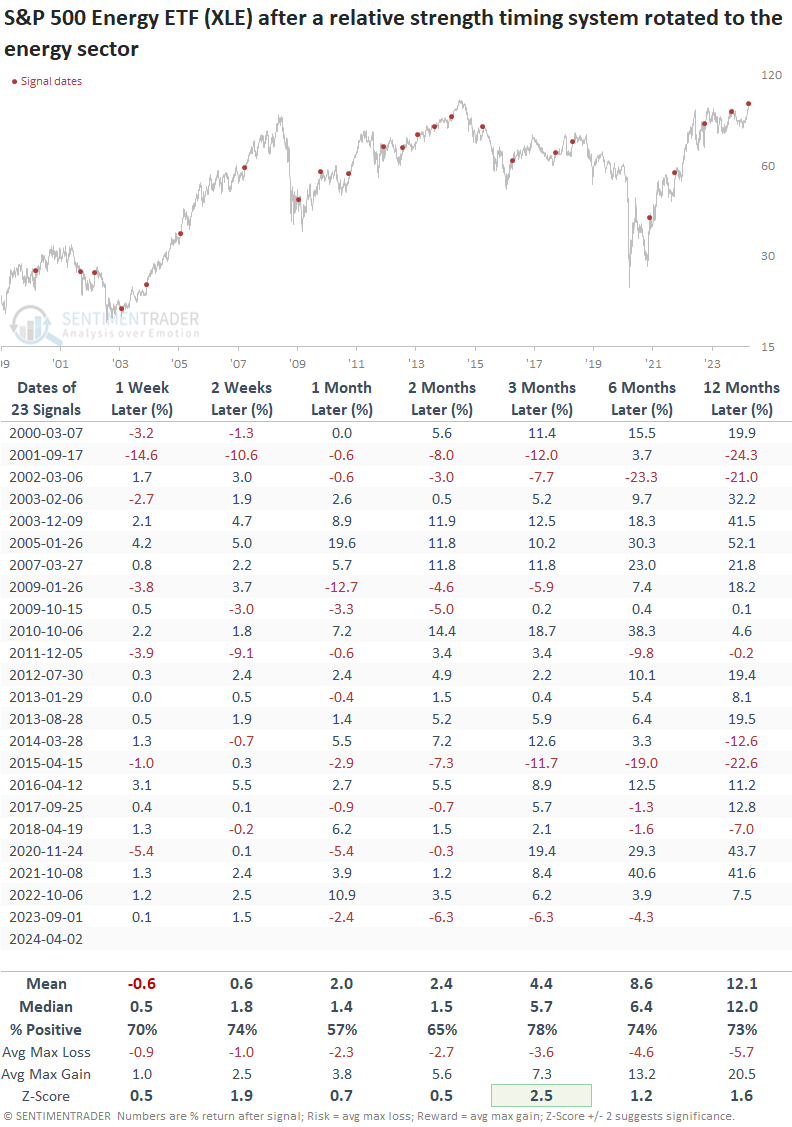
- After similar alerts, the group was higher 78% of the time over the following three months
Relative trends suggest cash over 3 to 7-year Treasuries and energy over the S&P 500
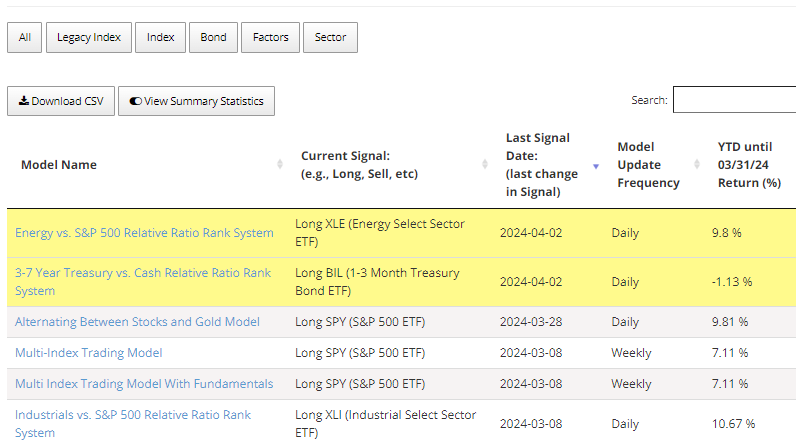
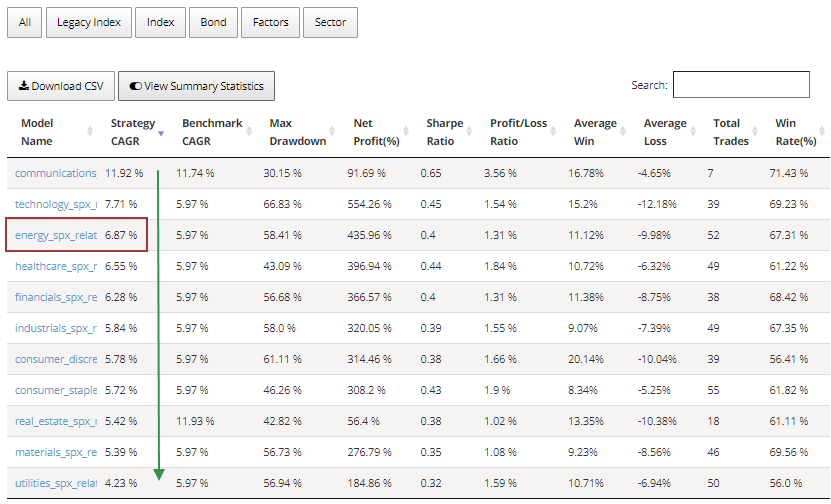
Two of the website's newly introduced relative strength timing models triggered a rotation signal at the close of trading on Tuesday. As the table below shows, new signals are highlighted in yellow on the strategies page to assess model changes efficiently.
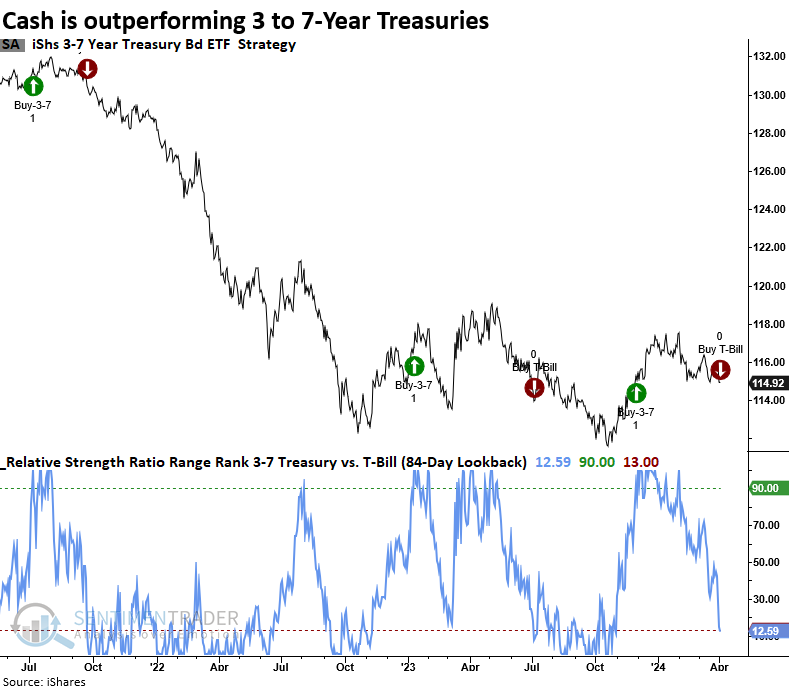
With the economy remaining resilient and inflation sticky, the 3 to 7-year Treasury relative strength timing model rotated away from the medium-term Treasury bond ETF (IEI) in favor of the 1 to 3-month T-Bill ETF (BIL), a proxy for cash.
Energy, a sector we've highlighted in several research reports, has also generated a rotation signal, suggesting investors should acknowledge a potential transition to leadership status relative to the broad market.
Following the shift to cash in July 2023, the 3-to 7-year Treasury bond ETF declined, resulting in higher yields. This shift coincided with the peak in stock indexes, contributing to the 10% drop in the S&P 500.
Should the equity market take a breather from the torrid pace over the previous five months, a backup in yields could be the culprit.
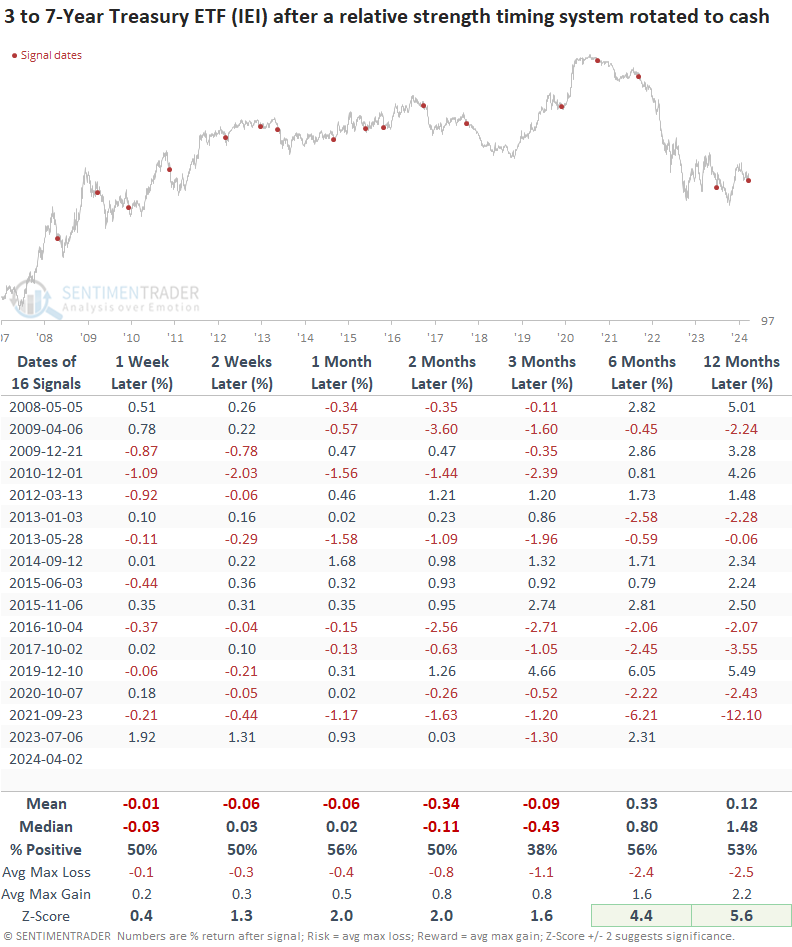
Similar rotations to cash suggest lower prices (higher yields) for the 3 to 7-year Treasury ETF
Once the 3-to 7-year Treasury relative strength timing model shifted in favor of a cash proxy, the medium-term Treasury bond ETF (IEI) struggled over the ensuing three months. That was especially the case with signals since 2016, with every precedent showing a loss at some point over that same period.
While long-term results look okay, we must remember that most instances occurred in a bullish uptrend for bond prices.
The weight of the evidence still favors bonds over cash
With only one out of ten bond ETFs shifting in favor of cash, the weight of the evidence continues to favor a positive macro message from the bond market.
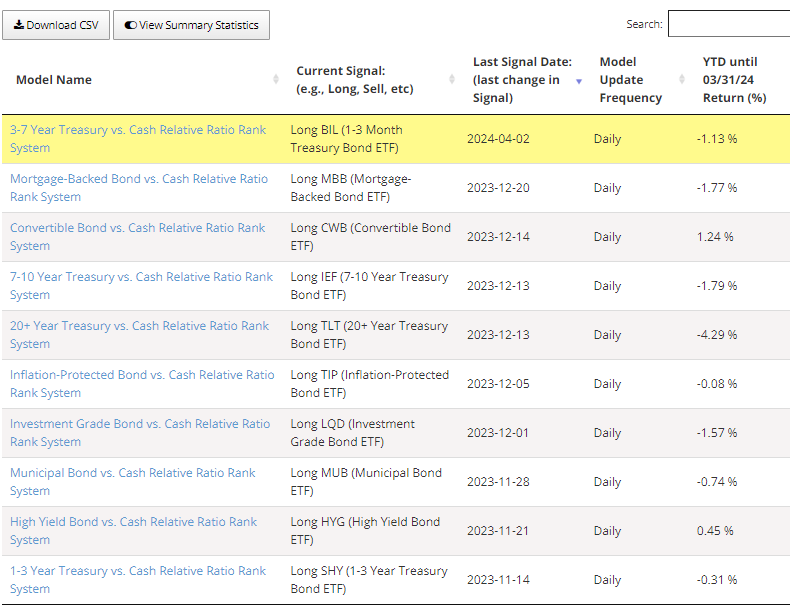
As of Tuesday's close, 90% of bond ETFs maintained a buy signal versus the T-Bill ETF. However, this morning, several models were positioned to rotate to cash. A composite sell signal occurs when the percentage falls to 10%.
The programming team is diligently working to incorporate this chart into the bond folder on the strategies page, allowing you to monitor composite signals in real-time.
A breakout in energy accompanied by a favorable relative trend backdrop
With the energy sector breaking out of long consolidation, the current relative trend signal could resemble precedents associated with cyclical upswings in the group.
Over the following three months, the S&P 500 energy sector ETF (XLE) exhibited a positive trajectory 78% of the time, boasting a median return of 5.7%. Furthermore, the median return showed significance relative to the study period.
Large-cap Energy joins Technology, Industrials, Financials, and Communication Services with a bullish relative trend signal.
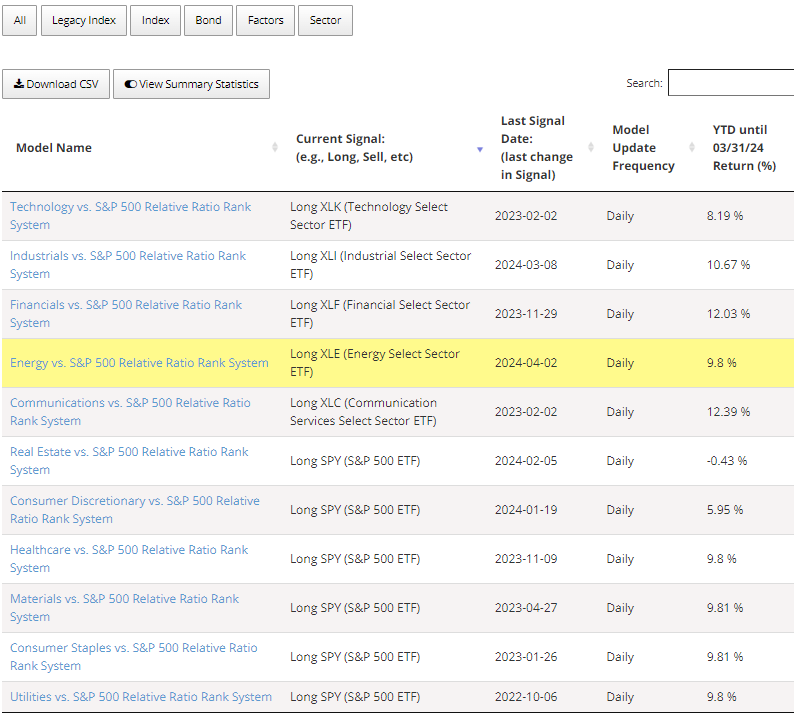
Energy is the second-best-performing sector rotation strategy, with a 6.87% CAGR, outpacing the S&P 500 CAGR of 5.97% over the strategy's lifetime.
While the Communication Services sector's 11.92% CAGR is higher, it's not an apples-to-apples comparison as the ETF commenced trading in 2018.
What the research tells us...
A relative strength timing model generated a new buy signal for the Energy sector. With energy joining several economically sensitive groups exhibiting positive relative trends versus the S&P 500, the equity market reflects a resilient economy. In this environment, it's not unusual for yields and inflation to tick up, a trend we're presently witnessing, highlighted by a bond timing model transitioning to cash. As long as we don't see a meaningful rise in either metric, stocks should maintain their upward trajectory, notwithstanding routine consolidations or corrections that are par for the course in the equity market.