
A recurring opportunity that hides in plain sight

Key Points
- Soybeans and wheat have different planting cycles
- As a result, they also have different seasonal cycles
- Recognizing these cycles offers some surprisingly reliable opportunities for traders willing to assume the risks
Soybean and Wheat Seasonality
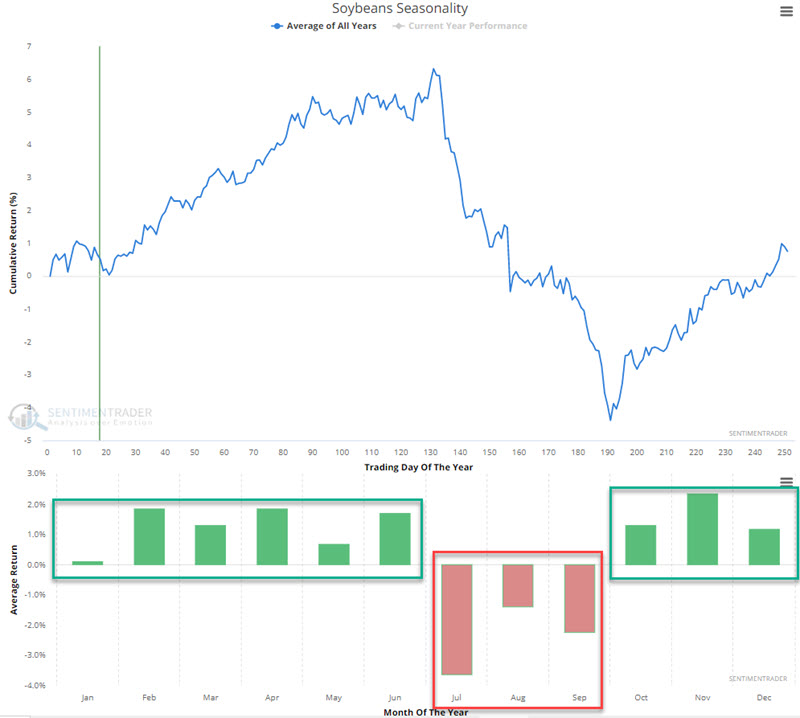
The chart below displays the annual seasonal trend for soybean futures over the past 30 years. Note the tendency for strength from October through June and weakness from July through September.
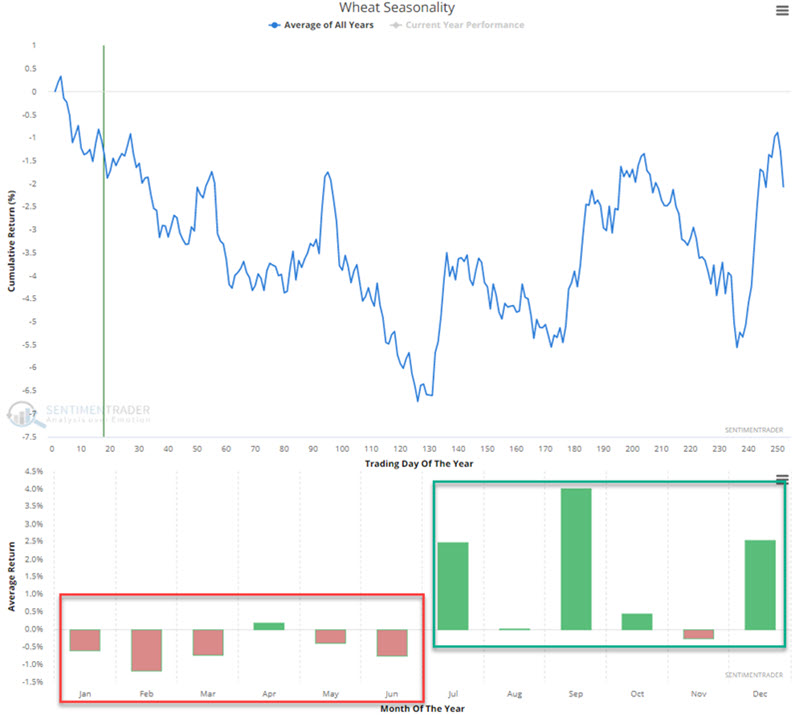
The chart below displays the annual seasonal trend for wheat futures over the past 30 years. Note the tendency for weakness during the first half of the year and strength during the second half.
So the questions are "how persistent" are these trends and can they be traded?
Extended historical data
We have accumulated soybean and wheat data (primarily from Bloomberg) from 1937. We tested the month-by-month performance for both commodities using continuous futures contract price data and found some attractive and reliable seasonal tendencies.
A few notes regarding results:
- Both soybeans and wheat futures contracts represent 5,000 bushels. A one-point movement in the commodity's price represents a $50 change in the value of the futures contract. For example, a 100 point rise by soybeans equates to a gain of $5,000 in the value of the contract. Likewise, if wheat declines 50 points in a month, that equates to a $2,500 decline in a wheat futures contract value.
- We look only at monthly closing prices for each contract and the respective change in contract value for both commodities for testing purposes.
- The results are hypothetical only, simply looking at monthly price changes and with no deductions for slippage or commissions that would apply to actual real-world trading.
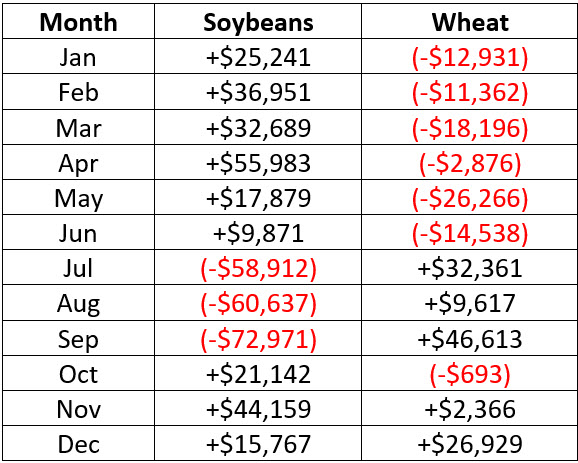
The table below displays the cumulative hypothetical dollar gain or loss experienced by each commodity on a month-by-month basis. Note that these numbers bear out the action shown earlier in the seasonal charts, i.e., soybeans show strength October through June while wheat shows strength during the second half of the calendar year.
Creating a "strategy"
Now let's consider a hypothetical strategy that trades, as shown below:
- For the first six months of each year, a trader would hold a long position in soybeans and a short position in wheat
- At the end of June, these positions would reverse to go short soybeans and long wheat
- For the last three months of the year, a trader would hold a long position in both contracts
The table also displays the hypothetical monthly results from having a 1-lot position in each commodity - long or short - as shown.
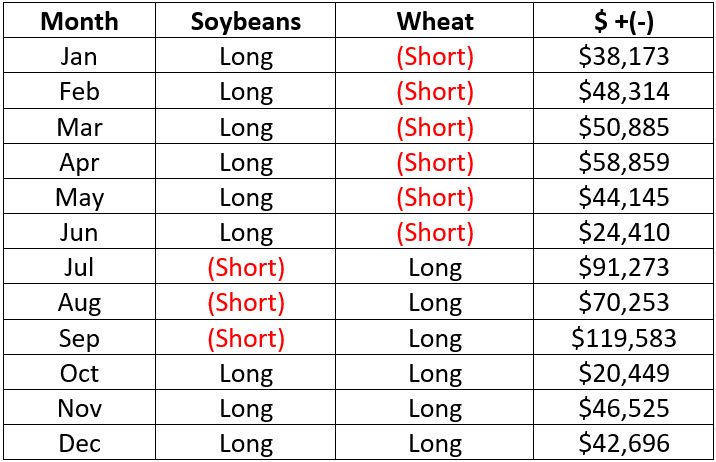
Real-world trading results would undoubtedly be impacted by rolling from one futures contract month to another and by the inevitable slippage and commission costs. Still, the key thing to note is that the core strategy showed a cumulative gain for each month since 1937.
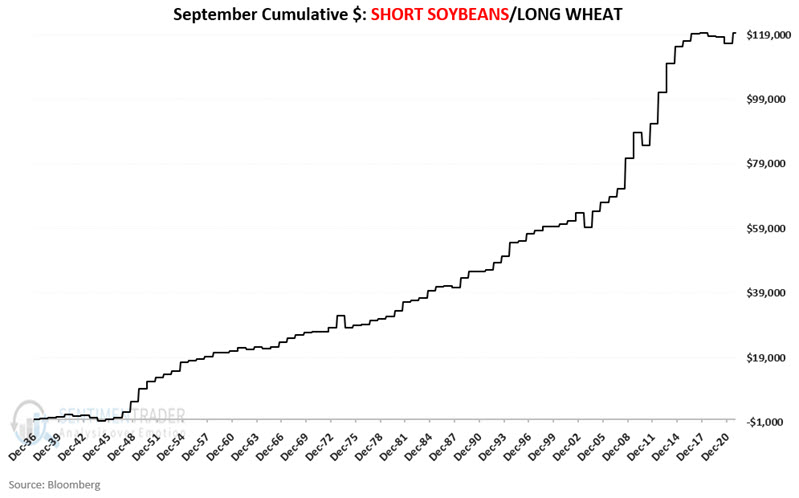
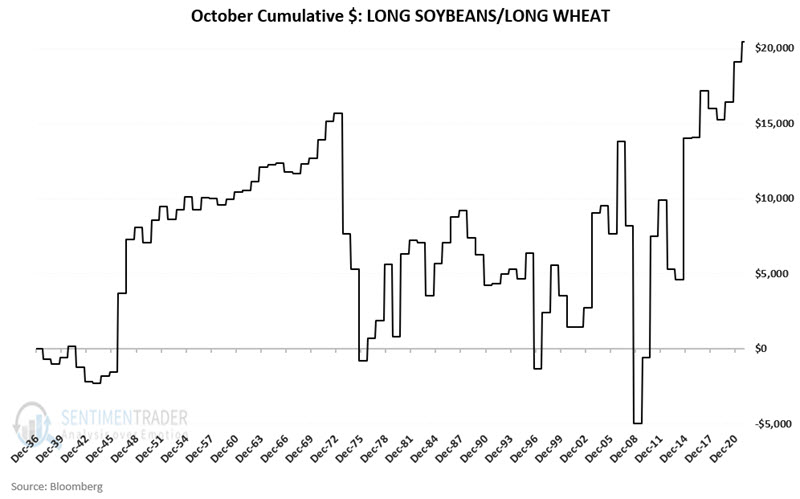
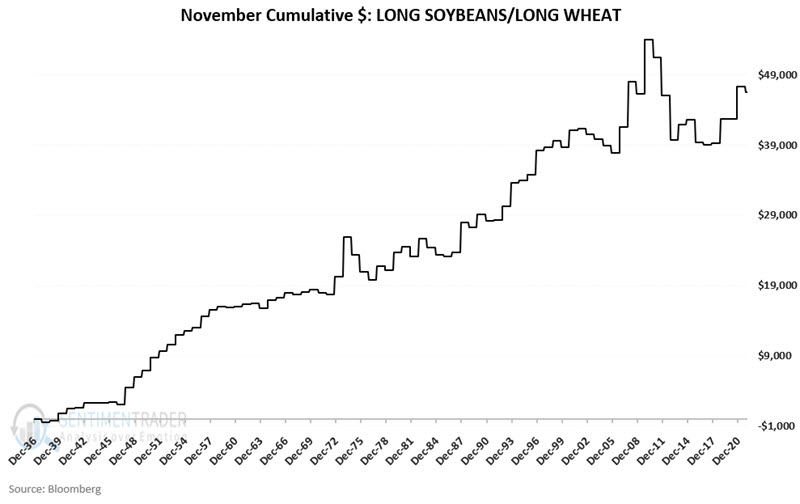
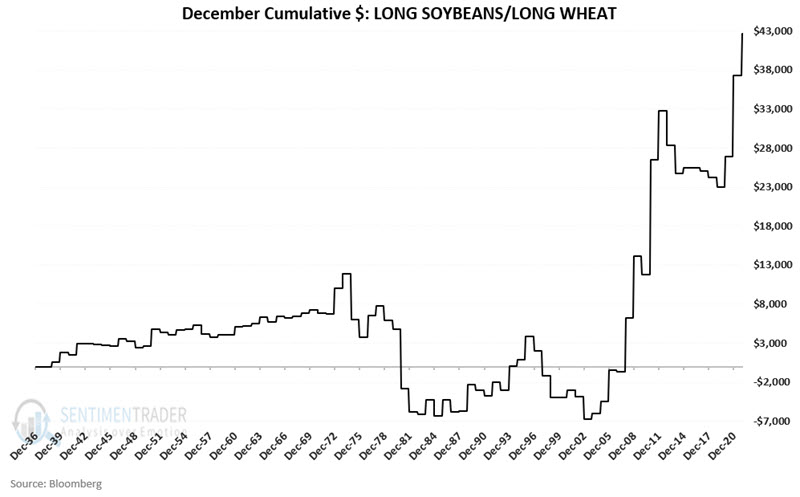
Month-by-Month
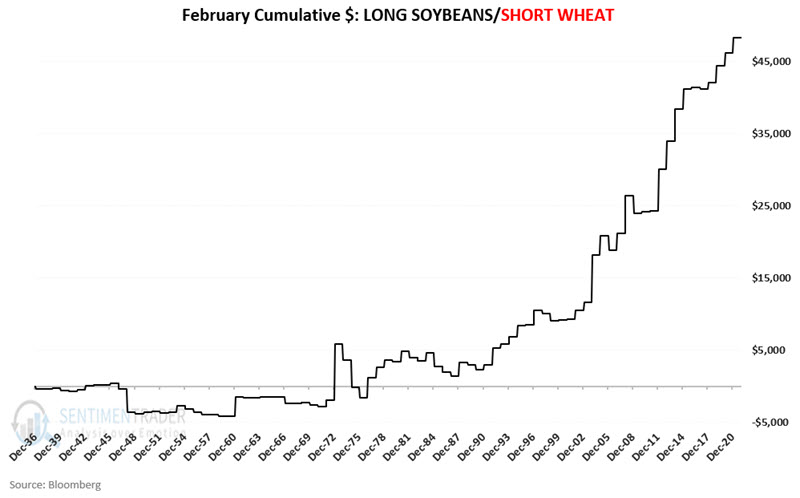
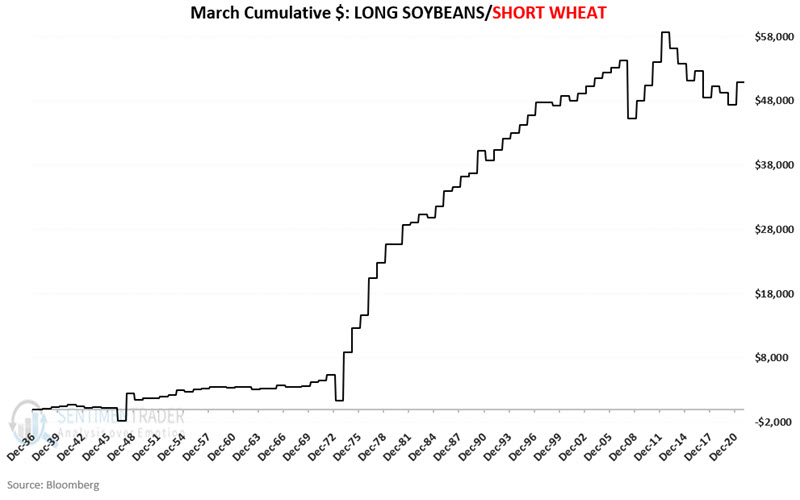
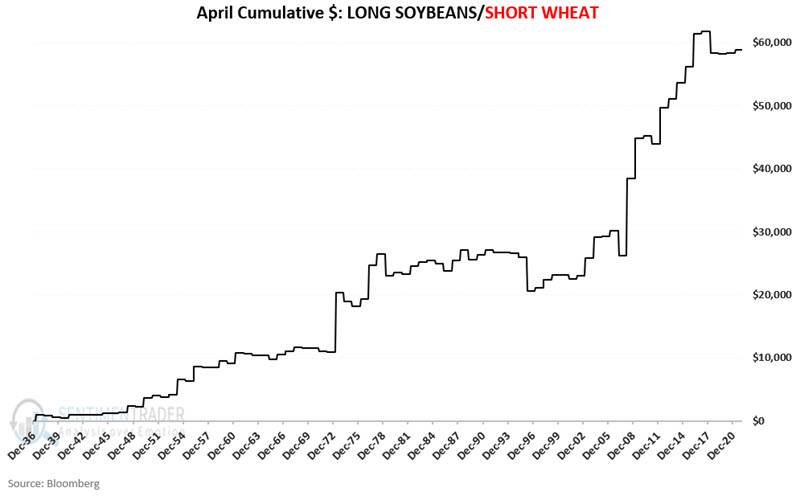
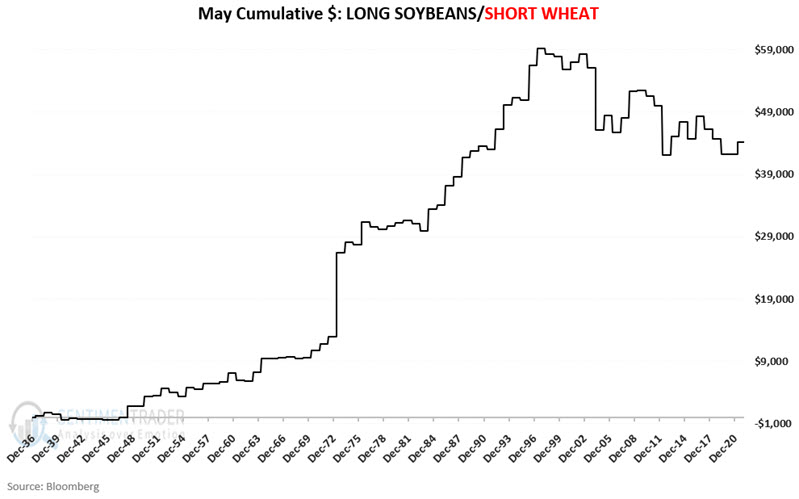
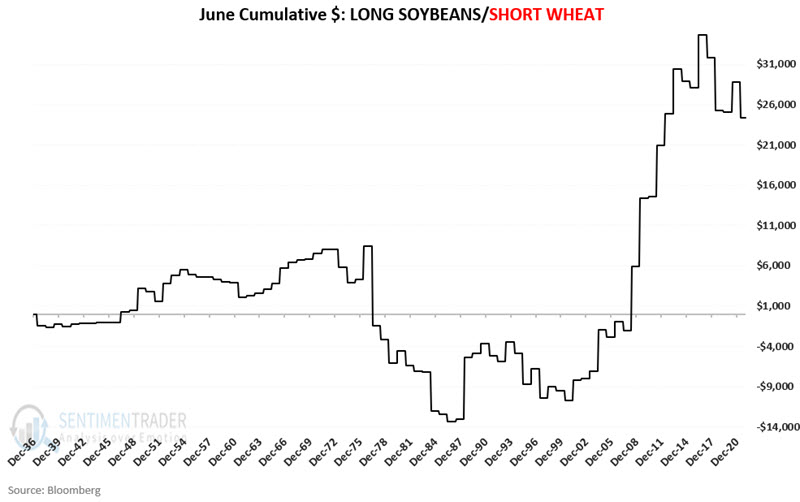
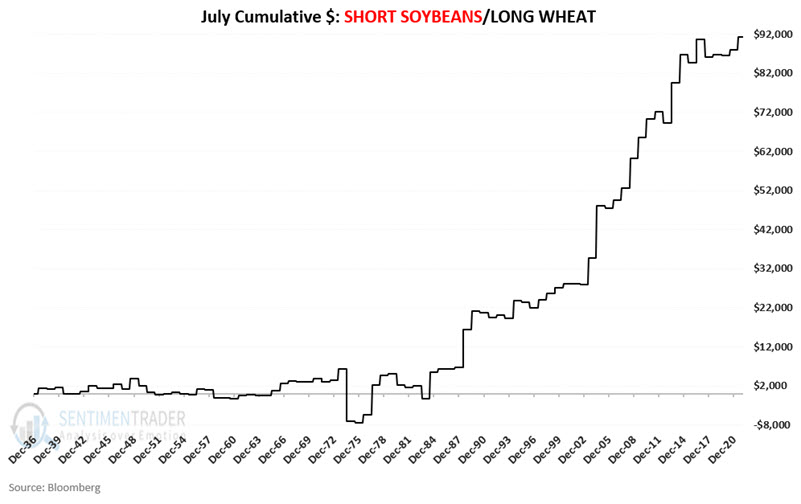
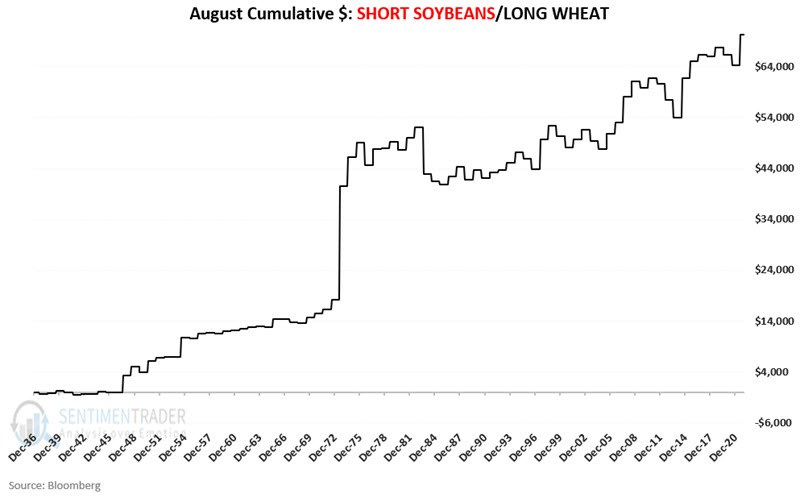
Before we examine the cumulative results - and to better understand performance - the charts below display the cumulative month-by-month returns using the strategy above.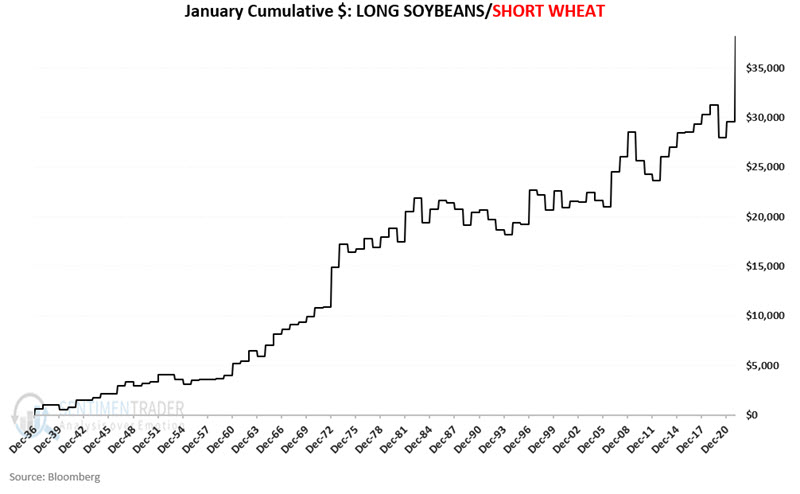
Putting it all together
The chart below displays the hypothetical yearly $ +(-) for this strategy.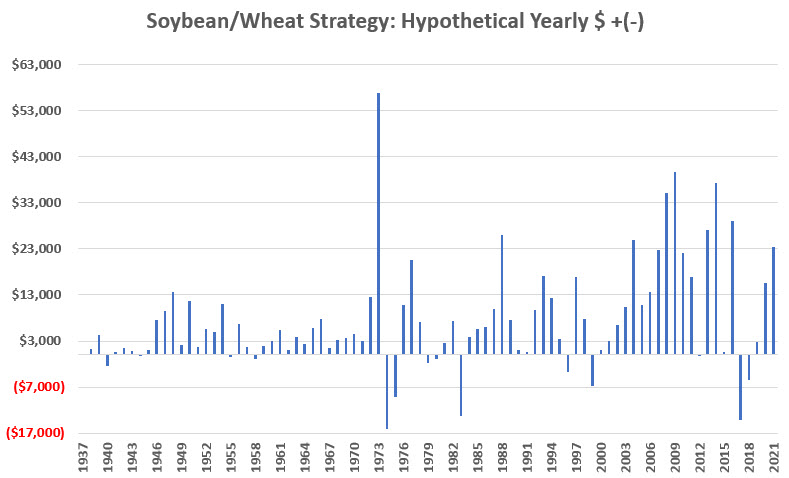
The chart below displays this strategy's cumulative hypothetical $ +(-).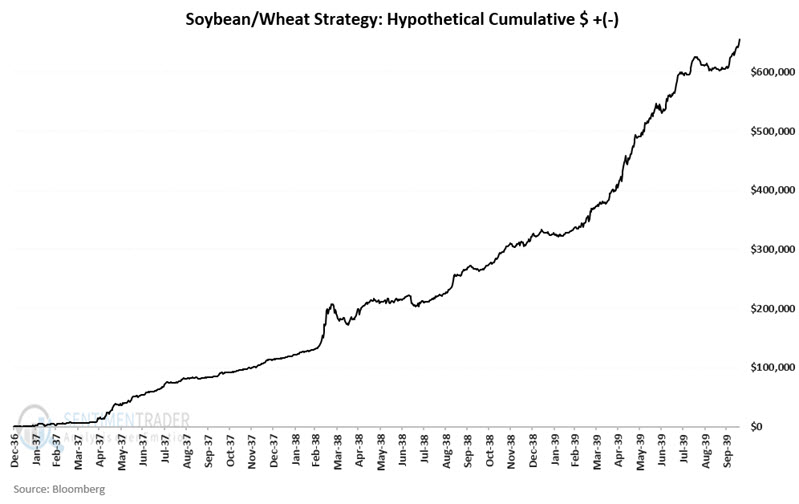
The table below displays a summary an annual results.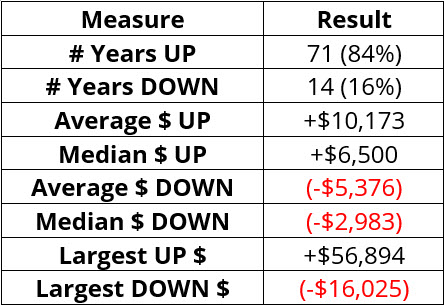
To complete the picture regarding the realities of trading commodity futures, the chart below displays the $ drawdowns for the strategy using month-end data.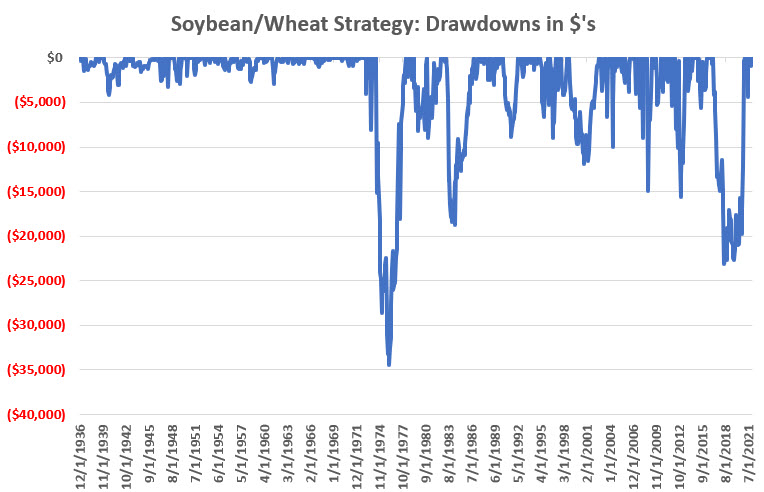
What the research tells us…
Opportunities are everywhere in the financial markets. The keys are finding an "edge" to figure out how to exploit that edge and manage risk. The persistence of the seasonal trends in soybeans and wheat appear to offer a consistent edge. It is up to each trader to decide if it is an opportunity worth pursuing.