Products
SentimenTrader Trading Tools
‍
Backtest Engine
My Trading Toolkit
Correlation Analysis
Seasonality
Market Prediction
Indicators & Data API
‍
Proprietary Indicators & Charts
Market Data API
Strategies & Scanner
‍
50+ Trading Strategies
Smart Stock Scanner
Smart Option Scanner
Research Reports
‍
Research Solutions
Reports Library
Free Resources
Simple Backtest Calculator
Simple Seasonality Calculator
The Kelly Criterion Calculator
Sentiment Geo Map
Public Research Reports
Education
Sentiment Indicators
Technical Indicators
Pricing
Company
About
In the News
Testimonials
Client Success Stories
Contact
Log inLoginSign up
< BACK TO ALL REPORTS

A recovery in small-cap participation bodes well for the cyclical advance

Dean Christians
2025-06-09
For only the 8th time since 1980, the percentage of Russell 2000 stocks above their 50-day average has cycled from below 5% to above 75%. Similar breadth recoveries in economically sensitive small-cap stocks have historically resulted in 100% win rates across several time frames for both the Russell 2000 and the S&P 500.

Key points:

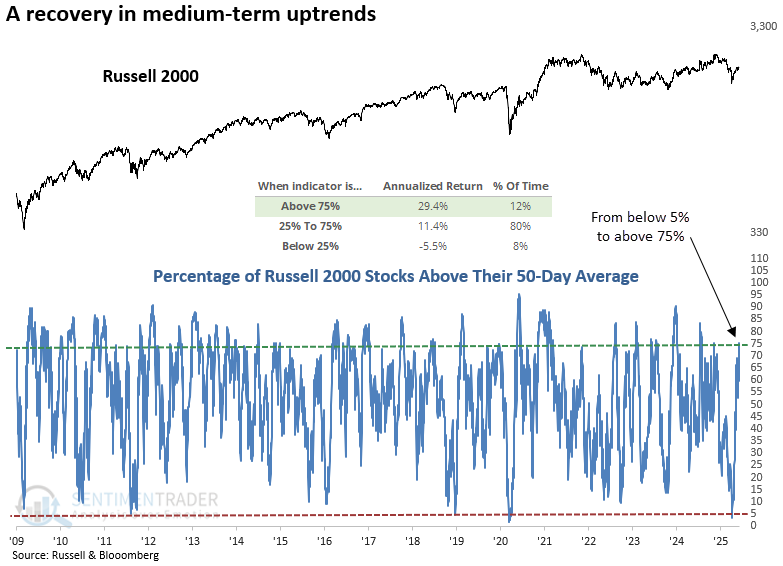
  • The percentage of Russell 200 stocks above their 50-day average cycled from below 5% to above 75%
  • Similar recoveries in participation saw the small-cap index rise 100% of the time over several horizons
  • The Russell 2000 tended to outperform the S&P 500 after similar signals

Participation is broadening across economically sensitive small-cap stocks 

Small-cap stocks have shown a marked improvement in participation, with over 75% of Russell 2000 constituents now trading above their 50-day moving average, an impressive rebound from a deeply oversold condition when fewer than 4% were above that level. 

This surge indicates expanding market breadth, hinting at rising investor appetite for riskier segments of the equity market. Such widespread participation across a diverse range of smaller, more economically sensitive companies typically occurs during the initial stages of a cyclical advance, signaling that the recovery is not limited to a narrow segment of the market but is instead gaining traction across a wider swath of stocks.

As shown in the chart, the Russell 2000 has delivered a 29% annualized return when more than 75% of its stocks are above their 50-day moving average. 

Similar recoveries in medium-term trends preceded excellent returns

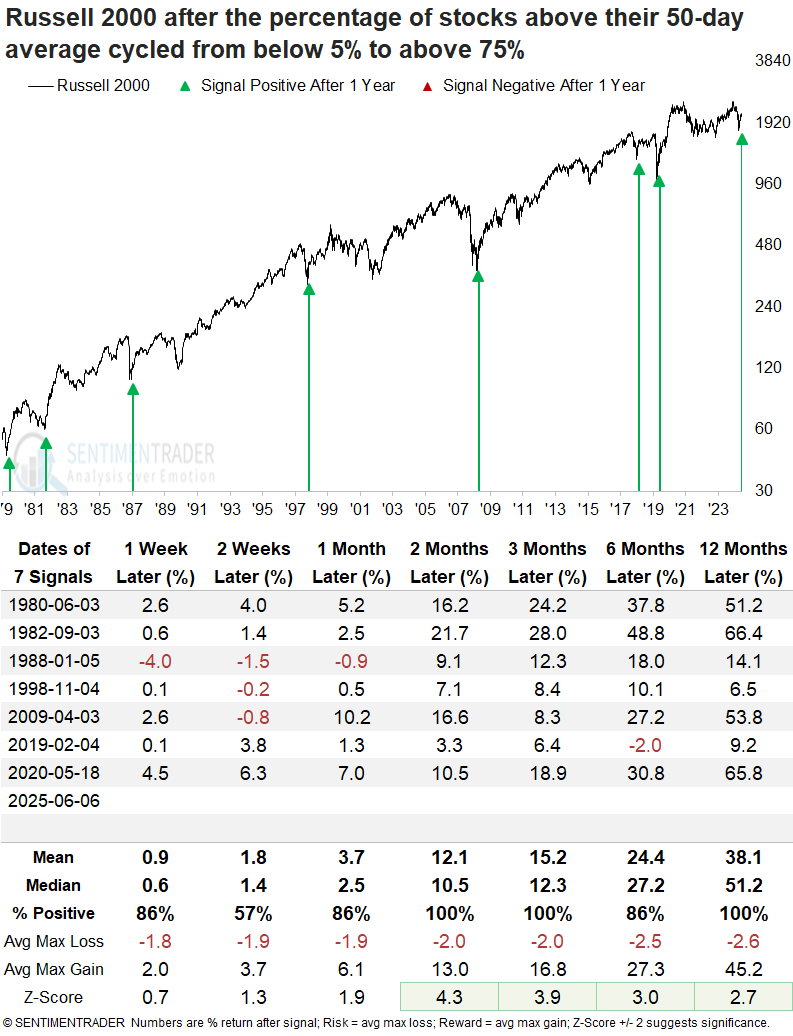
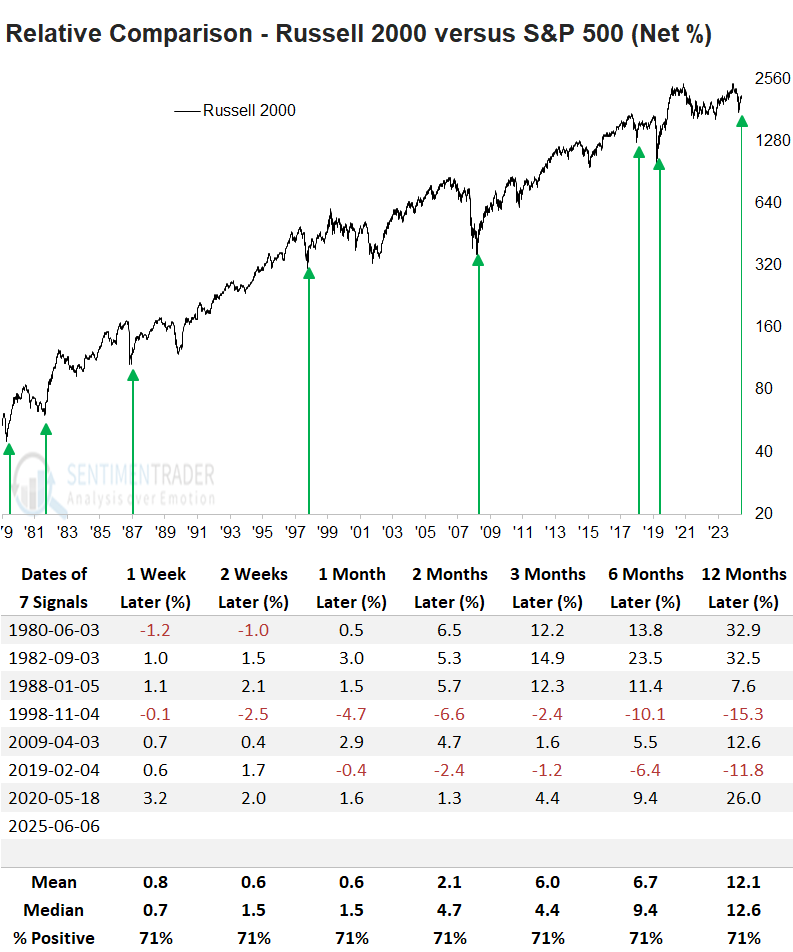
Although the sample size is small, whenever the percentage of Russell 2000 stocks above their 50-day average cycled from below 5% to above 75%, the widely followed small-cap index rose 100% of the time over the next two, three, and twelve months. 

Many of the historical comparisons stem from post-recession bear markets, which differ from today's backdrop. As such, it may be more appropriate to align expectations with the signals in 1998 or 2019, where the results, while positive, were less robust. 

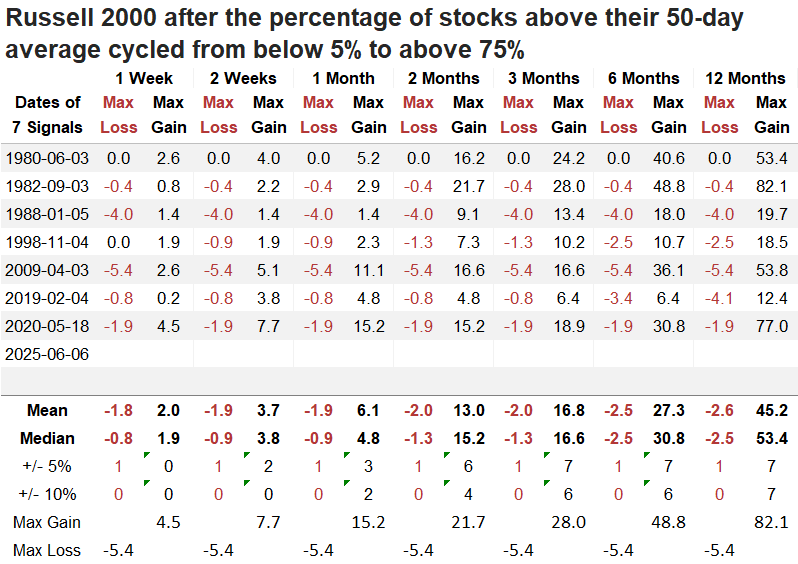
Over the next year, the Russell 2000 never experienced a drawdown greater than 10%, while it rallied more than 10% each time. 

The S&P 500 displayed excellent results after participation trends for small-cap stocks recovered, rallying 100% of the time over the subsequent two, six, and twelve months.

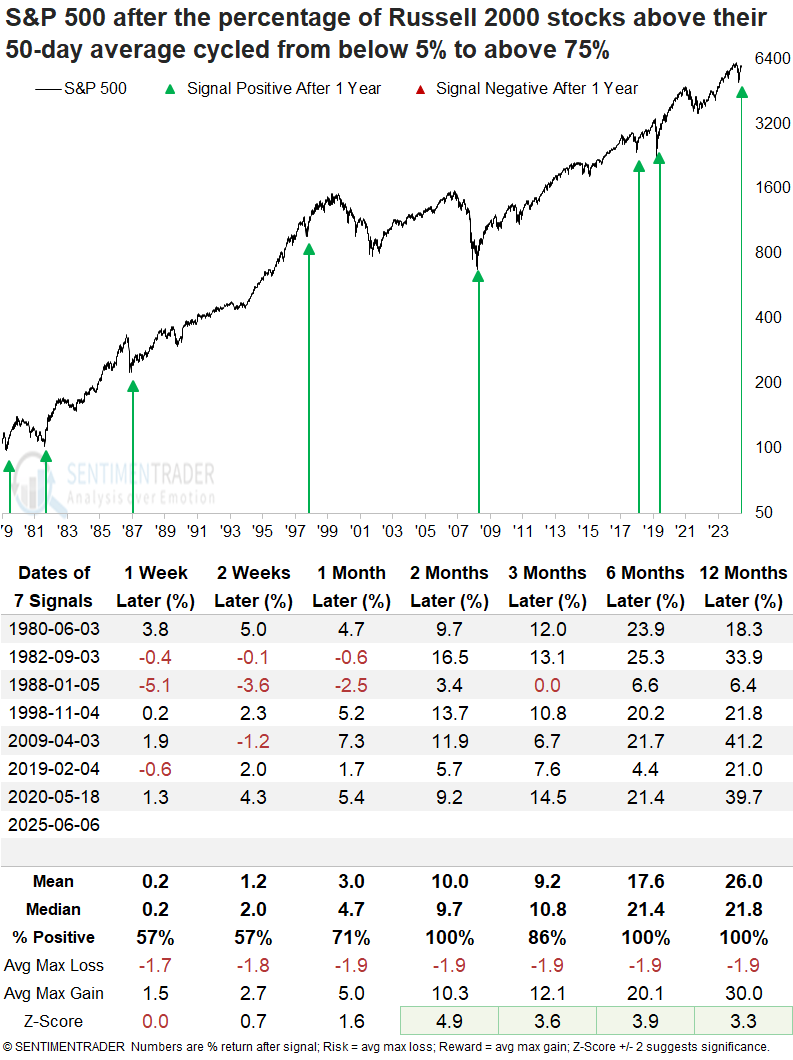
The Russell 2000 consistently outperformed the S&P 500 over the next year. However, as previously mentioned, the more meaningful gains largely followed recoveries from recessionary bear markets. If 1998 and 2019 offer better comparisons, investors looking to play catch-up via the Russell 2000 ETF (IWM) should implement disciplined risk management controls, such as stop-losses. 

What the research tells us...

Participation is broadening among small-cap stocks, a bullish development for these economically sensitive shares and the broader market. Historically, improving breadth has often signaled increased risk appetite and a healthier market foundation. However, one key concern remains: interest rates continue to hover near the upper end of their multi-year ranges. Elevated rates have been a persistent headwind for small-cap companies, which are typically more sensitive to interest rate fluctuations. As a result, I'm viewing this signal more as a trade to rent rather than a long-term investment to own. The duration of the opportunity will likely hinge on the path of interest rates. Any meaningful easing would help sustain and extend the rally from here.

PRODUCTS
SentimenTrader
Trading Tools
Indicators & Data API
‍
Strategies & Scanner
‍
Research Reports
FREE
RESOUrCES
Simple Backtest
Calculator
Simple Seasonality
Calculator
The Kelly Criterion
Calculator
Sentiment Geo Map
‍
Public Research Reports
‍
Education
Sentiment Indicators
‍
Technical Indicators
‍
Pricing
Bundle pricing
‍
FAQ
‍
Announcements
‍
COMPANY
‍
About
‍
In the News
‍
Testimonials
‍
Client Success Stories
CONTACT
‍
General Inquiries
‍
Media Inquiries
‍
Financial Professionals Inquiries
‍
© 2026 Sundial Capital Research Inc. All rights reserved.
Setsail Marketing
TermsPrivacyAffiliate Program
Risk Disclosure: The information and tools provided are for research and analytical purposes only and are not intended as investment advice. Market analysis involves uncertainty, and outcomes may differ from expectations. Users should conduct their own due diligence and consider their individual circumstances before making any financial decisions. Past performance is not necessarily indicative of future results.

Hypothetical Performance Disclosure: Hypothetical performance results have many inherent limitations, some of which are described below. No representation is being made that any account will or is likely to achieve profits or losses similar to those shown; in fact, there are frequently sharp differences between hypothetical performance results and the actual results subsequently achieved by any particular trading program. One of the limitations of hypothetical performance results is that they are generally prepared with the benefit of hindsight. In addition, hypothetical trading does not involve financial risk, and no hypothetical trading record can completely account for the impact of financial risk of actual trading. for example, the ability to withstand losses or to adhere to a particular trading program in spite of trading losses are material points which can also adversely affect actual trading results. There are numerous other factors related to the markets in general or to the implementation of any specific trading program which cannot be fully accounted for in the preparation of hypothetical performance results and all which can adversely affect trading results.

Testimonial Disclosure: Testimonials appearing on this website may not be representative of other clients or customers and is not a guarantee of future performance or success.