
A recovery in manufacturing bodes well for stocks

Key points:
- The ISM New Orders Index cycled from below 50 to above 55, reaching the highest level in 32 months
- Similar recoveries in a leading indicator for manufacturing preceded a bullish outlook for stocks
- Financials and technology were the two best-performing sectors over the subsequent year
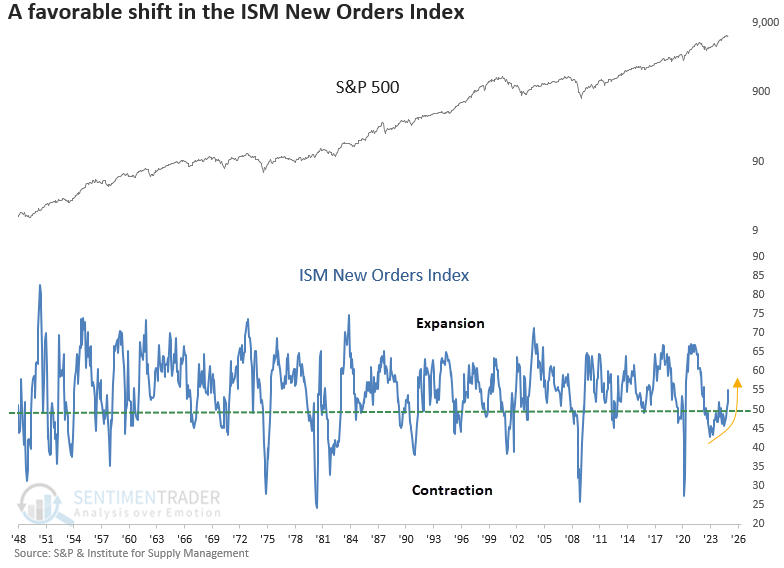
A key leading indicator of economic activity for manufacturing rebounds
The Institute for Supply Management released its closely watched manufacturing survey on Monday. While the headline index edged above 50, signaling expansion, the critical new orders component soared past 55, hitting a 32-month high.
Why does this matter? New orders kickstart the production cycle, making them a leading indicator for manufacturing output, GDP growth, and corporate earnings.
Although not a primary stock market signal, survey-based data such as new orders can validate a supportive environment, often reinforcing favorable conditions for equities.
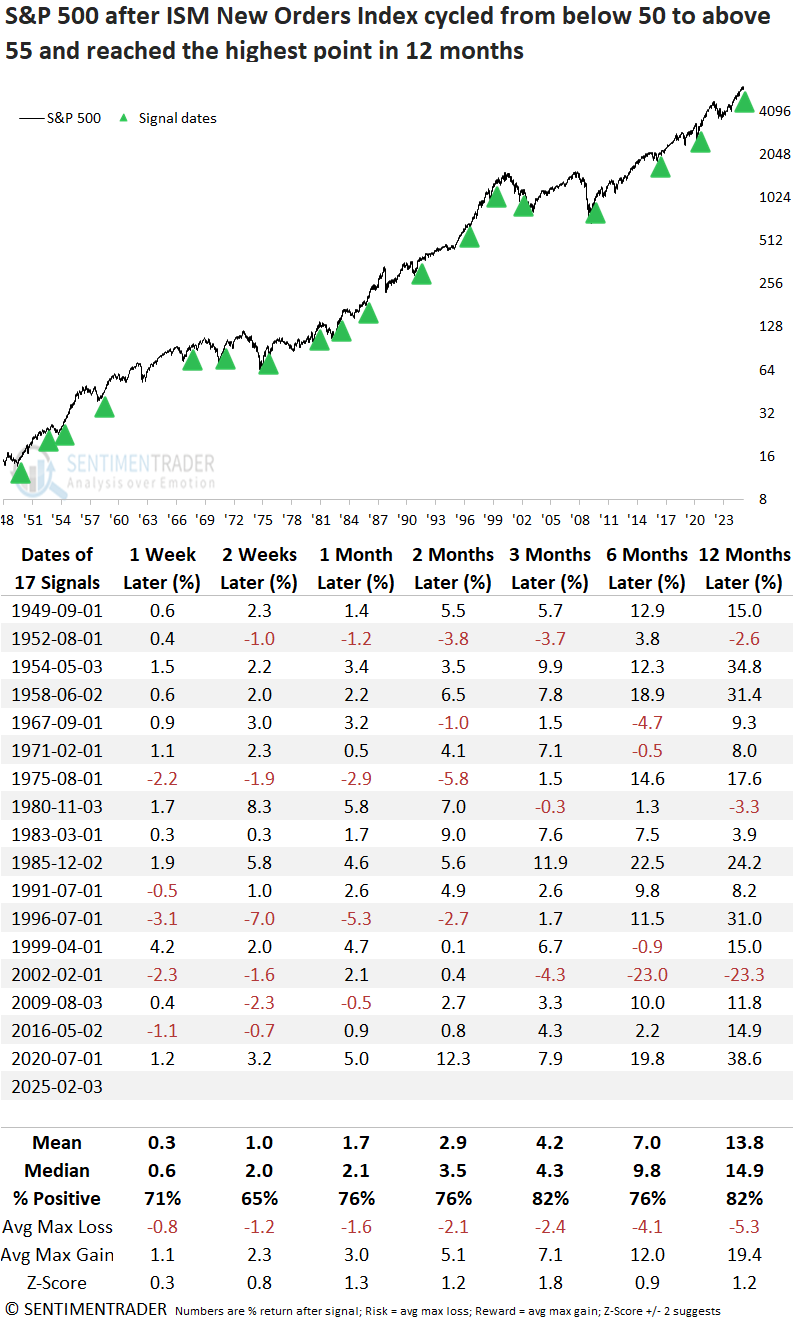
Signal dates were adjusted to align with the first business day of the month, coinciding with the release of ISM data.
Similar recoveries in the ISM New Orders Index preceded positive returns for stocks
Whenever the ISM New Orders Index cycled from below 50 to above 55 and reached at least a 12-month high, the S&P 500 produced excellent returns and consistency over the subsequent year, indicating a favorable economic tailwind.
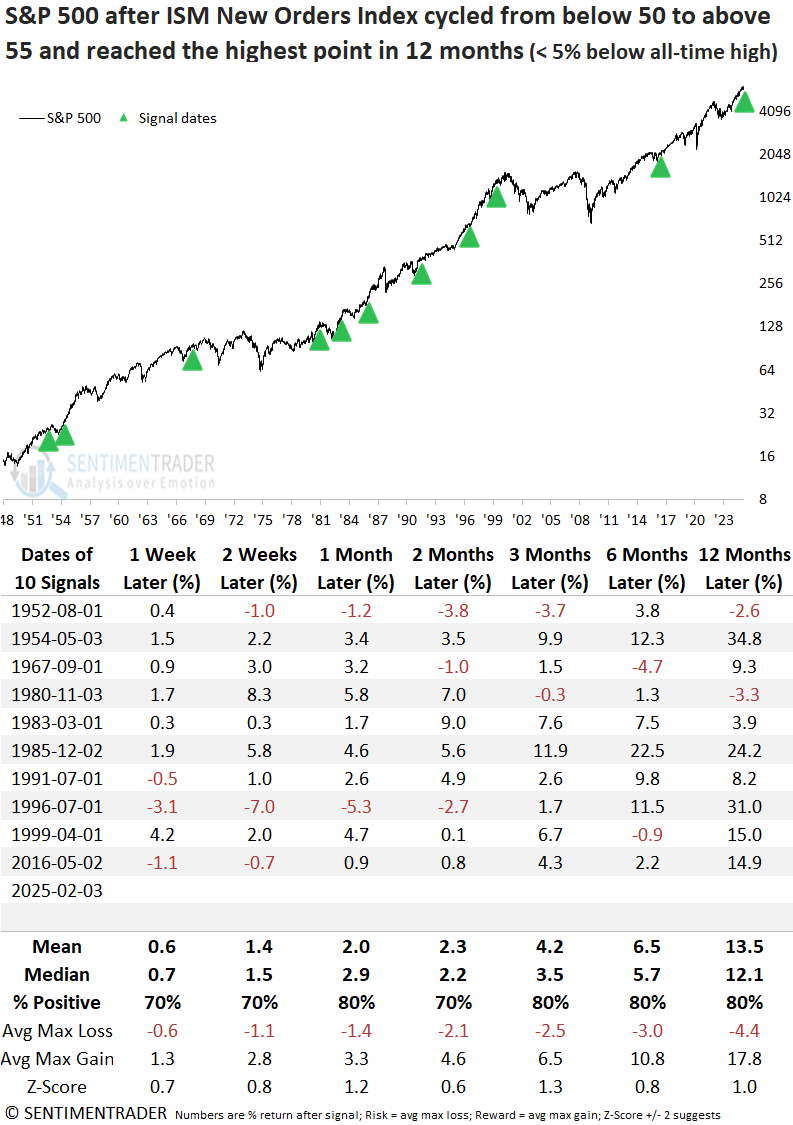
The sole meaningful adverse signal appeared during the 2000-02 bear market, a period markedly different from the present. Accordingly, let's apply a condition requiring the S&P 500 to reside within 5% of an all-time high to identify more relevant historical parallels.
An increase in the ISM New Orders Index, coinciding with the S&P 500 trading near its all-time high, resulted in a comparable market trajectory, marked by robust and consistent gains over the next year.
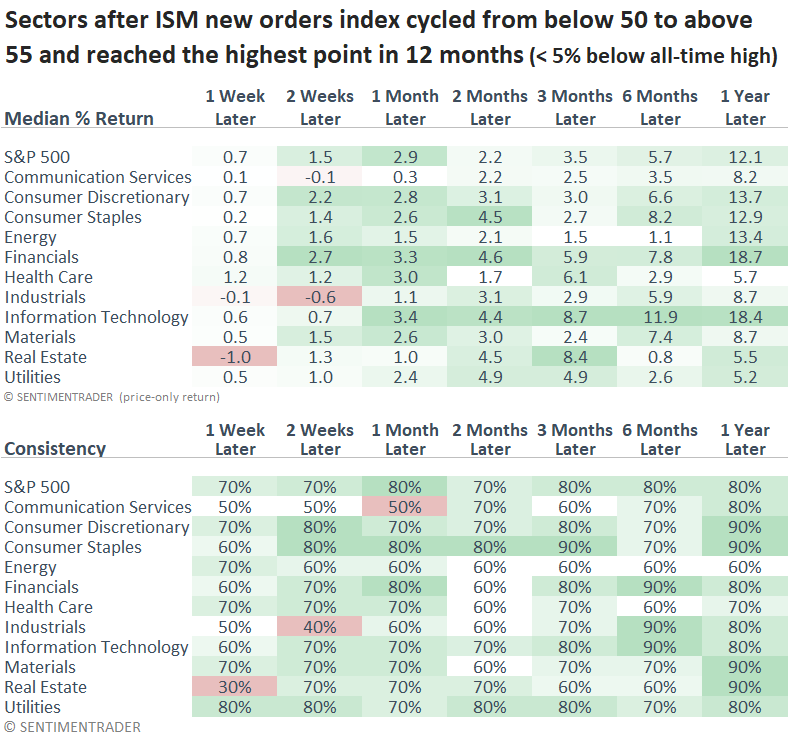
A resurgence in new orders for the manufacturing sector typically bolstered cyclical industries, with financials and technology leading the outperformance in the following year. While financials are on firm footing, technology is starting to falter.
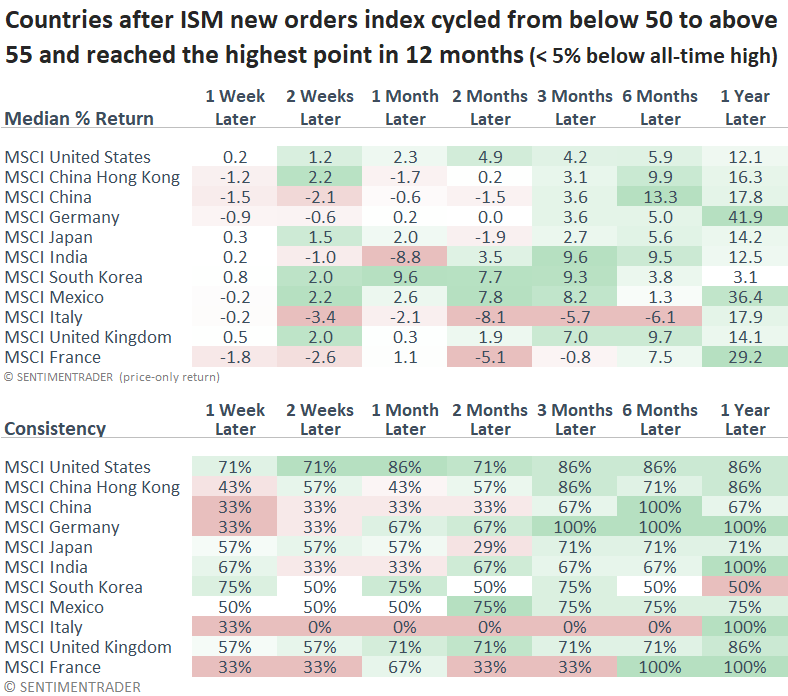
Suppose I apply the signals to the MSCI Country Indexes for the top 10 manufacturing nations by output. In that case, several countries like Germany, Mexico, and France displayed outstanding returns and consistency over the next year.
Two of these countries, Germany and France, were featured in a research report by Jason, highlighting a significant improvement in market breadth. Perhaps the uptick in participation reflects the market's expectation of a global manufacturing revival.
Due to data limitations, returns have been calculated using signals since 1980.
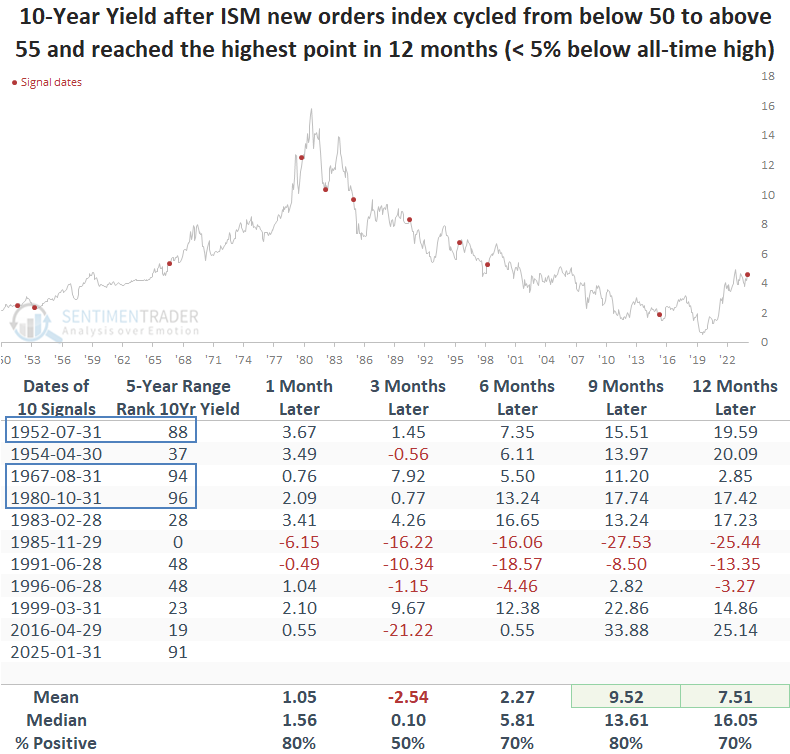
Keep an eye on bond yields
Following similar increases in the ISM new orders survey, the 10-year Treasury yield typically moved higher, advancing 80% of the time over the next nine months. When the yield resided in the upper 80th percentile of its five-year range, it rose without exception.
As I noted in my report, "The breakout in the 10-year Treasury yield suggests rates are going higher," the benchmark 10-year yield is one of the most critical factors for stocks in the current environment. A move toward 5% or beyond could introduce additional challenges for stocks.
I say "additional" because the current level of around 4.5% equates to a 7% mortgage rate, which has weighed on housing-related stocks.
What the research tells us...
After a prolonged period of contraction in the manufacturing sector, signs are emerging that a potential recovery is underway. While no single indicator should be relied upon exclusively, past rebounds in the ISM New Orders Index have often preceded an increase in manufacturing activity that extends to the broader economy, boosting the stock market-particularly cyclical sectors. A revival would also favor countries with strong manufacturing bases like Germany. For now, it appears stocks are beholden to the latest trade war headlines, most likely resulting in a continuation of the rangebound market we've seen over the last few months. Patience and discipline are critical in consolidations.