
A record number of Nasdaq stocks have been cut in half

Key points:
- On the Nasdaq exchange, 38% of stocks have dropped 50% from their 52-week highs
- Nearly two-thirds of them are in bear markets
- These are exceptionally high figures when the Nasdaq Composite is so close to its own high
- The few precedents suggest this should be a good sign, but with a major caveat
Nearly 40% of stocks have been cut in half
Valuations are at historical highs, companies are raising billions based on fairy dust, and the Fed is signaling a tightening cycle. All of these are scaring investors that we're on the cusp of a repeat of 1999-2000.
There are certainly some valid comparisons to that period. And there are some compelling counter-arguments as well. Whatever the fundamental and macro considerations, there is no doubt that investors have been selling first and trying to figure out the rest later.
Since the speculative mania in January/February 2021, many of the riskiest stocks have tumbled. It just so happens many of those stocks trade on the Nasdaq exchange.
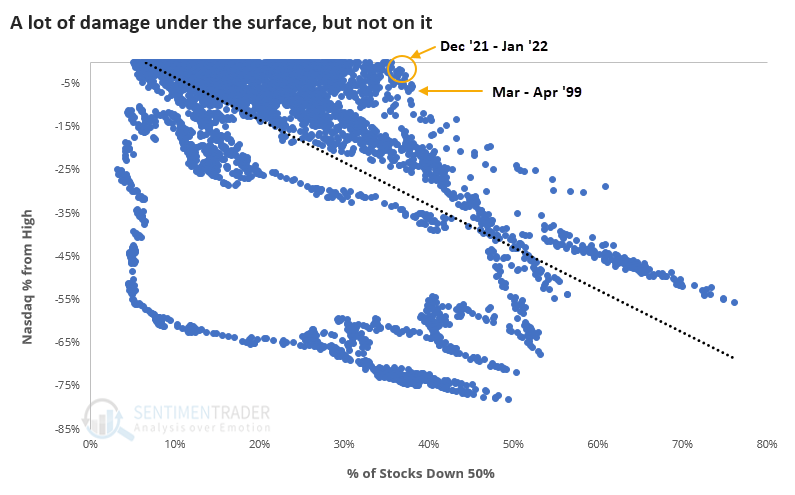
After Wednesday's post-FOMC selloff, more than 38% of stocks trading on the Nasdaq are now down 50% from their 52-week highs. Only 13% of days since 1999 have seen more stocks cut in half.

At no other point since at least 1999 have so many stocks been cut in half while the Nasdaq Composite index was so close to a multi-year peak. When at least 35% of stocks are down by half, the Composite has been down by an average of 47% (!) from its 3-year high.
The average stock tends to catch up
So, what's it mean? Well, that's a tough one since it's never happened before in recent memory.
Bulls will suggest that most of the damage has been done, and the indexes should be able to soar from here. Bears will say this is just like the internet bubble, and the index is about to "catch down" to the average stock.
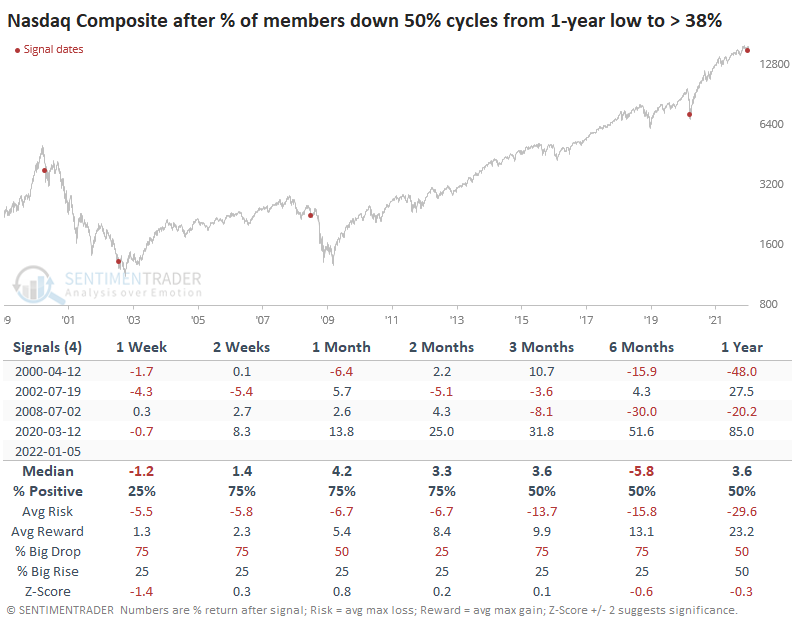
To get a sense of who may most likely be correct, the table below shows dates when the percentage of stocks cut in half cycles from a low level to above 38%. The index bounced around for a couple of months, with losses leading to gains and vice-versa, except for March 2020, which was near the pandemic low.
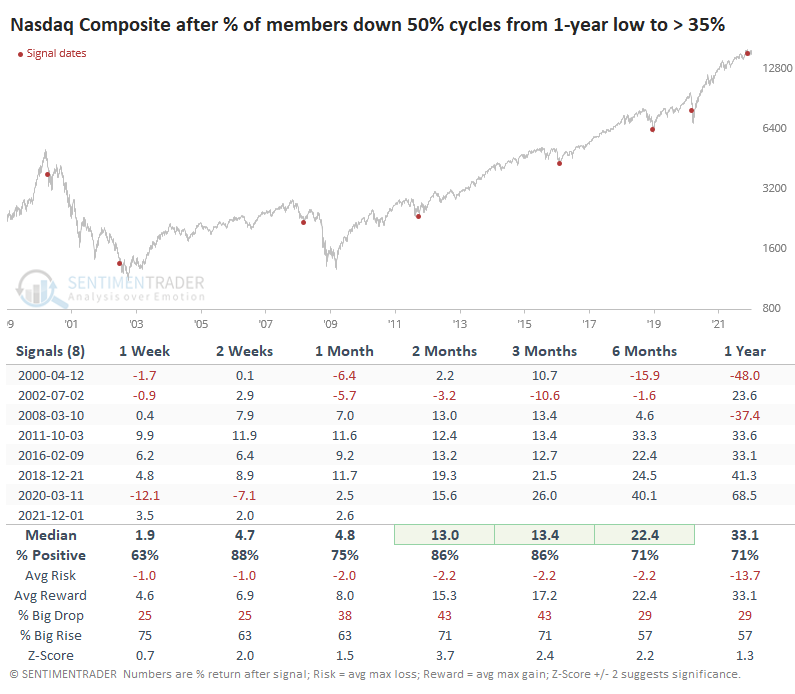
We get a few more precedents if we relax the parameters and look for times when it cycled from a low level to 35% or more (instead of 38% or more). And it was also a better sign, triggering near the bottoms of several medium-term lows in the past decade.
Lots of stocks in bear markets, too
There are also a lot of stocks in bear markets, down 20% or more from their peaks. It's curious that this figure isn't higher.
If so many stocks are down 50%, we could reasonably expect a high number to be down at least 20%. The difference is that the stocks that have been hit have been hit really hard. Most of the others have seen more modest selling pressure.
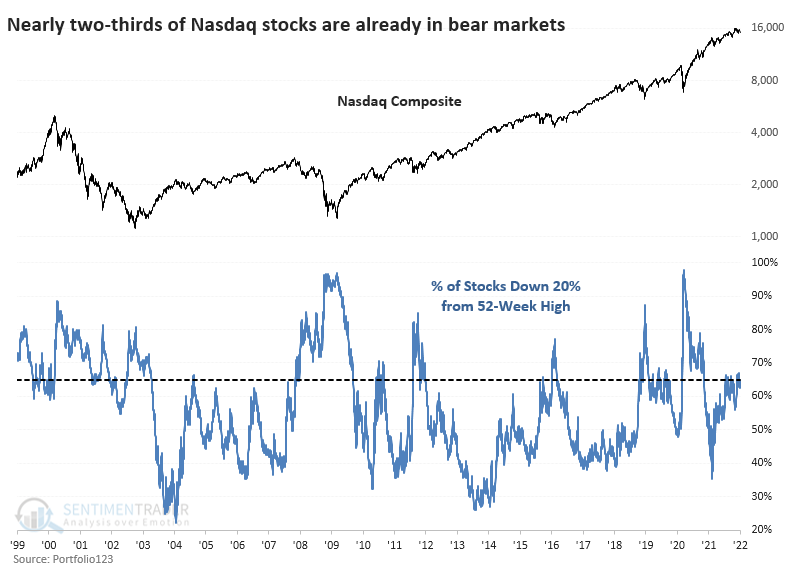
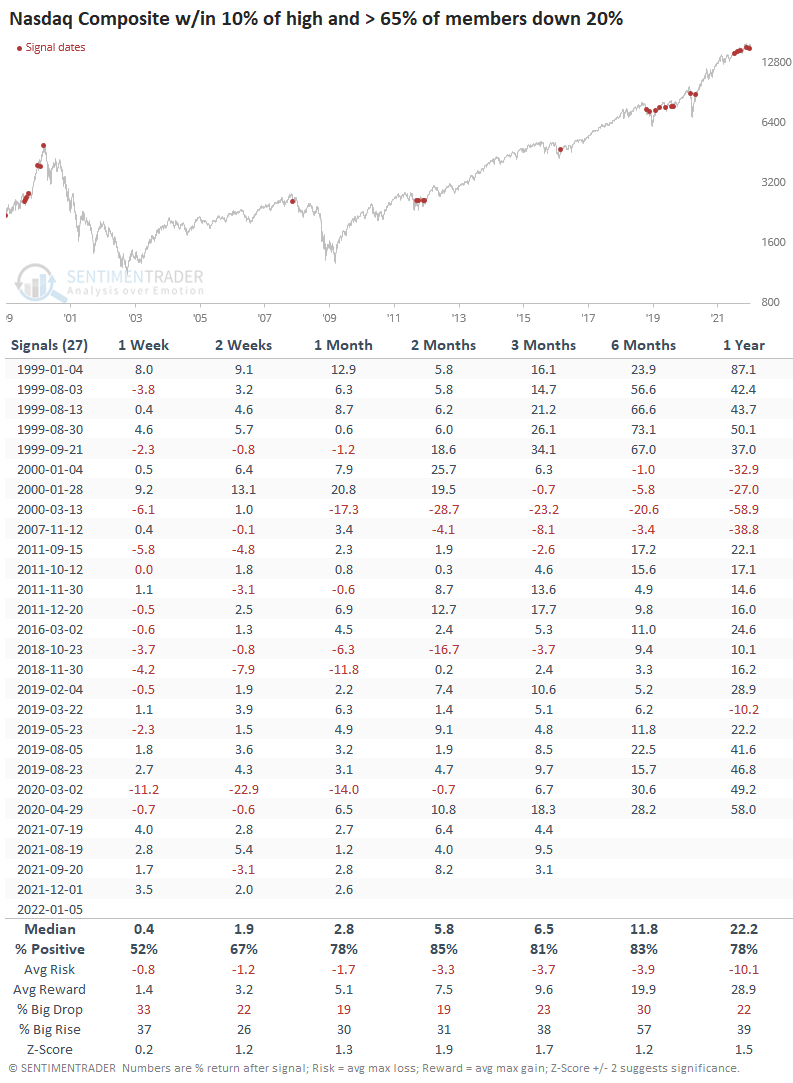
When the Nasdaq Composite wasn't even in correction territory, yet more than 65% of stocks on the exchange were in bear markets, it was a mostly positive sign. Over the next 2 months, the Composite rallied 22 out of 26 times.
What the research tells us...
This is a tough one. There are few, if any, precedents to the kind of activity we're seeing right now on the Nasdaq. There are some signs that it's equivalent to early 1999, right before a massive blow-off rally. And it's also somewhat similar to the behavior right after that peak.
There is a solid argument to be made that so many stocks have been hit so hard that the Nasdaq Composite shouldn't suffer too much more before being able to rally again. The most significant caveat, and it's a major one, is that there is the potential that we're also seeing behavior reminiscent of the 1999 and 2007 peaks.