
A record high with record weakness

Key points:
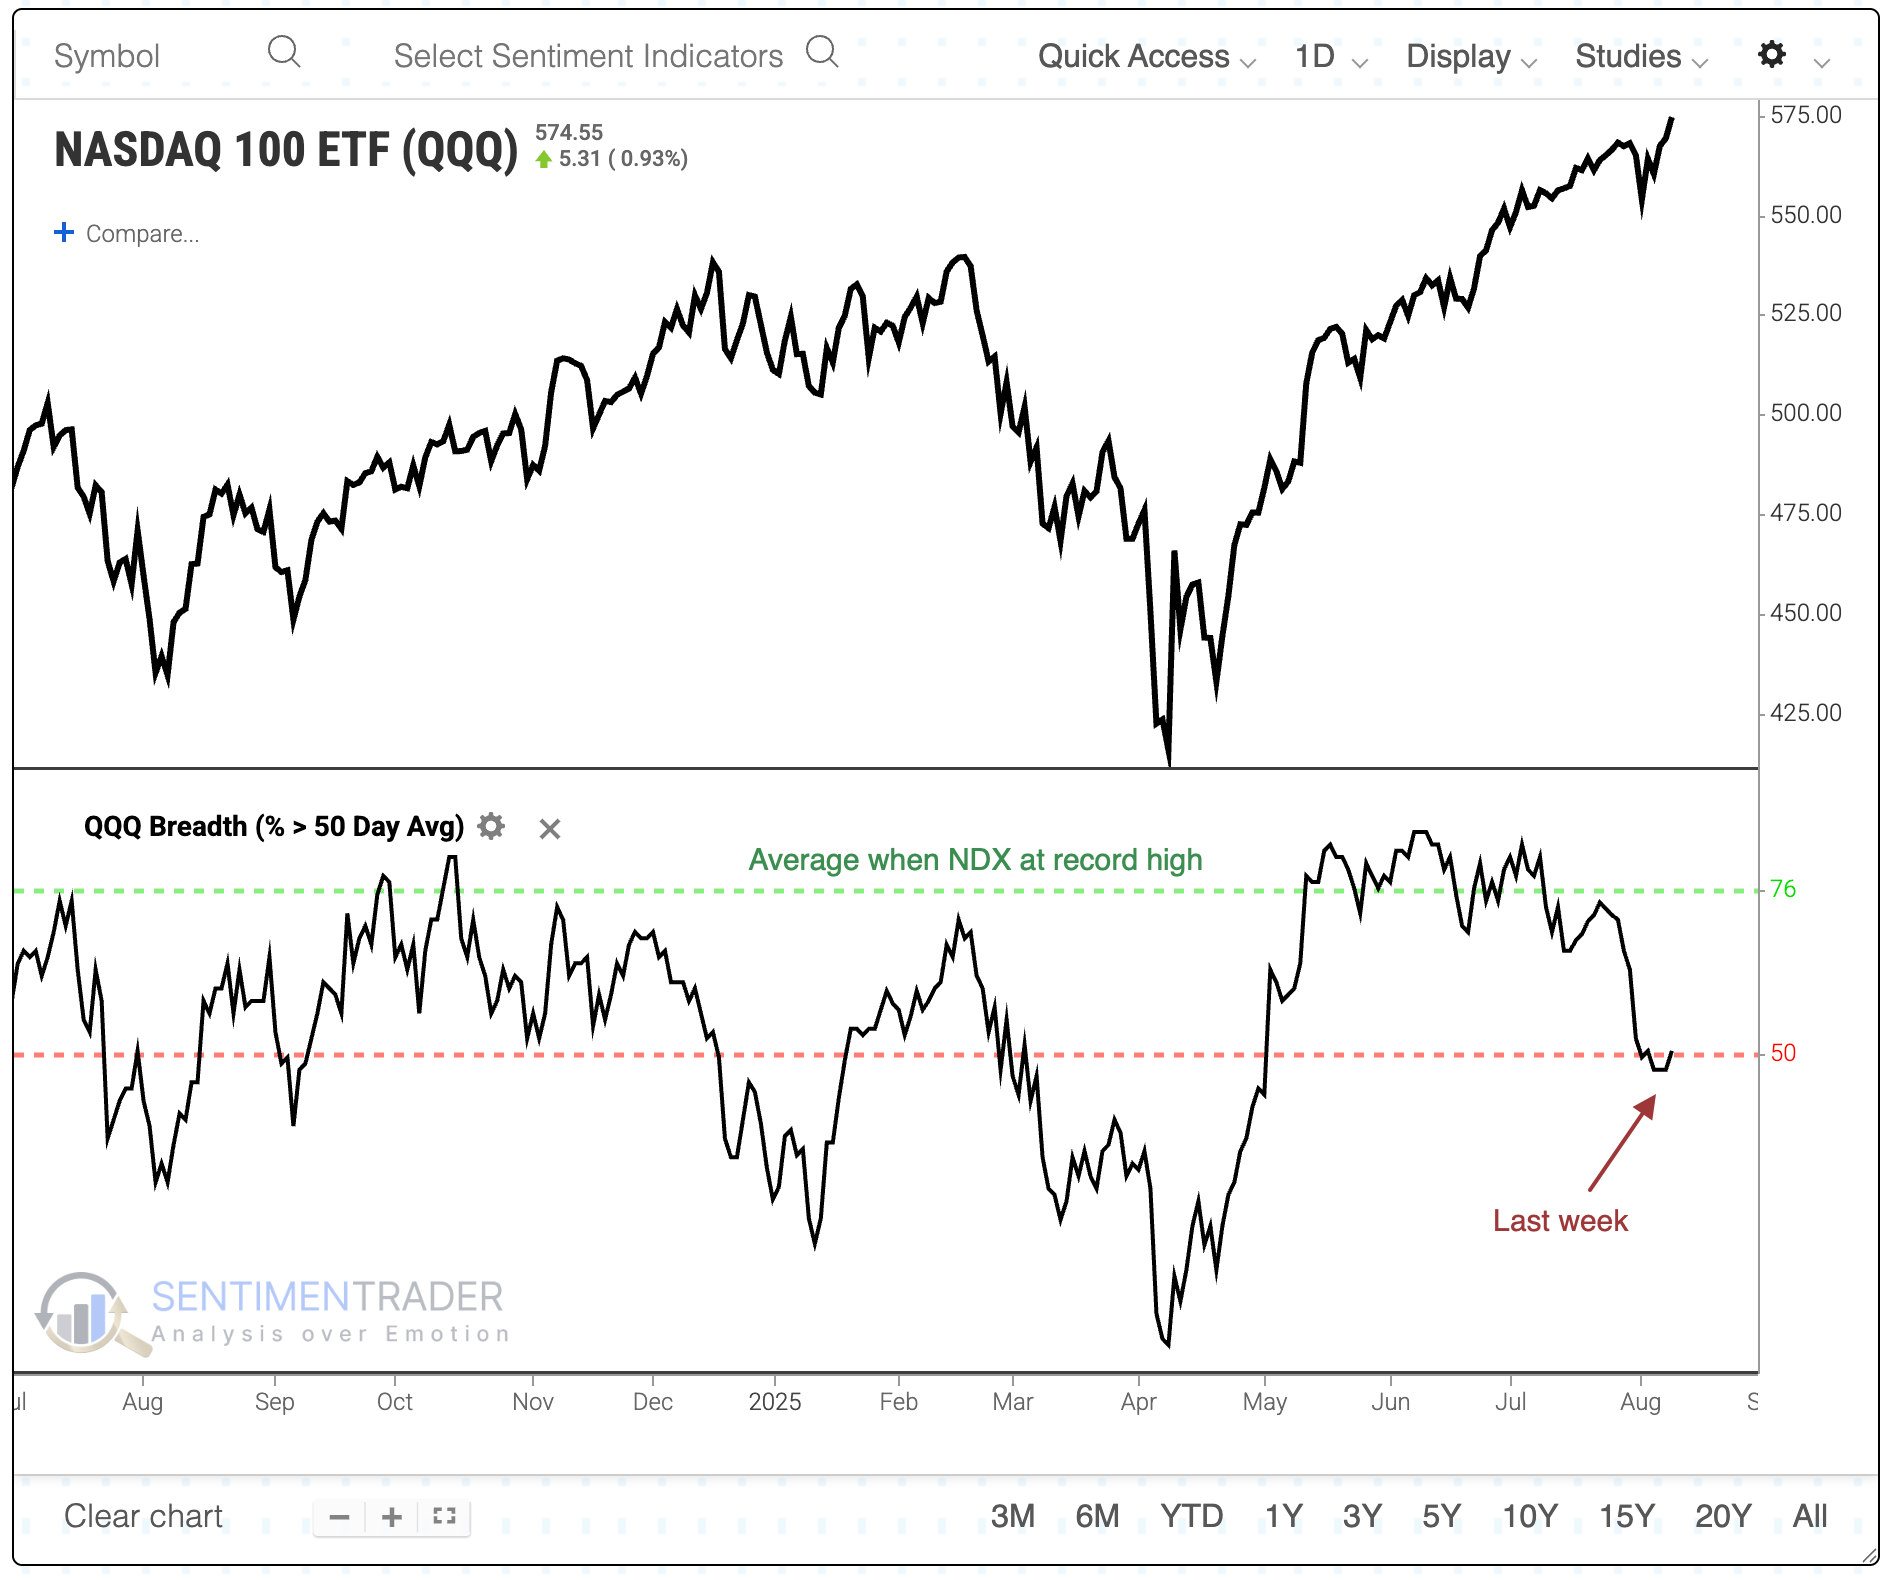
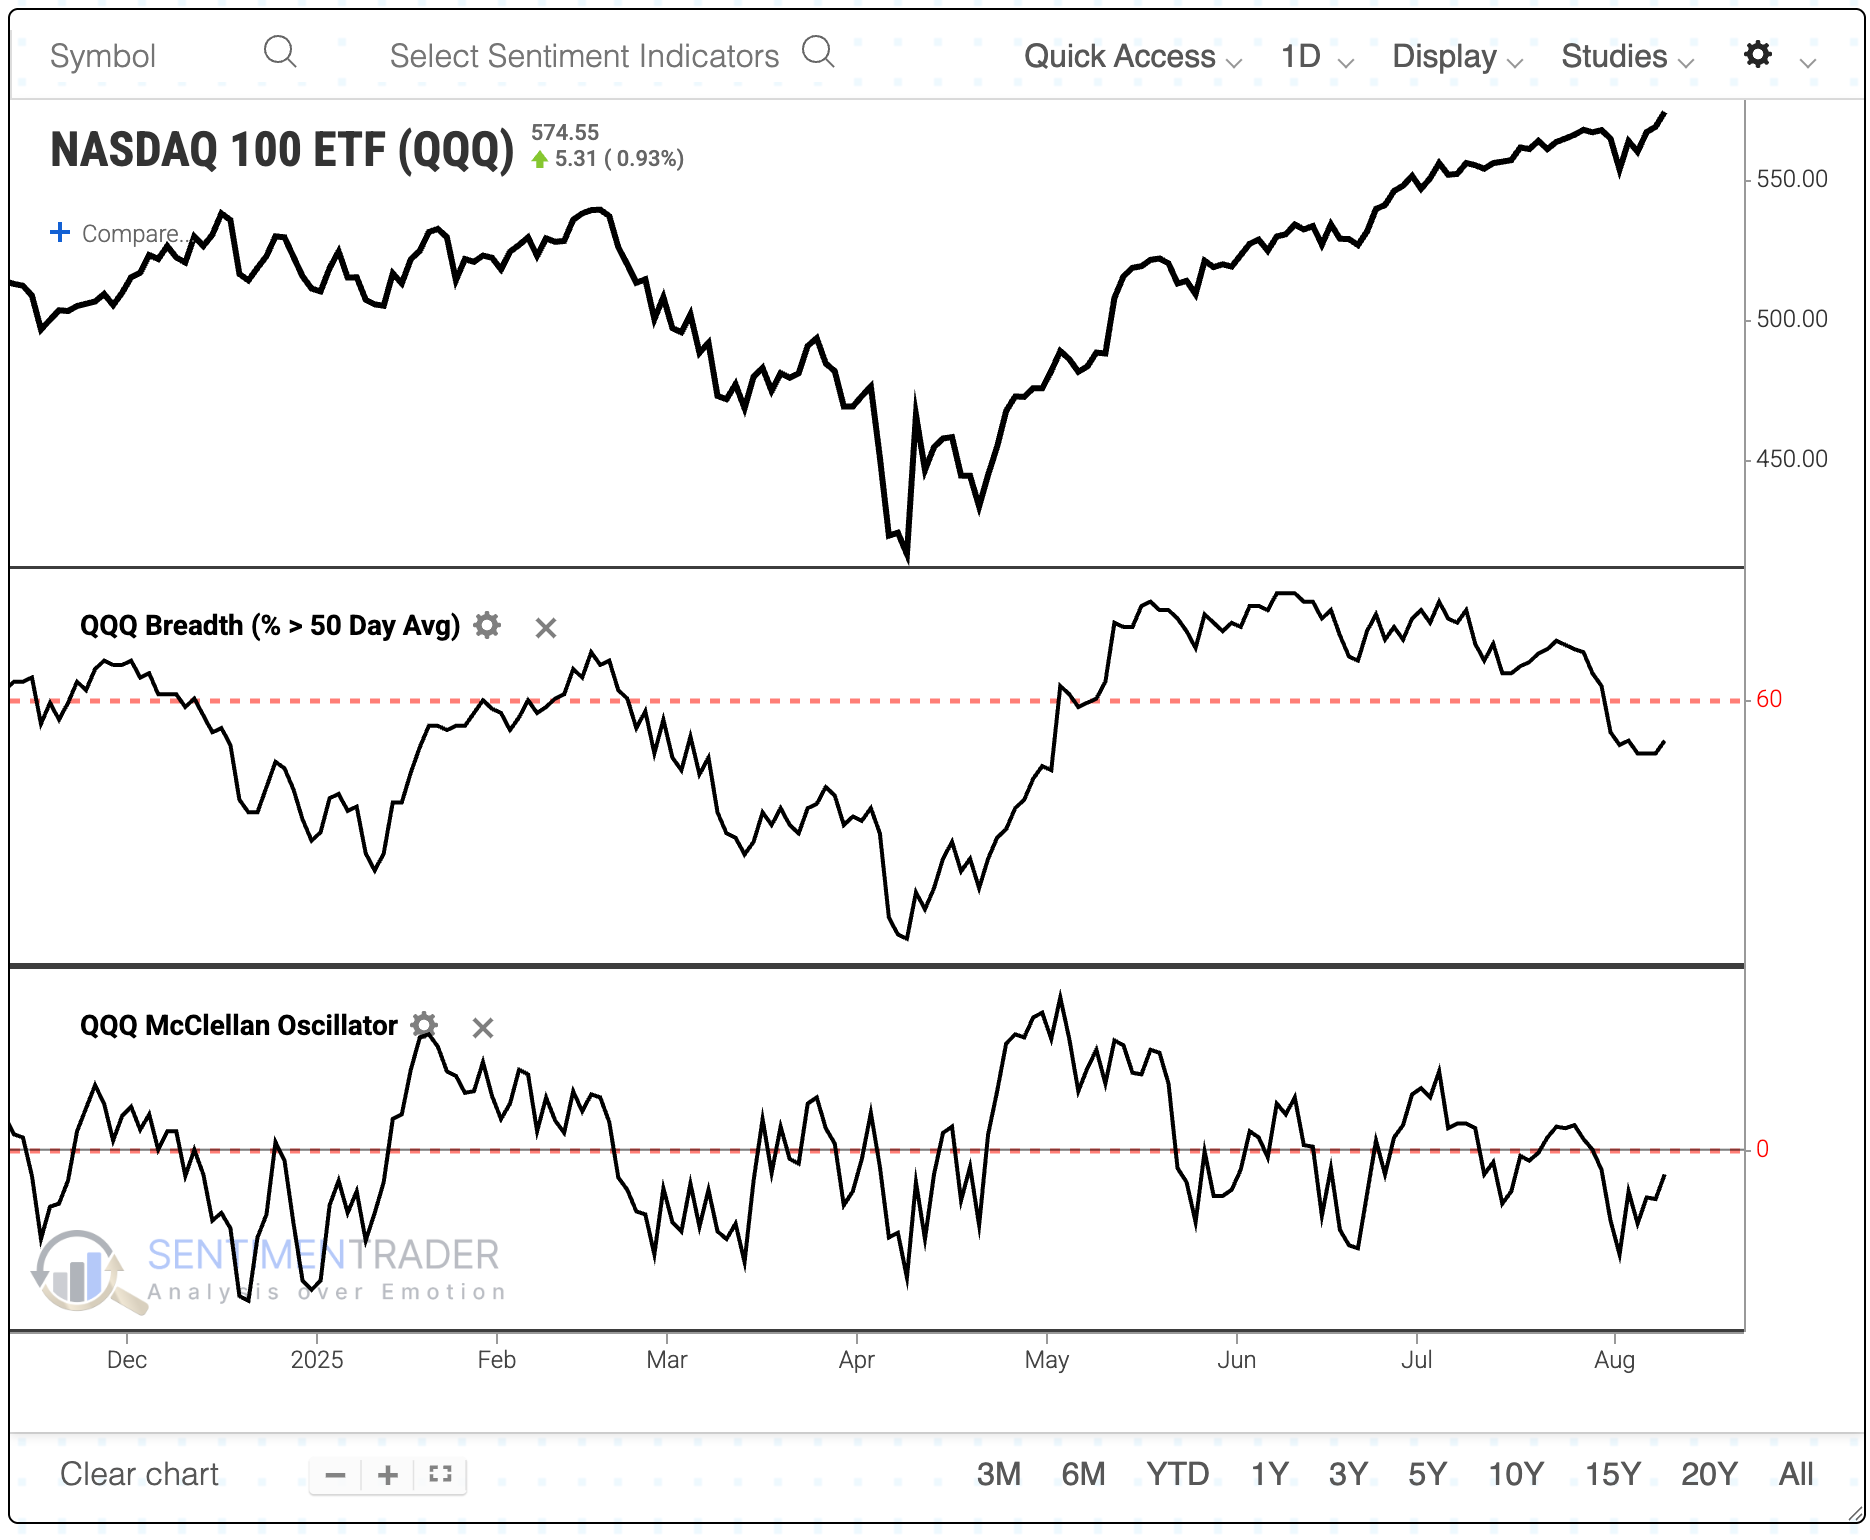
- Last week, the Nasdaq 100 closed at a record high, with fewer than half of its stocks above their 50-day moving average
- It was the weakest reading in 40 years, and far below a typical record-setting day in that index
- The Nasdaq 100 and S&P 500 tended to show consistently weak short-term returns after poor internal participation
Where are the uptrends at?
Stick around for a little while in this business, and you'll see something you've never seen before. Stick around for a while longer, and you'll see something nobody has seen before.
Like now.
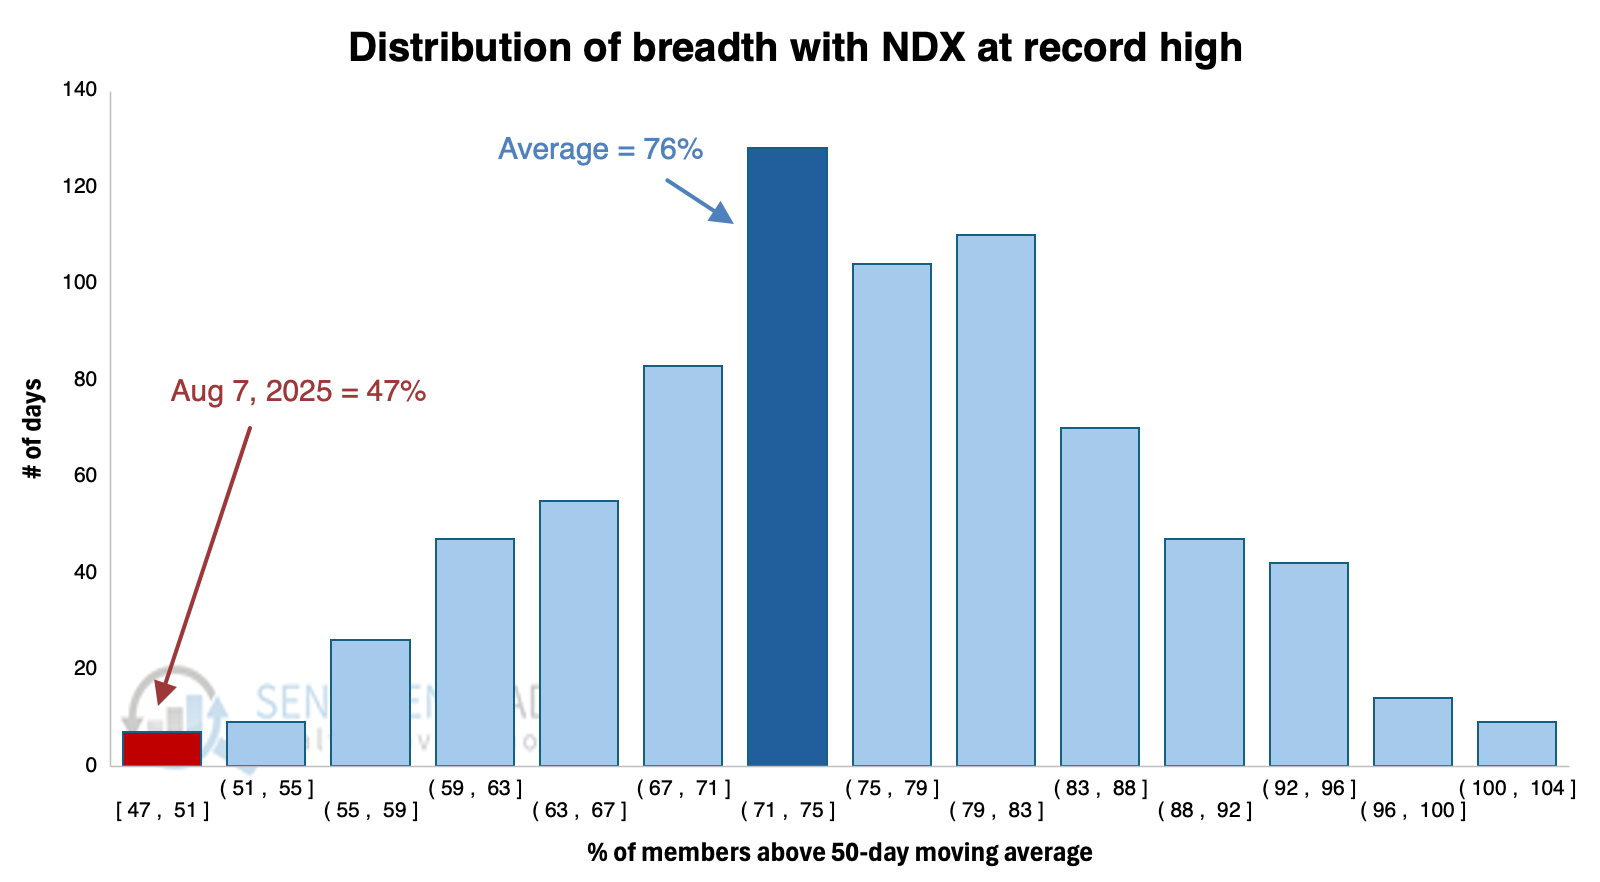
For the first time since its inception, the Nasdaq 100 (NDX) closed at a record high with less than 48% of its members trading above their 50-day moving average. Over the past 40 years, an average of 76% of the index members were above their 50-day average when the NDX reached a new high.
The distribution of readings shows just how isolated last week's readings were compared to all other days when the index closed at a record high. Out of 751 days when the NDX set a record, only 6 days recorded less than 50% of members above their 50-day average. Two of those days occurred at the end of last week.
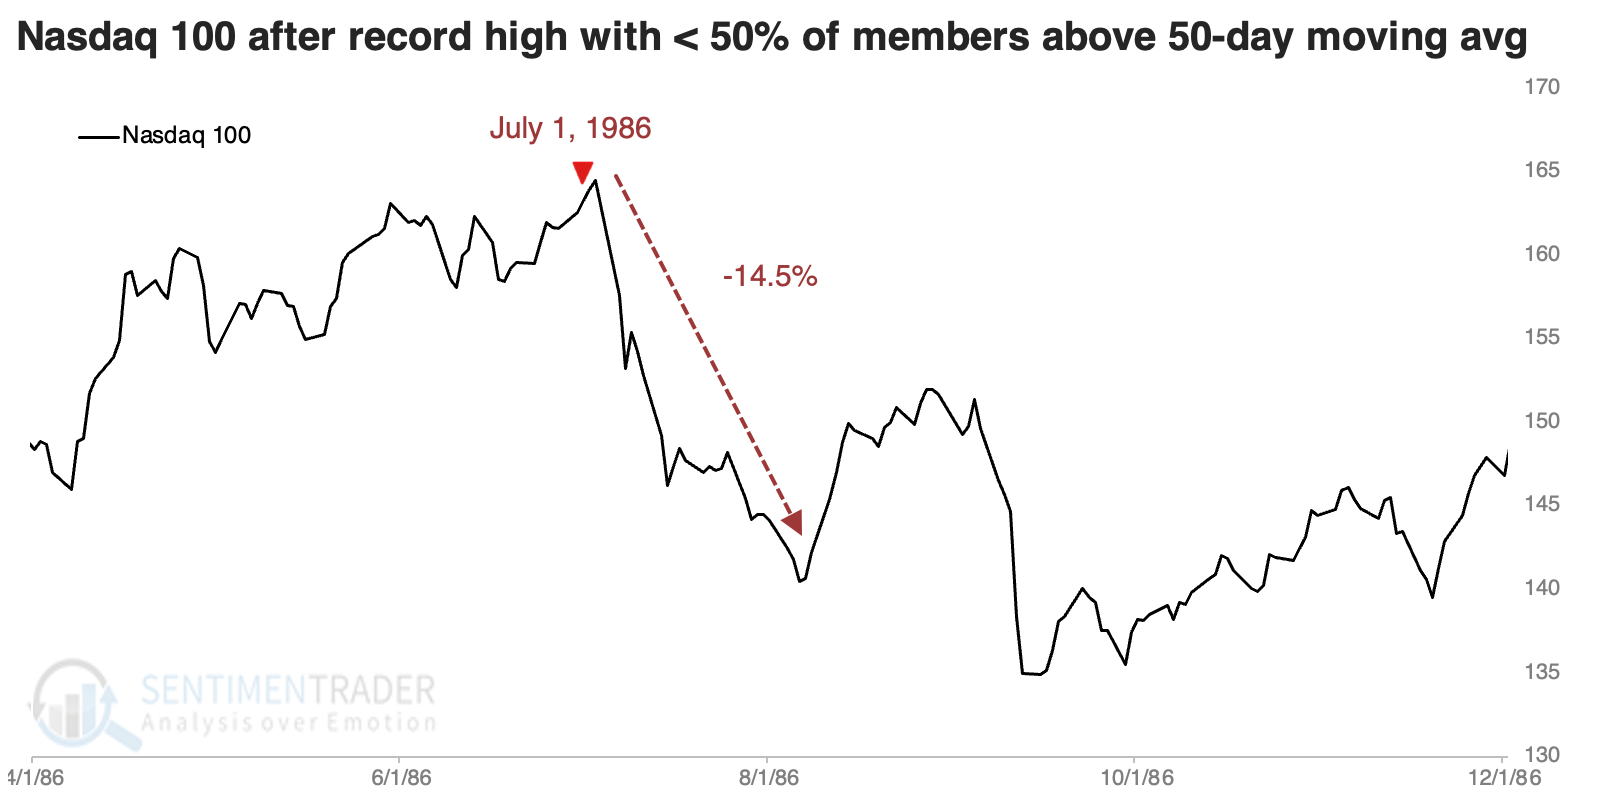
Only two other unique periods have seen the NDX close at a record high, with fewer than half its member stocks trading above their 50-day average. The first was in July 1986, which essentially marked the peak for that move. We have high confidence in the past 20 years of data, medium confidence in the decade before that, and low confidence in the years before that.
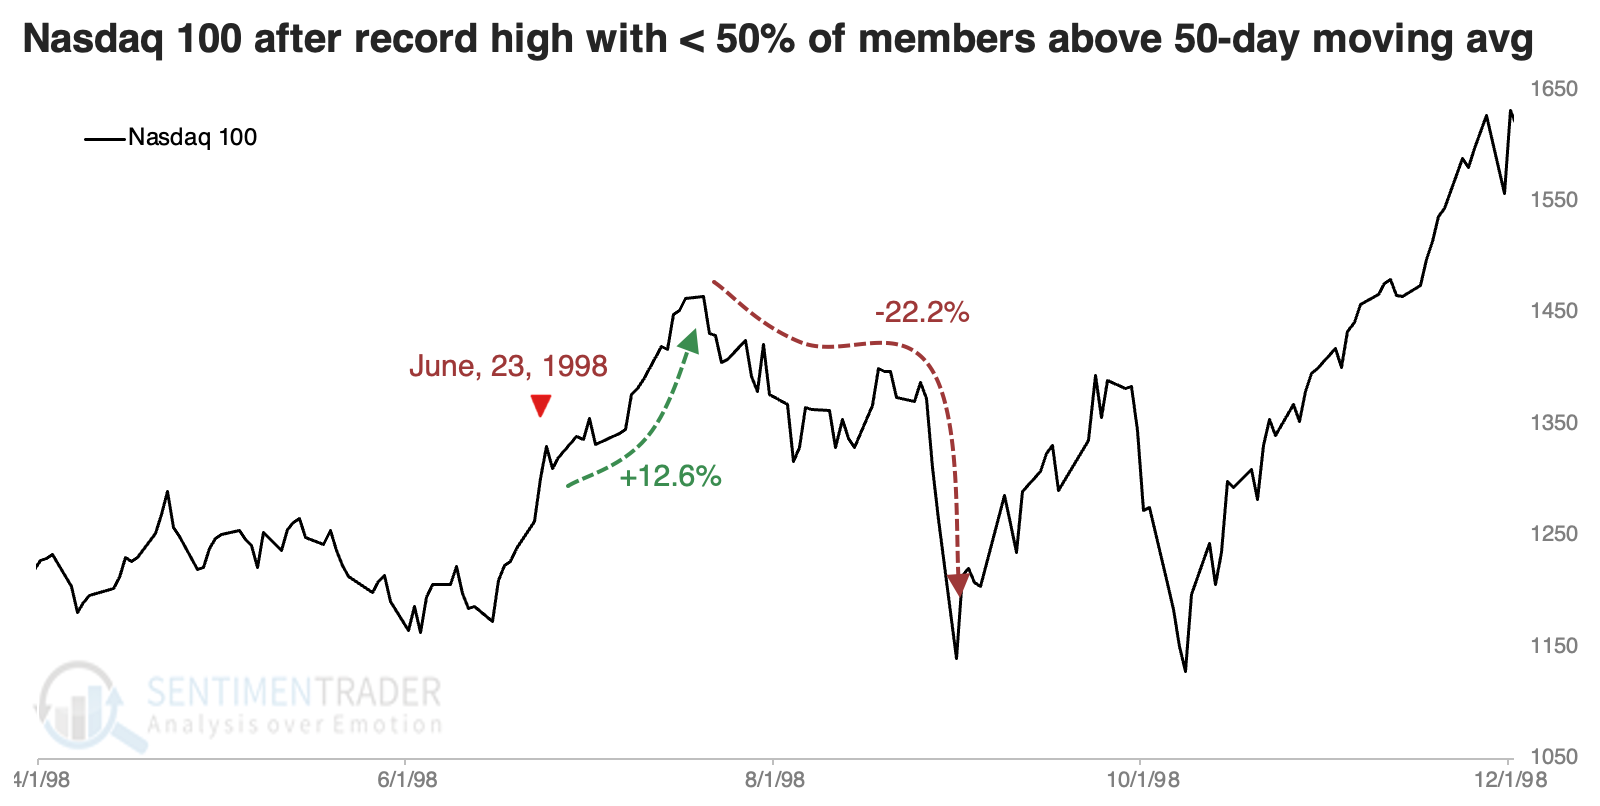
The other occurred in June 1998, which saw the NDX soar over the next few weeks, before more than erasing those gains in the following month or so.
Generally weak conditions
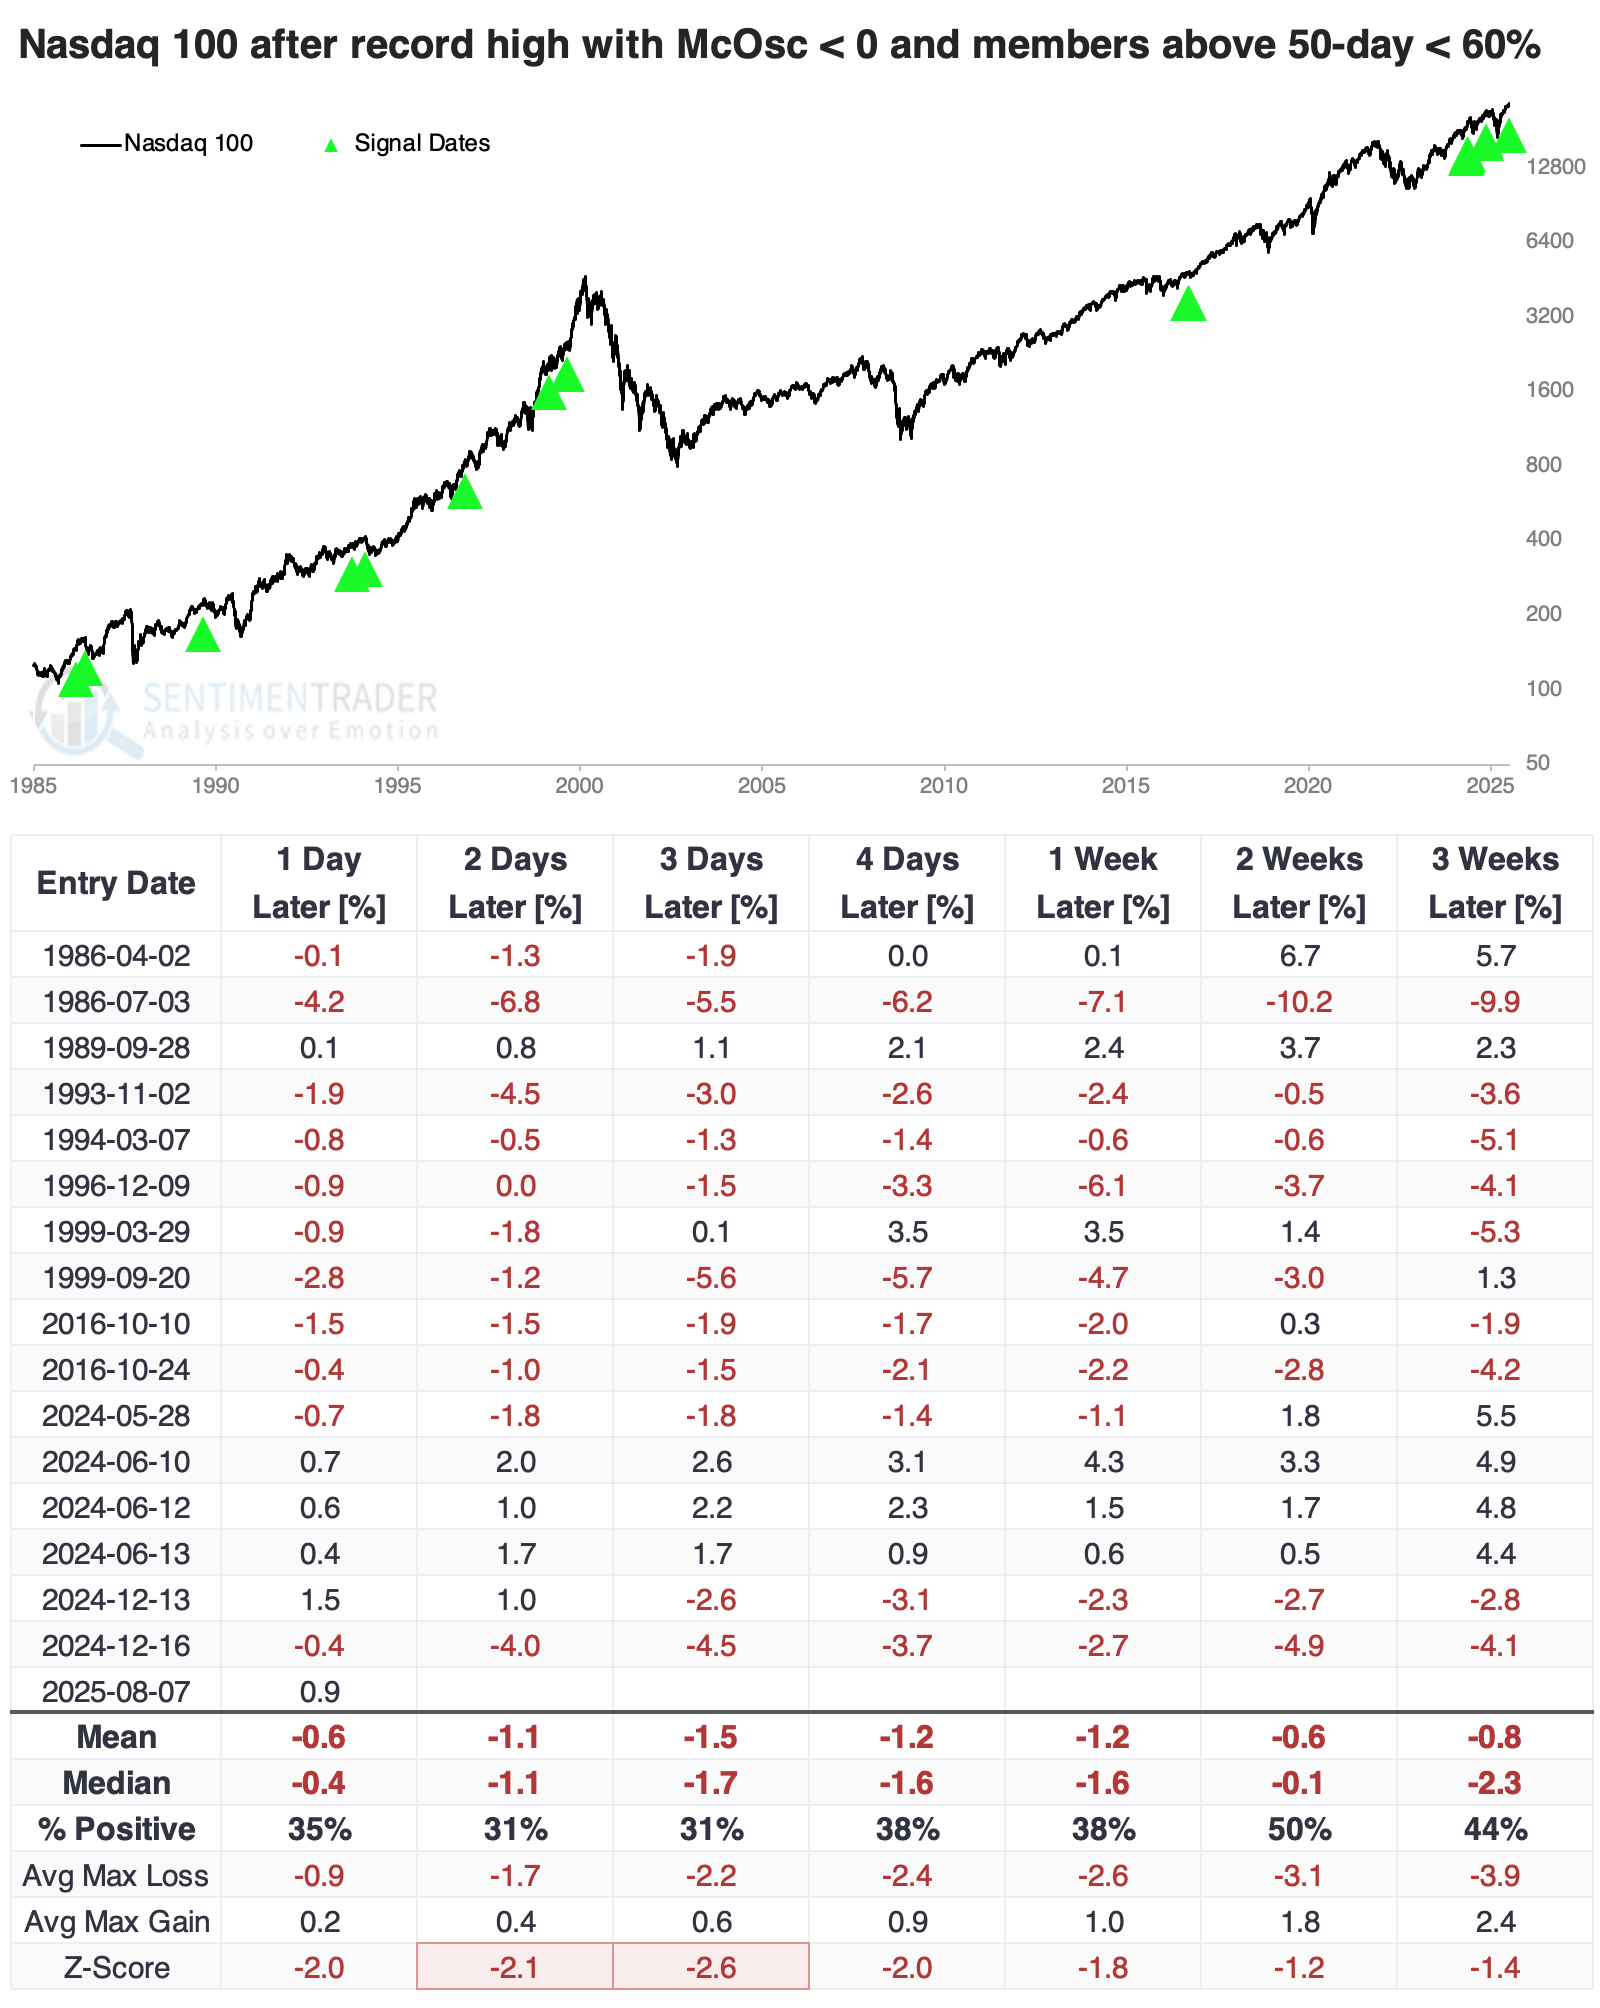
We have to relax the parameters with so few precedents upon which to rely. To balance a larger sample while trying to maintain the context of internally weak participation, we'll look for times when the NDX reached a record high with less than 60% of members above their 50-day average and the index's McClellan Oscillator was below zero.
These were not great signs for big tech stocks on a short-term basis. The table below shows all the dates when these conditions existed, so there is some overlap in the results. However, sometimes it's helpful to see when clusters exist, such as in 2024. There was a heavy drag on returns up to three weeks later.
Investors vs. traders
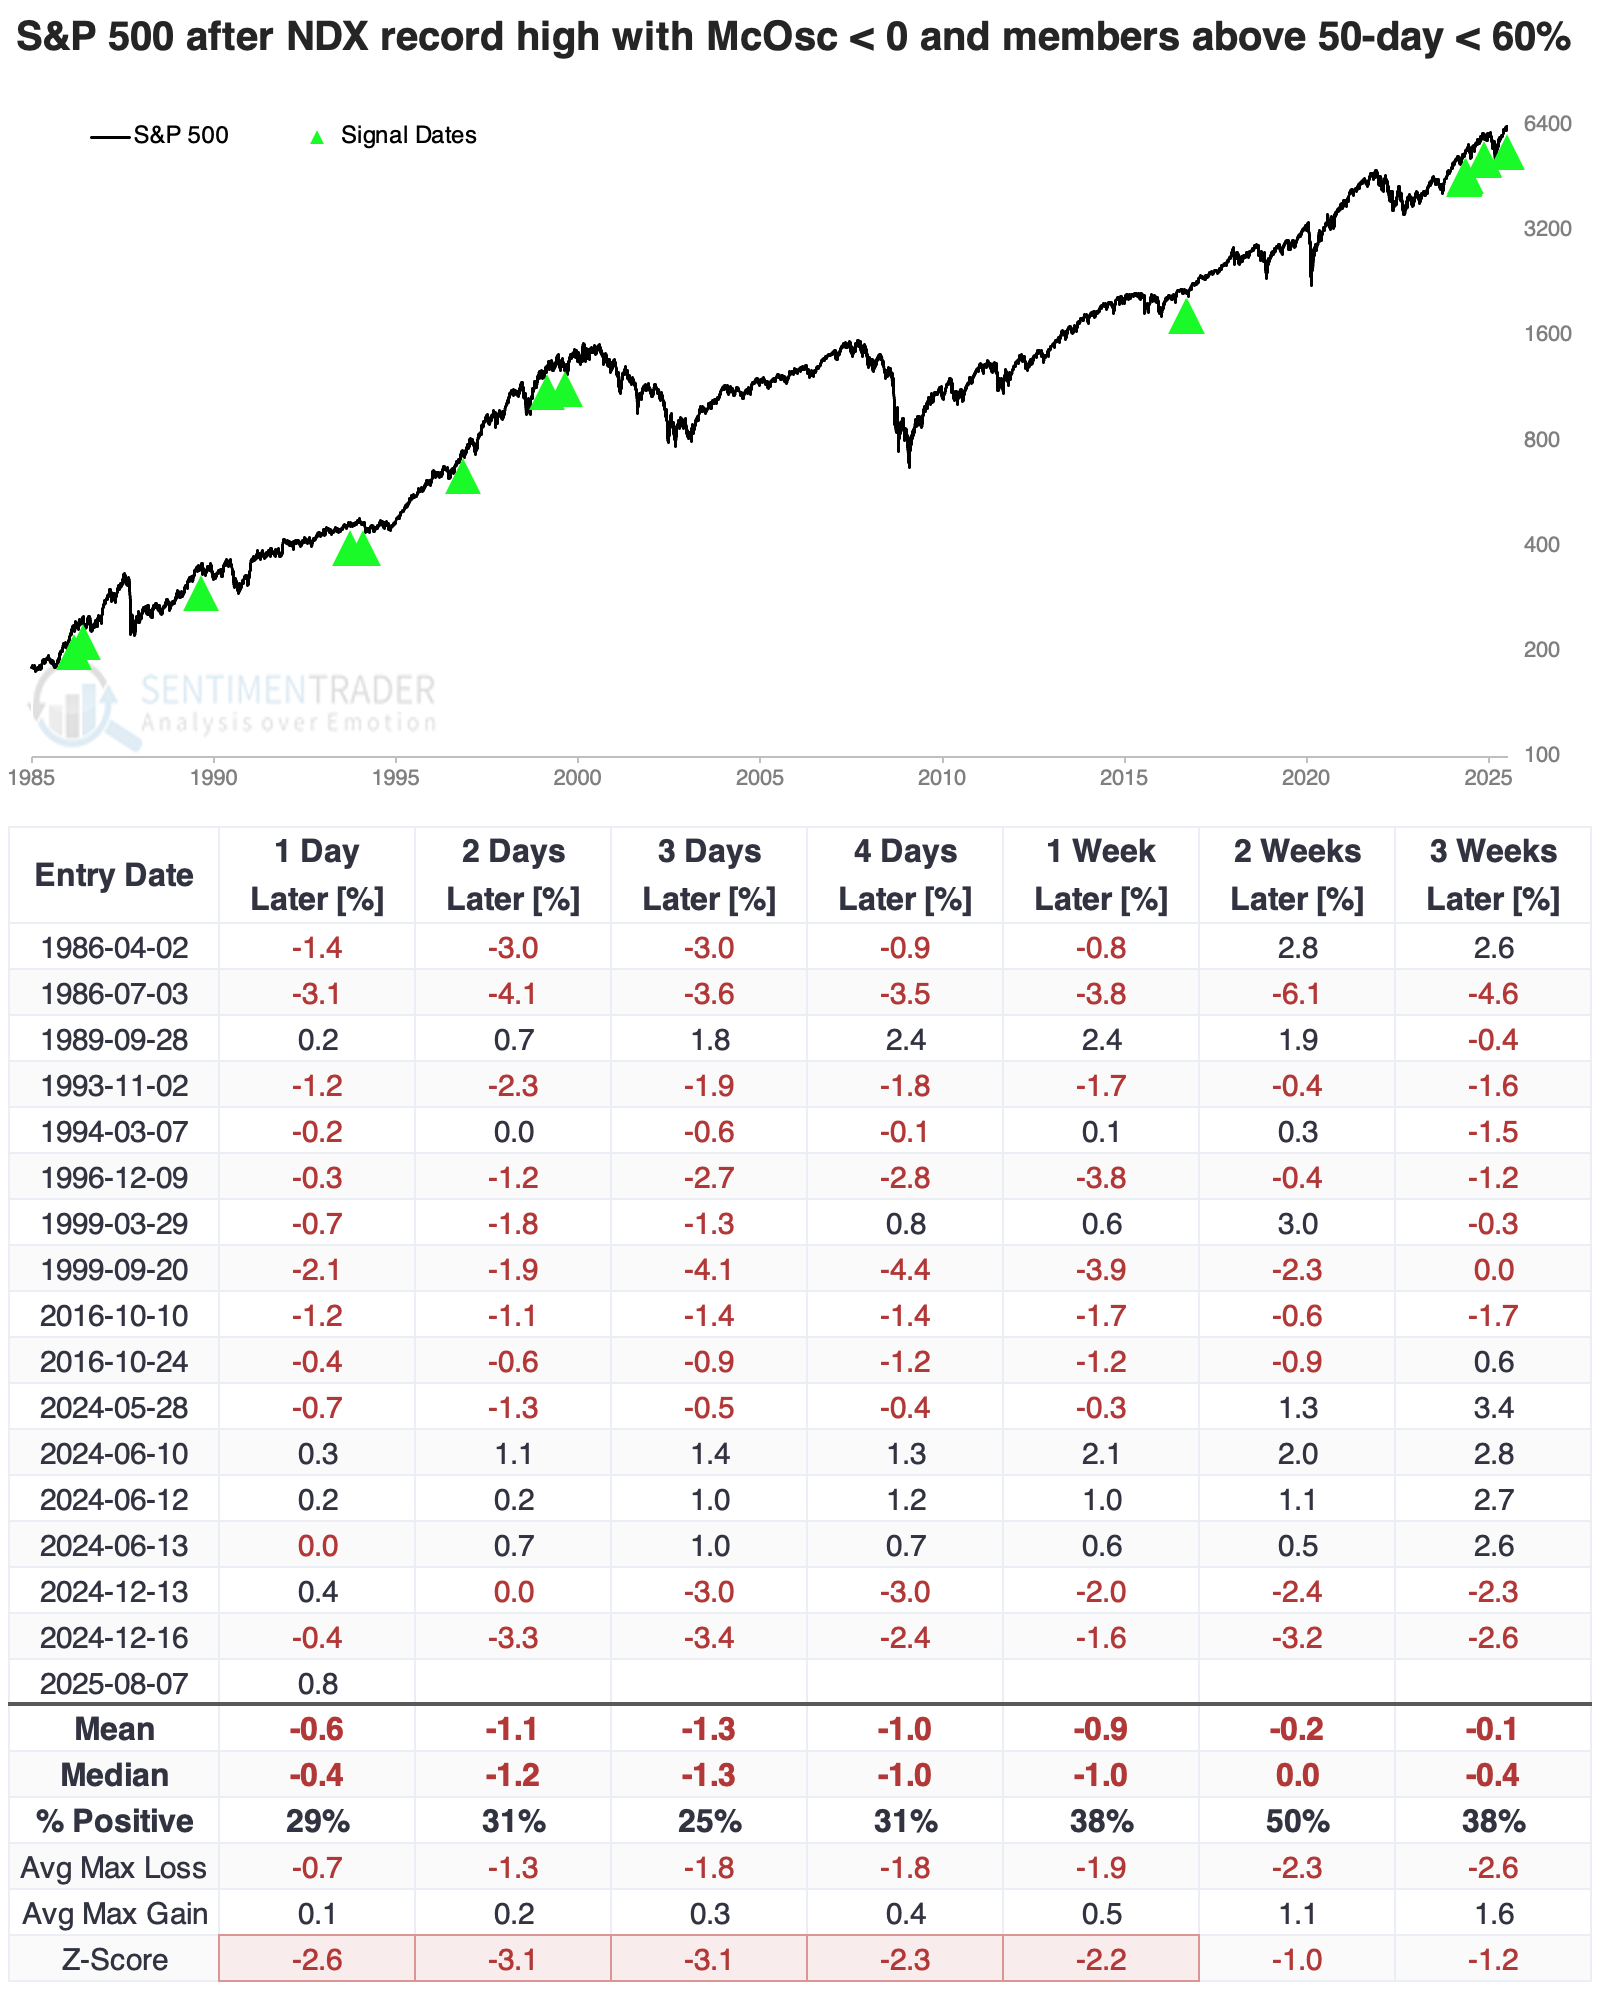
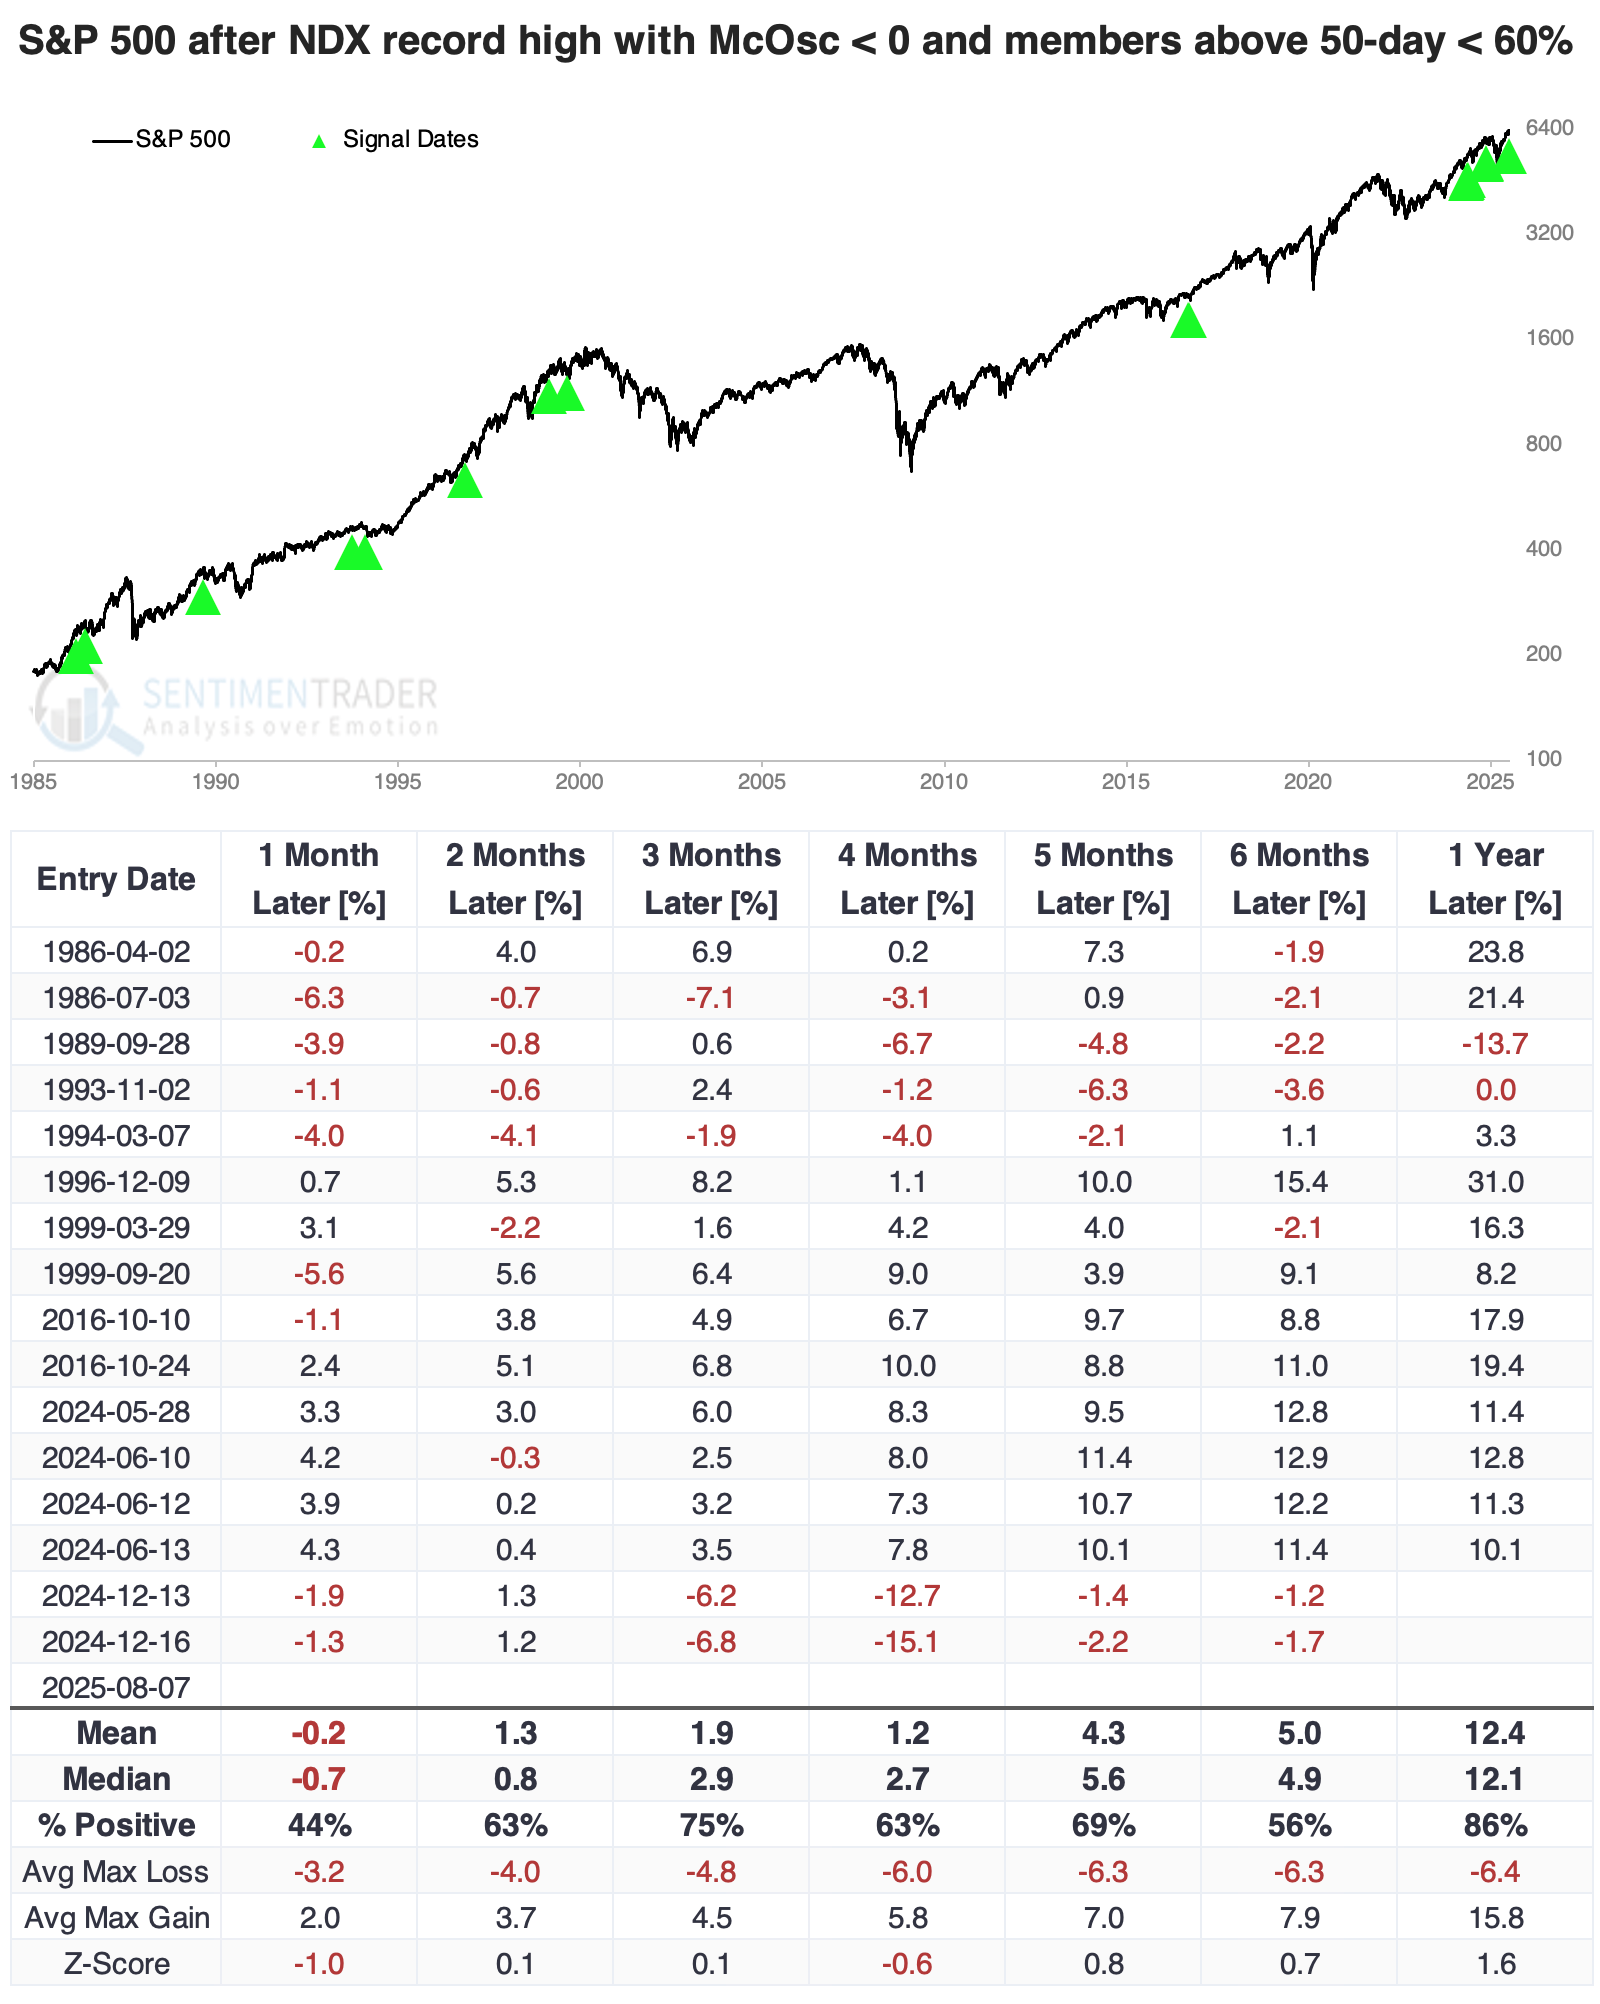
The weakness in big tech was an even larger drag on the broader S&P 500 index. Even a few weeks later, the unusually poor participation in the NDX dragged on the S&P's returns.
Of more concern to investors rather than traders, the weakness in the NDX tended to persist for a while, with poor returns up to a few months later. There were exceptions, with the signals in 1999 preceding the blow-off peak that took months to unfold, and 2016, which quickly righted itself and suffered no ill effects.
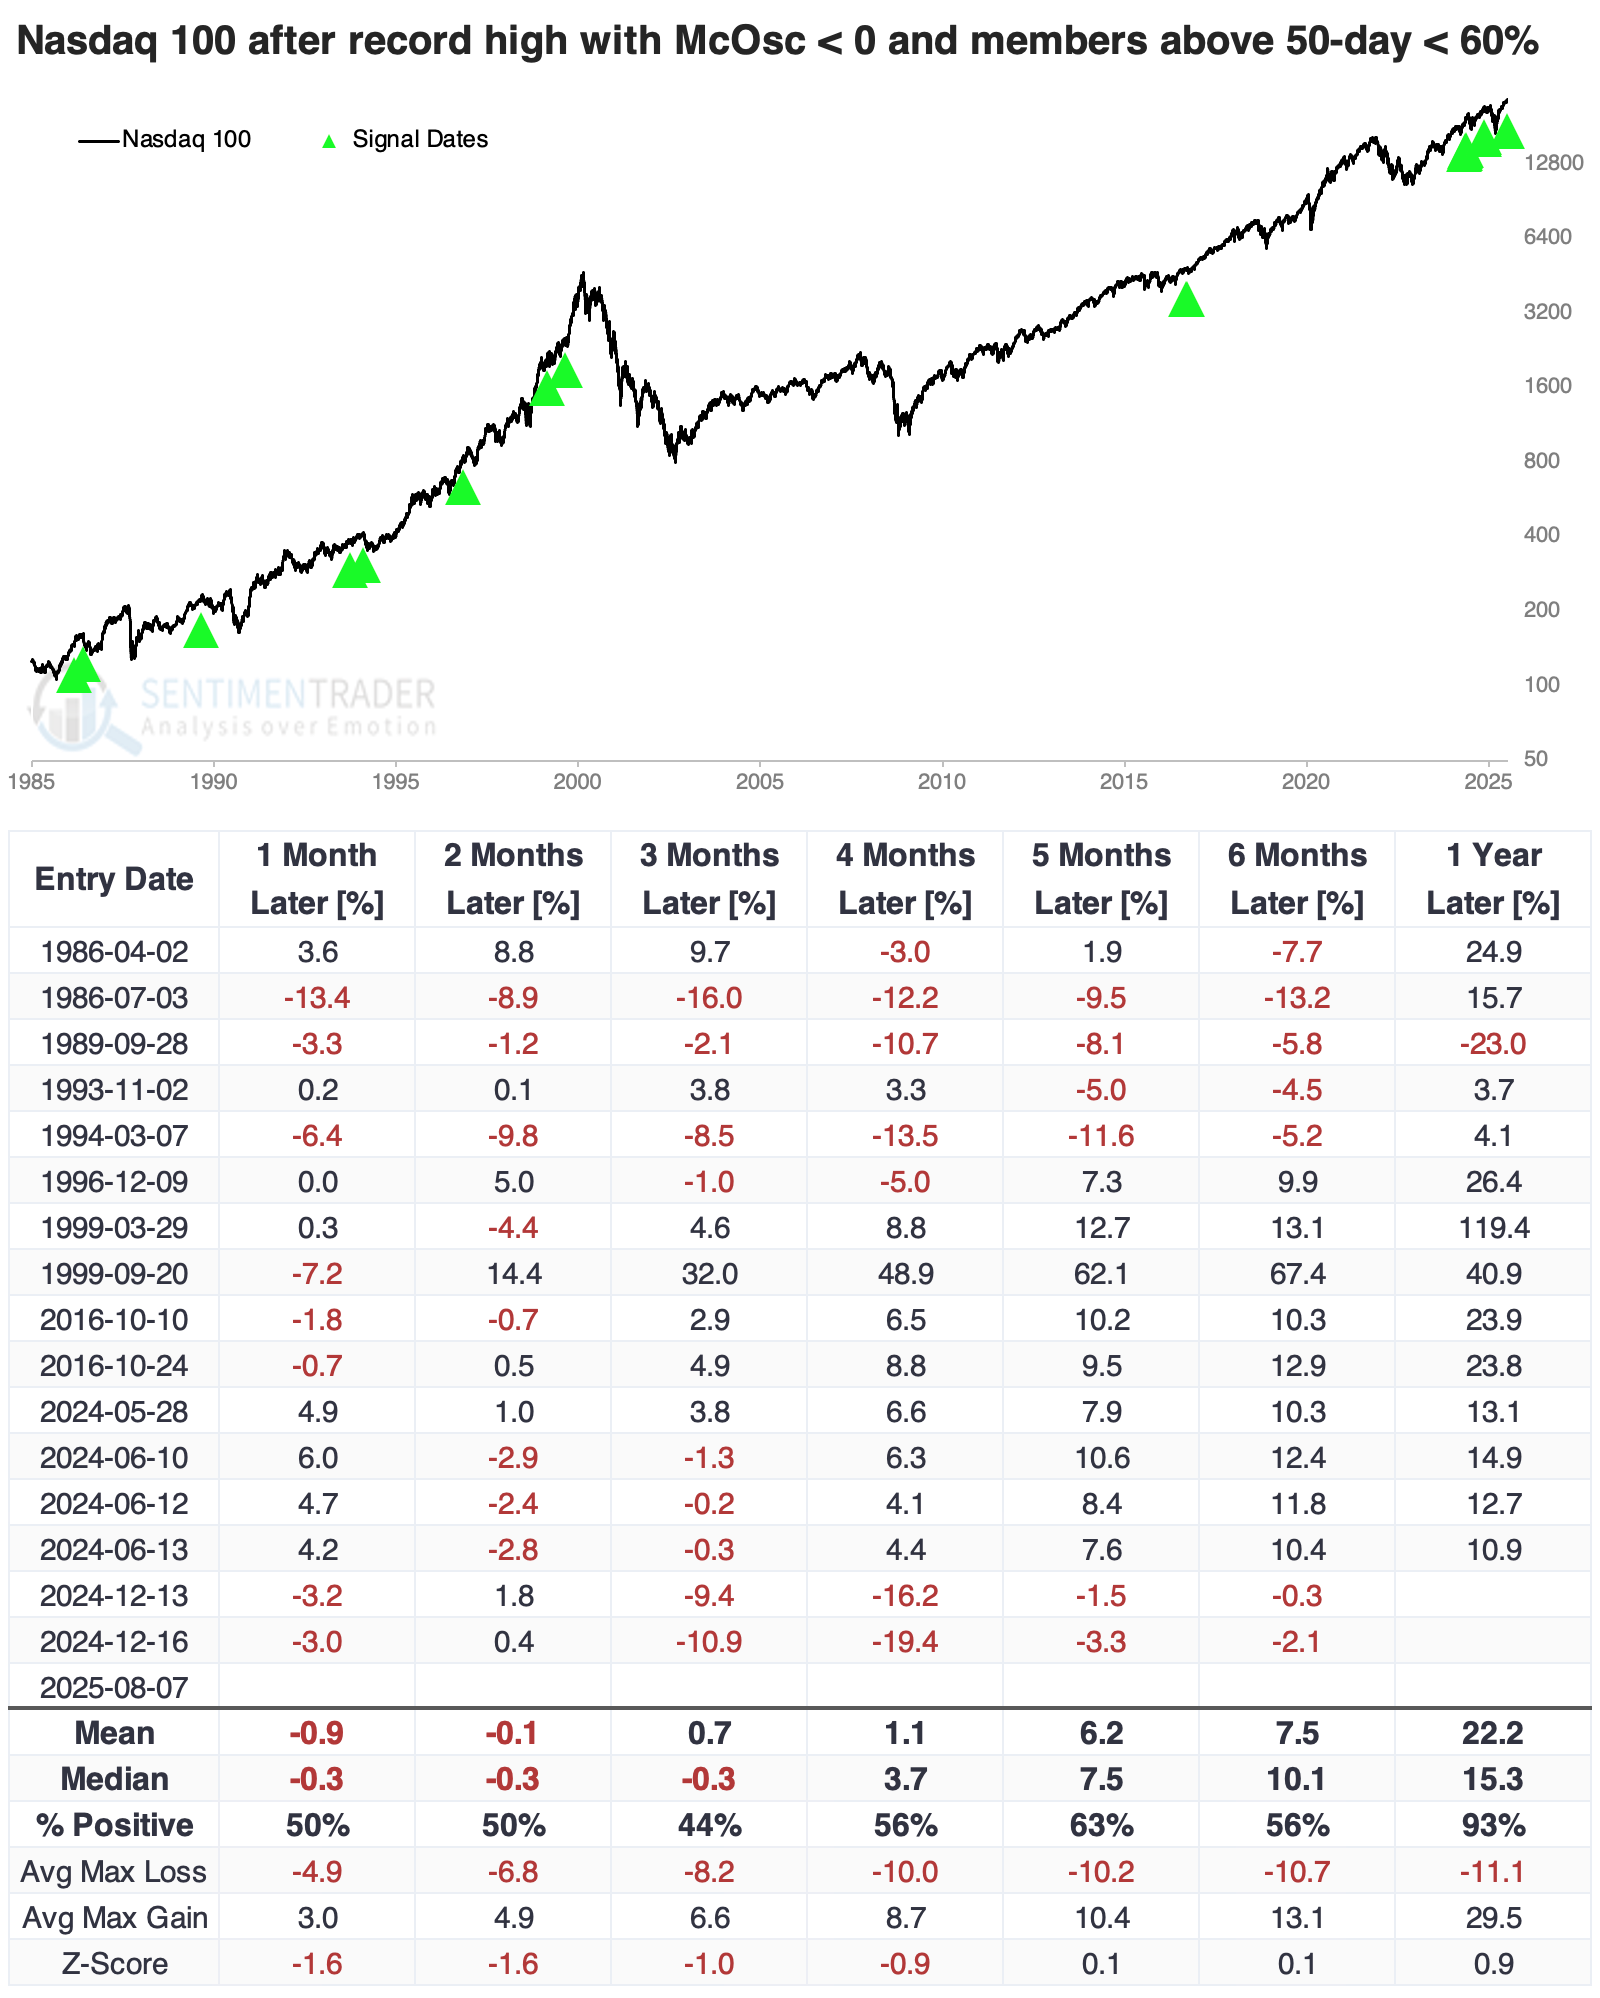
The S&P shrugged off the weak readings even better than the NDX, with a 75% win rate over the next several months. For the broader market, the weak participation in the NDX tended to have only very short-term consequences.
What the research tells us...
Every once in a while, indices can shrug off poor participation among their member stocks. That is not the base case, however. The typical response is that a top-heavy index will struggle after being driven by outstanding performance in relatively few stocks. The time frame can be inconsistent, which is frustrating.
Most often, if there's going to be weakness, it occurs immediately. Sometimes, like in early June 2024, buyers push ahead anyway, and the weakness gets pushed back. At those times, the early gains typically get wiped out during a subsequent pullback. Regardless, conditions like we witnessed at the end of last week are relatively dangerous for short- to intermediate-term positions, especially in top-heavy indices like the Nasdaq 100 and capitalization-weighted S&P 500.