Data &
Technology
Research
Reports
Report Solutions
Reports Library
Actionable
Strategies
Free
Resources
Simple Backtest Calculator
Simple Seasonality Calculator
The Kelly Criterion Calculator
Sentiment Geo Map
Public Research Reports
Free Webinar
Pricing
Company
About
Meet Our Team
In the News
Testimonials
Client Success Stories
Contact
Log inLoginSign up
< BACK TO ALL REPORTS

A Record Breaking Half for Fund Flows

Jason Goepfert
2021-07-07
There has been a flood of money into equity mutual funds and ETFs over the past 6 months, the most ever for the first half of a year. As a percentage of stocks' market cap, the inflows aren't nearly as extreme but still high enough to show poor forward returns.

Stocks keep hitting records, there hasn't been even a pullback for six months, and investors are feeling good. And what do investors do when they're feeling good? Why, they add to their bets, of course.

Through June, equity mutual funds and ETFs have taken in more than $122 billion in assets, according to Lipper. That's the best first half for flows in almost 20 years. The only first half that exceeds this flow, in or out, was the pandemic-inspired outflow last year.

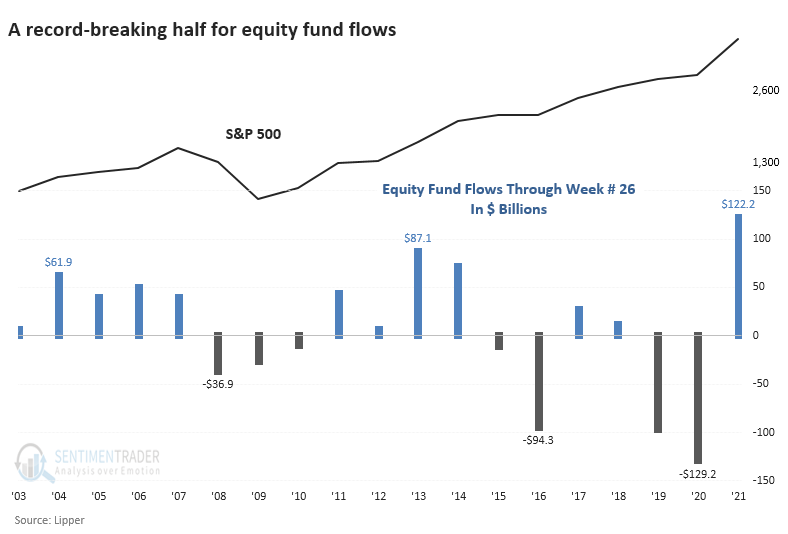
This is a bit restrictive since it's only looking at flows through the first half of each year, but it's still more extreme than any other 6-month stretch in 20 years.

A LOOSER LOOK AT FLOWS

If we remove the calendar and just look at every rolling 6-month period, we're still seeing a record flow. While it exceeds the prior record from 2013, it only reverses some of the outflows from 2019 - 2020.

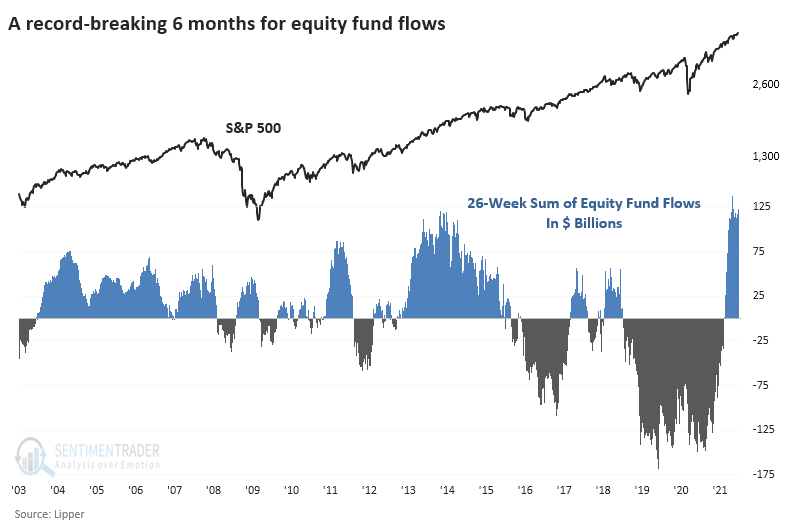
This is also a bit misleading because it ignores the fact that the overall size of the market has grown.

HIGH FLOWS = LOWER RETURNS

When we adjust fund flows for the total market capitalization of the U.S. stock market, then the past six months don't seem to be as much of a driver as other periods. It's less than half the extremes reached in 2003, 2011, and 2013.

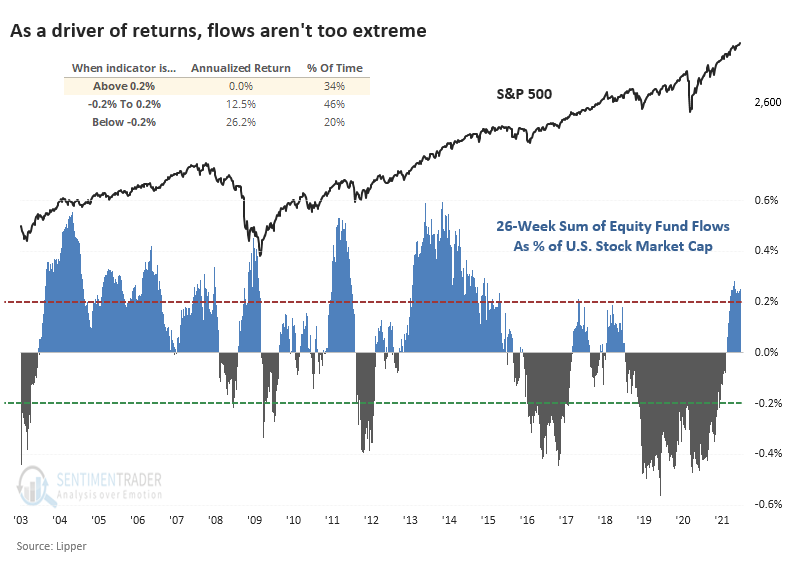
Still, there was a consistent contrary nature to investors' behavior. The higher the flow, the lower the S&P 500's annualized forward return. When it exceeded 0.2% of market cap, which it currently is, then the S&P 500's annualized future return was perfectly flat. That's far below the other periods when flows were less extreme or (especially) when there was an extreme outflow.

The biggest thing stocks have going for them is long-term momentum. There have been some shorter-term signs of internal deterioration, so that's a worry, as is the continued too-optimistic nature of sentiment. Fund flows are another sign that complacency is high enough to be a concern.

Sorry, you don't have access to this report

Upgrade your subscription plan to get access
Go to Dasboard
DATA &
TECHnologies
IndicatorEdge
‍
BackTestEdge
‍
Other Tools
‍
DataEdge API
RESEARCH
reports
Research Solution
‍
Reports Library
‍
actionable
Strategies
Trading Strategies
‍
Smart Stock Scanner
‍
FREE
RESOUrCES
Simple Backtest
Calculator
Simple Seasonality
Calculator
The Kelly Criterion
Calculator
Sentiment Geo Map
‍
Public Research Reports
‍
Free Webinar
COMPANY
‍
About
‍
Meet our Team
‍
In the News
‍
Testimonials
‍
Client Success Stories
Pricing
Bundle pricing
‍
Announcements
‍
FAQ
© 2024 Sundial Capital Research Inc. All rights reserved.
Setsail Marketing
TermsPrivacyAffiliate Program
Risk Disclosure: Futures and forex trading contains substantial risk and is not for every investor. An investor could potentially lose all or more than the initial investment. Risk capital is money that can be lost without jeopardizing ones’ financial security or life style. Only risk capital should be used for trading and only those with sufficient risk capital should consider trading. Past performance is not necessarily indicative of future results.

Hypothetical Performance Disclosure: Hypothetical performance results have many inherent limitations, some of which are described below. No representation is being made that any account will or is likely to achieve profits or losses similar to those shown; in fact, there are frequently sharp differences between hypothetical performance results and the actual results subsequently achieved by any particular trading program. One of the limitations of hypothetical performance results is that they are generally prepared with the benefit of hindsight. In addition, hypothetical trading does not involve financial risk, and no hypothetical trading record can completely account for the impact of financial risk of actual trading. for example, the ability to withstand losses or to adhere to a particular trading program in spite of trading losses are material points which can also adversely affect actual trading results. There are numerous other factors related to the markets in general or to the implementation of any specific trading program which cannot be fully accounted for in the preparation of hypothetical performance results and all which can adversely affect trading results.

Testimonial Disclosure: Testimonials appearing on this website may not be representative of other clients or customers and is not a guarantee of future performance or success.