
A rare week with uninterrupted technical warnings

Key points:
- The Titanic Syndrome technical warning was triggered on the NYSE every day for a week
- It has also triggered on the Nasdaq for 5 straight days, a rare cluster across exchanges
- Previous clusters of warnings have preceded poor returns for stocks, except for defensive sectors
A cluster of warnings
Investors have been willing to sell stocks en masse, pushing many to new lows soon after the major indices were sitting pretty at new highs.
Maybe it's just a temporary temper tantrum based on geopolitics or a re-rating of GDP growth or tariff threats. But maybe not. Maybe it's something deeper.
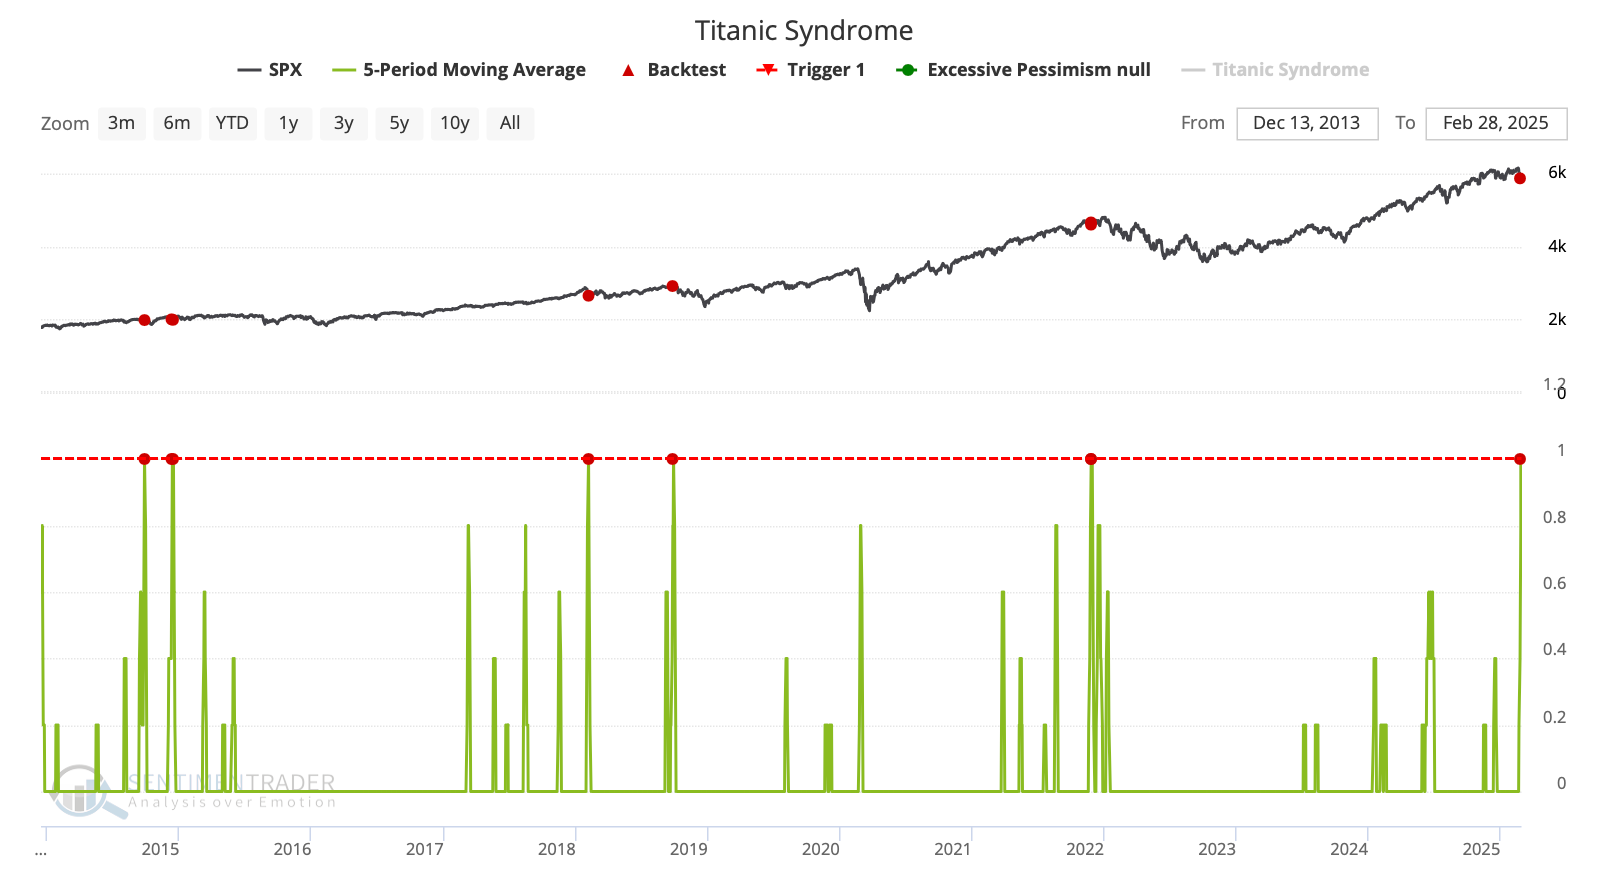
Some internal warning signals have fired due to the quick flip in sentiment - the Titanic Syndrome warning was triggered on the NYSE for five consecutive days before easing on Friday. Forget the stupid name of the indicator; it simply highlights a technical market condition when stocks have recently been at a high, and then there is a sudden jump in new 52-week lows versus highs on the NYSE.
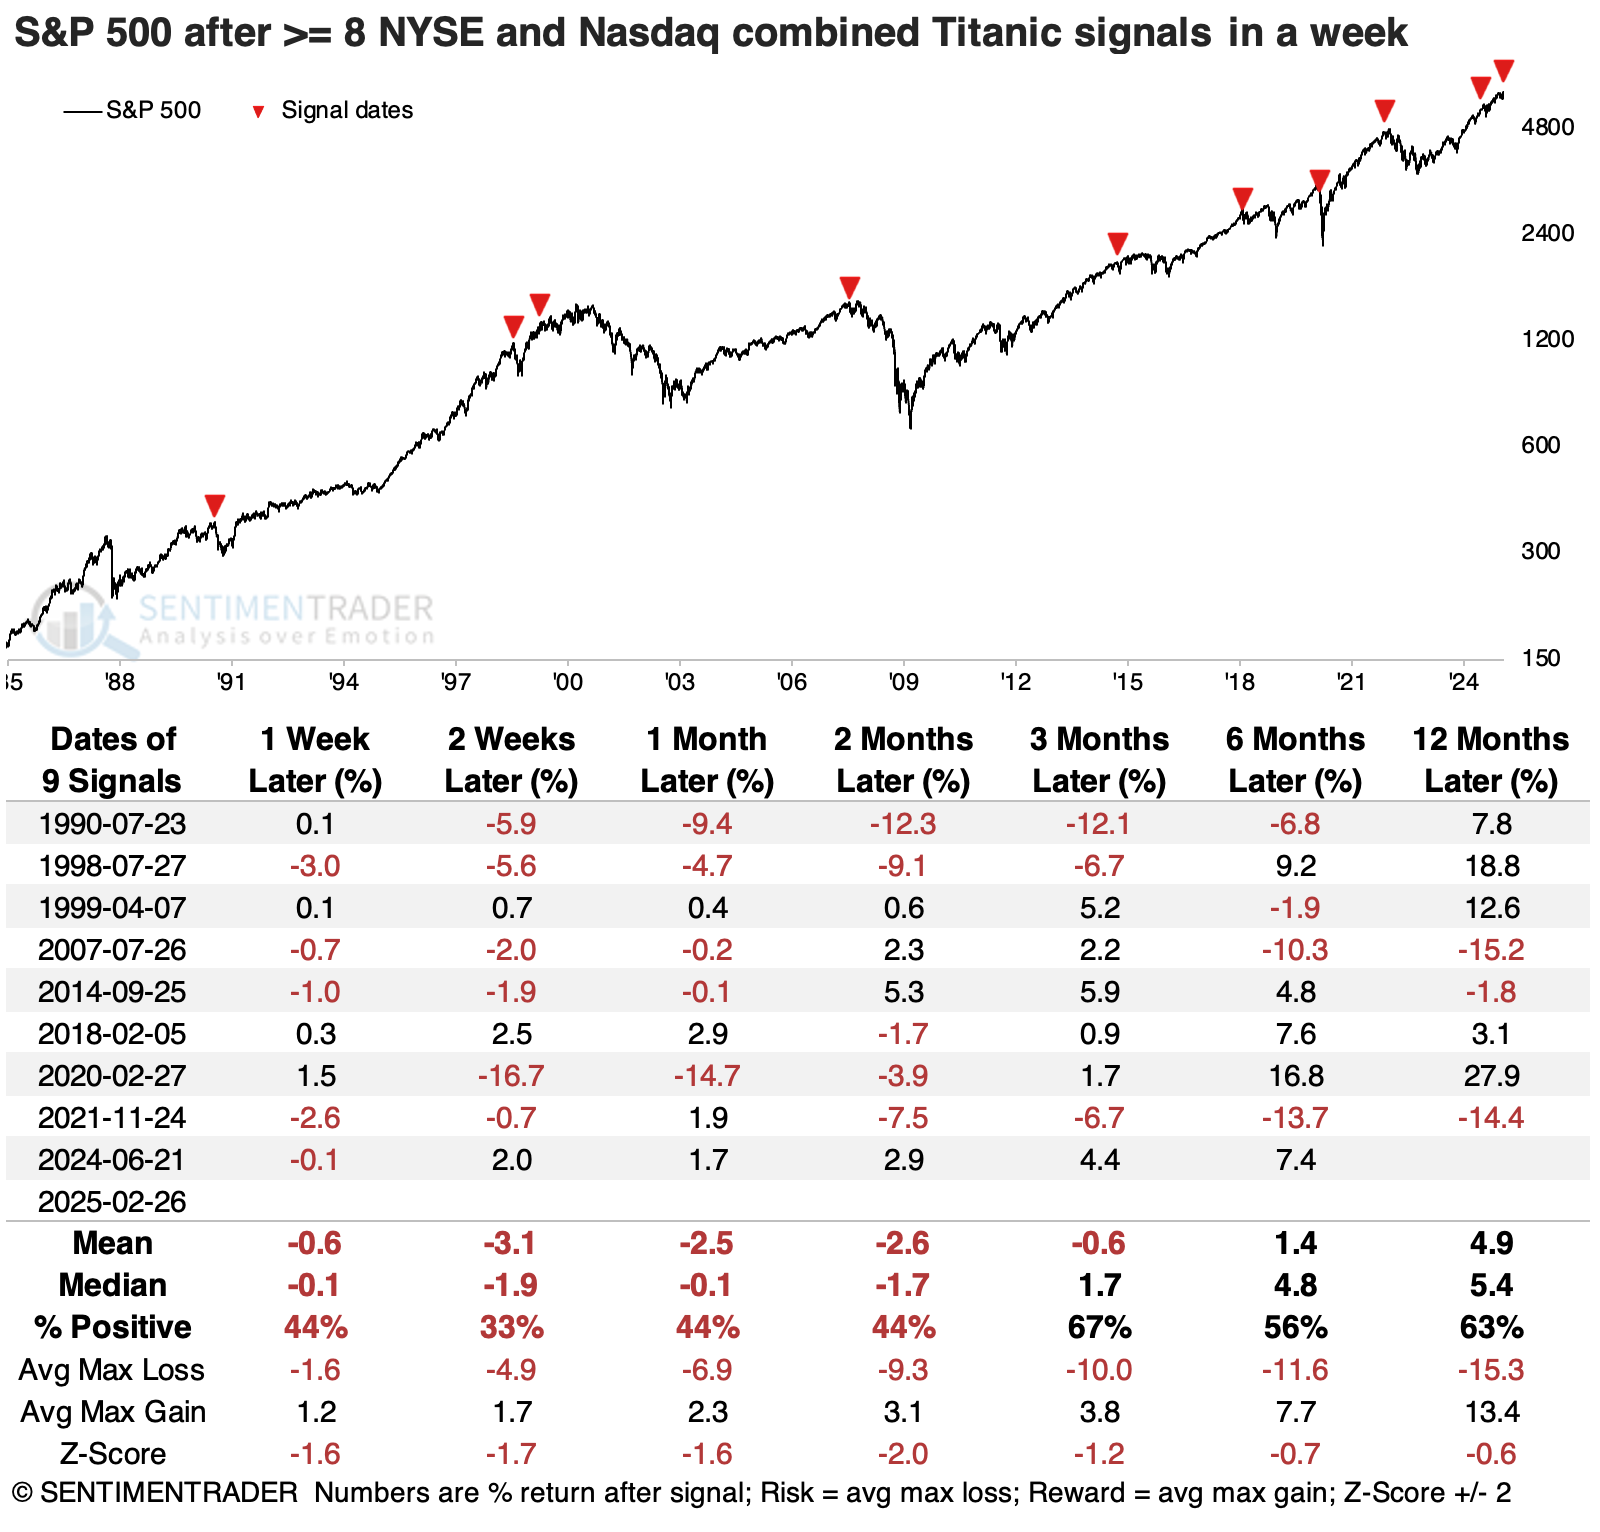
The chart below shows a 5-day average of the signals. If the average equals 1, it triggered every day for a week. We can see how rare it has been over the past decade; each time, it preceded trouble.
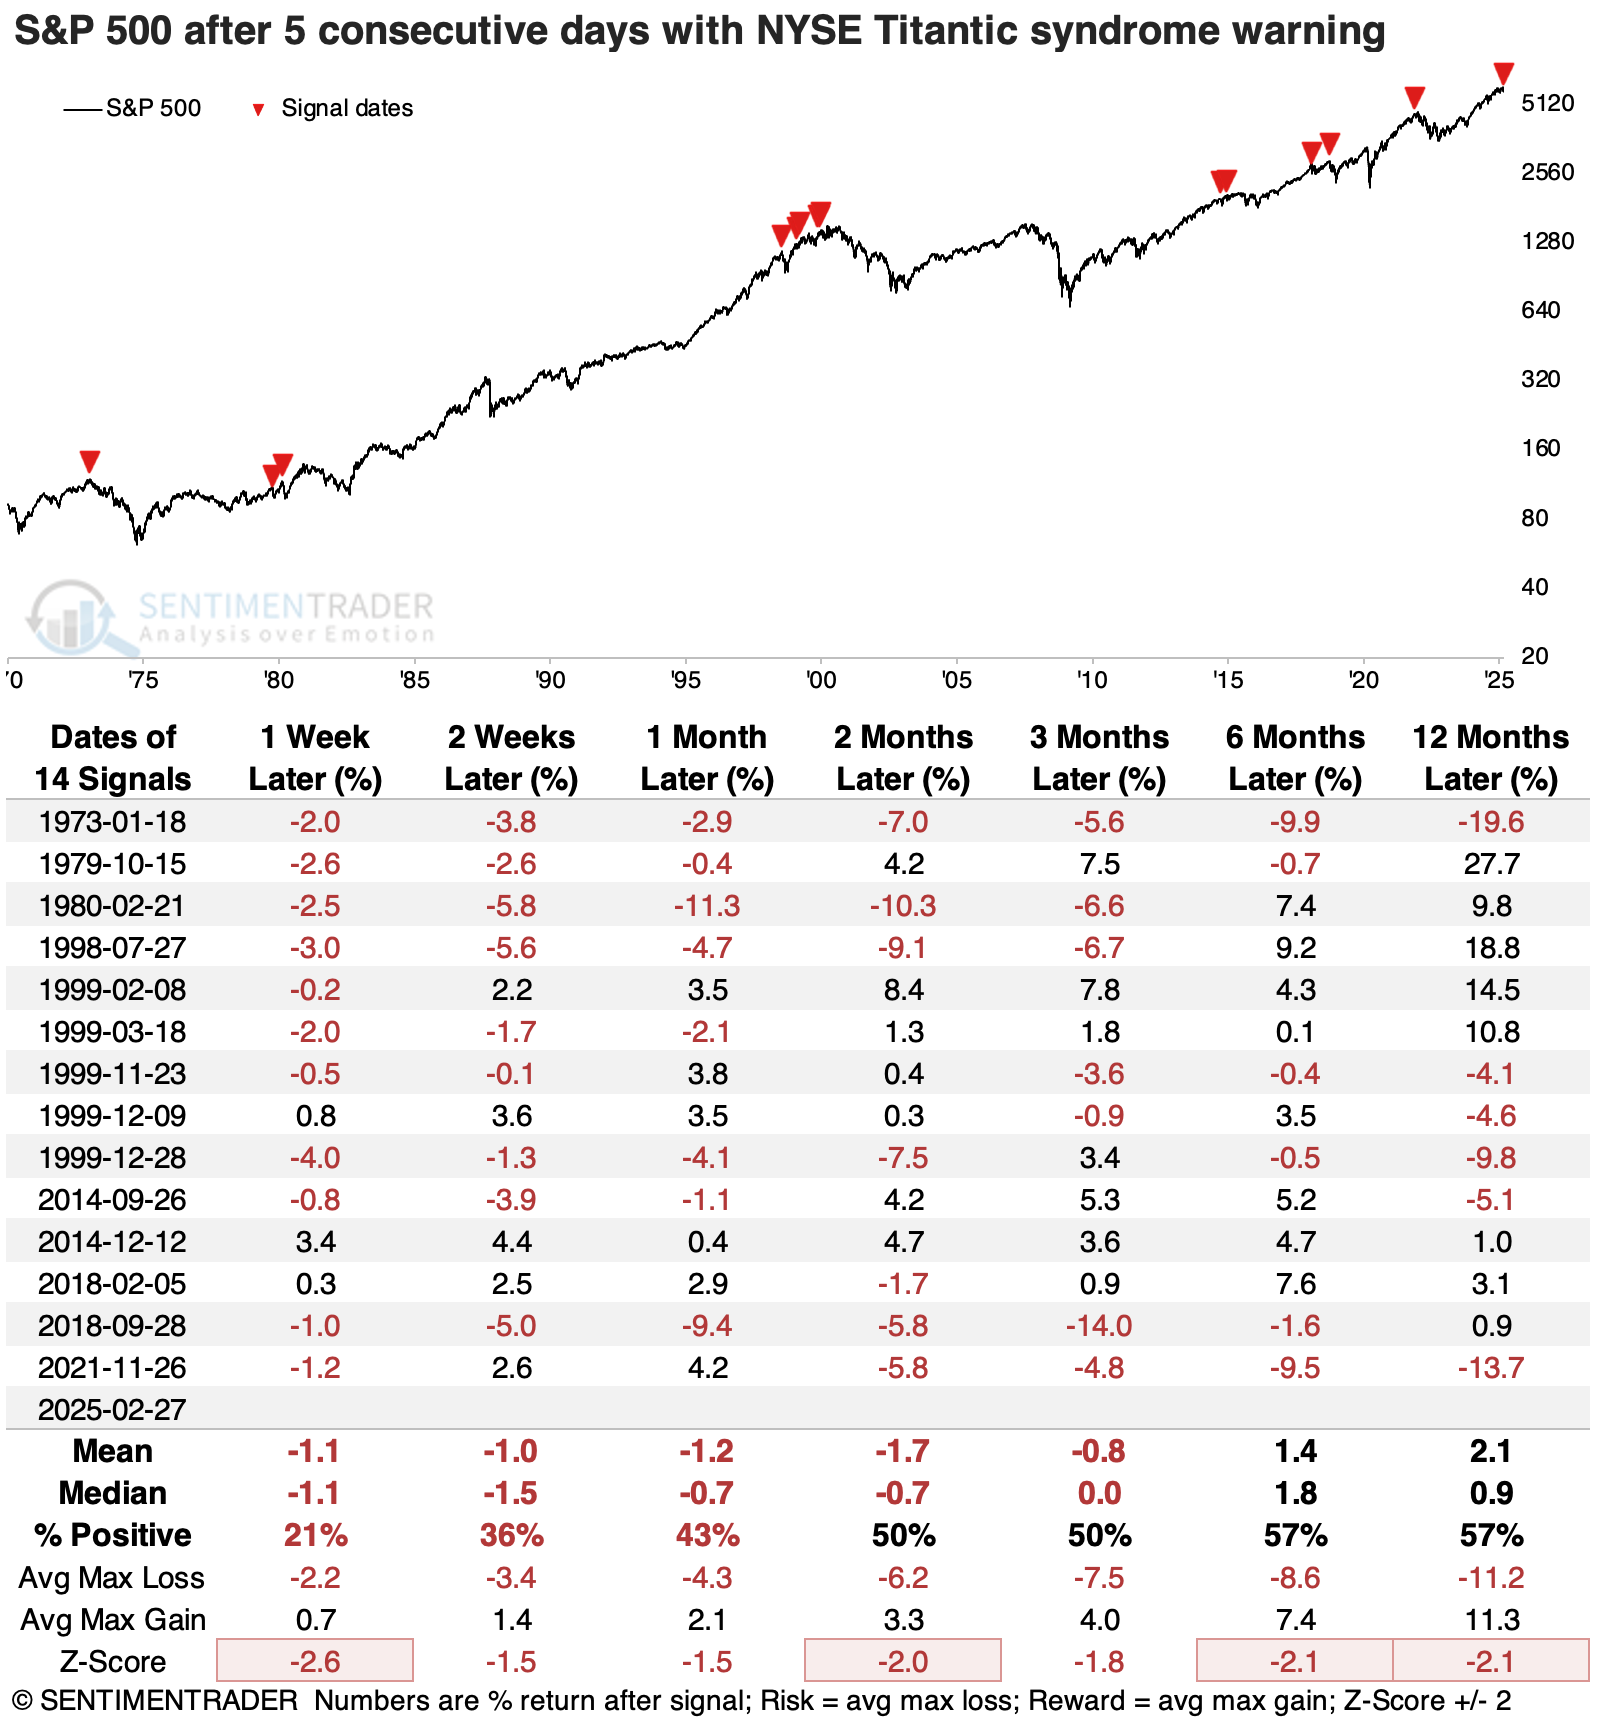
We wrote about a cluster of these signals in January 2022, which provided a valuable heads-up. As we can see from the table below, clusters of these signals have preceded ill returns for the S&P 500 across most time frames, especially shorter-term. Within the following two months, the S&P lost at least -5% seven times while gaining more than +5% only twice.
Warnings on both primary exchanges
These signals have triggered not only on the NYSE but also on the Nasdaq exchange. For only the 3rd time in 40 years, the combined Titanic warnings across both exchanges have totaled ten in the past week. That means the warning was triggered on both exchanges every day for a week.
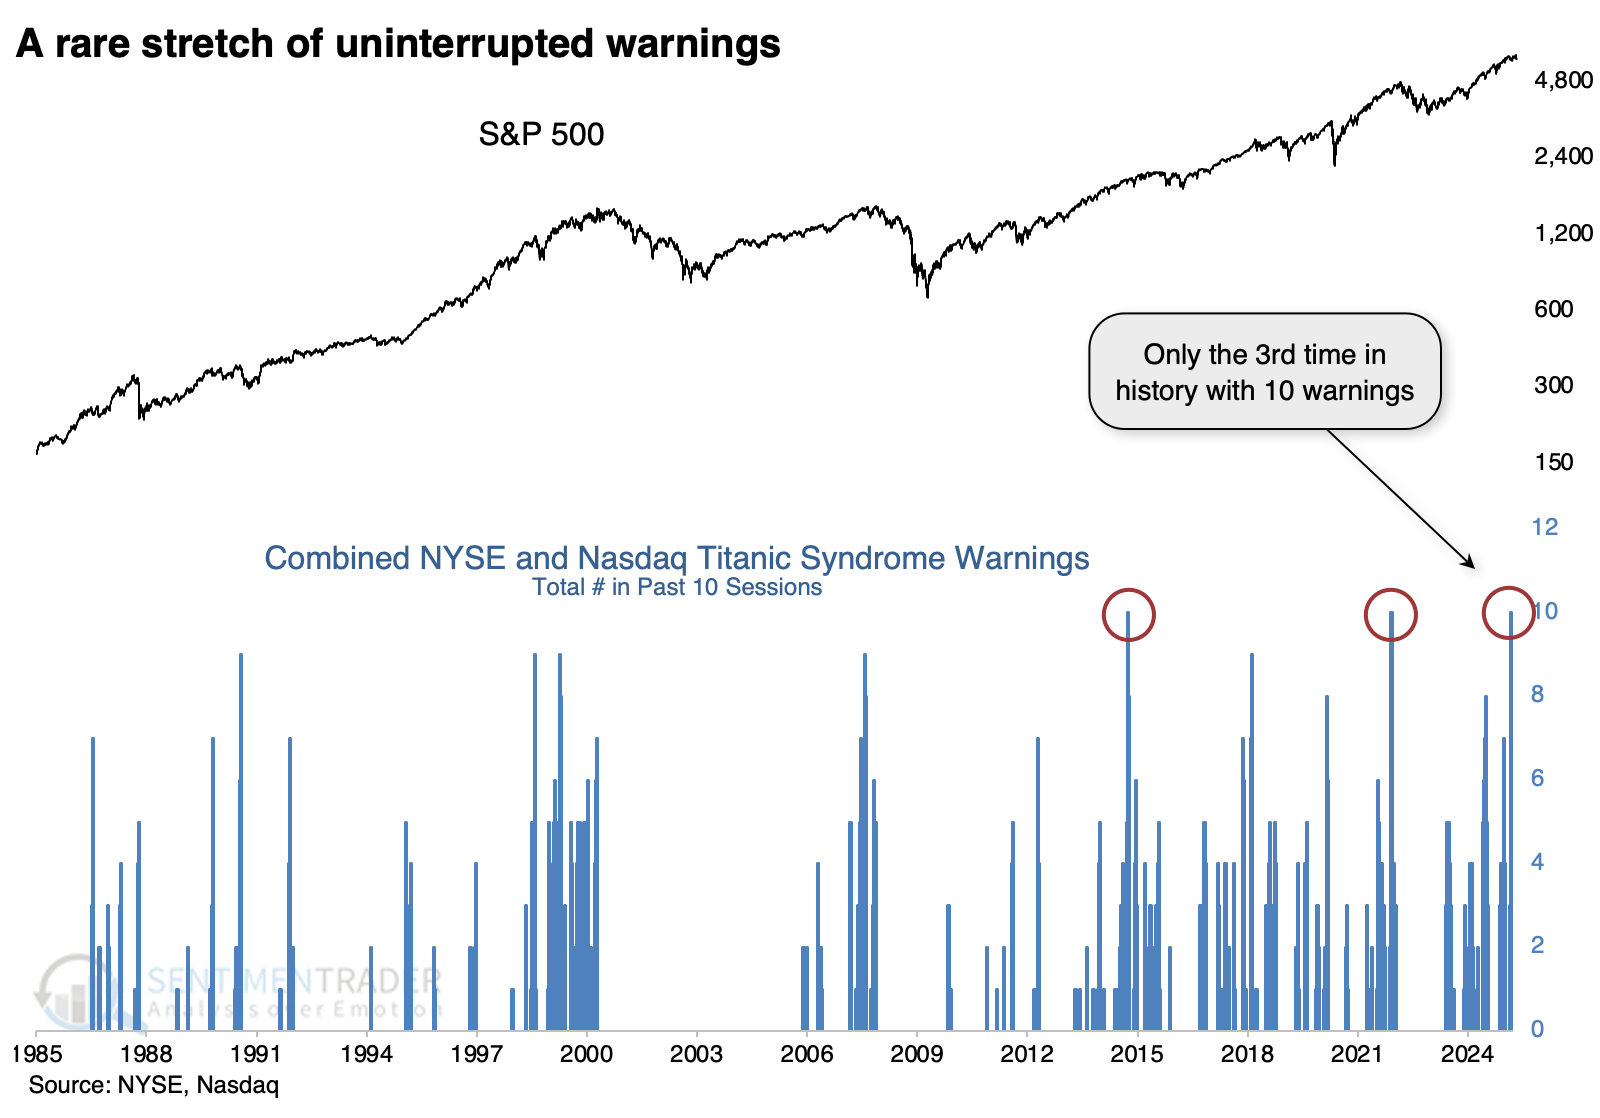
The other two clusters saw the S&P struggle to hold any upside momentum in the weeks ahead, providing investors a poor risk/reward profile.
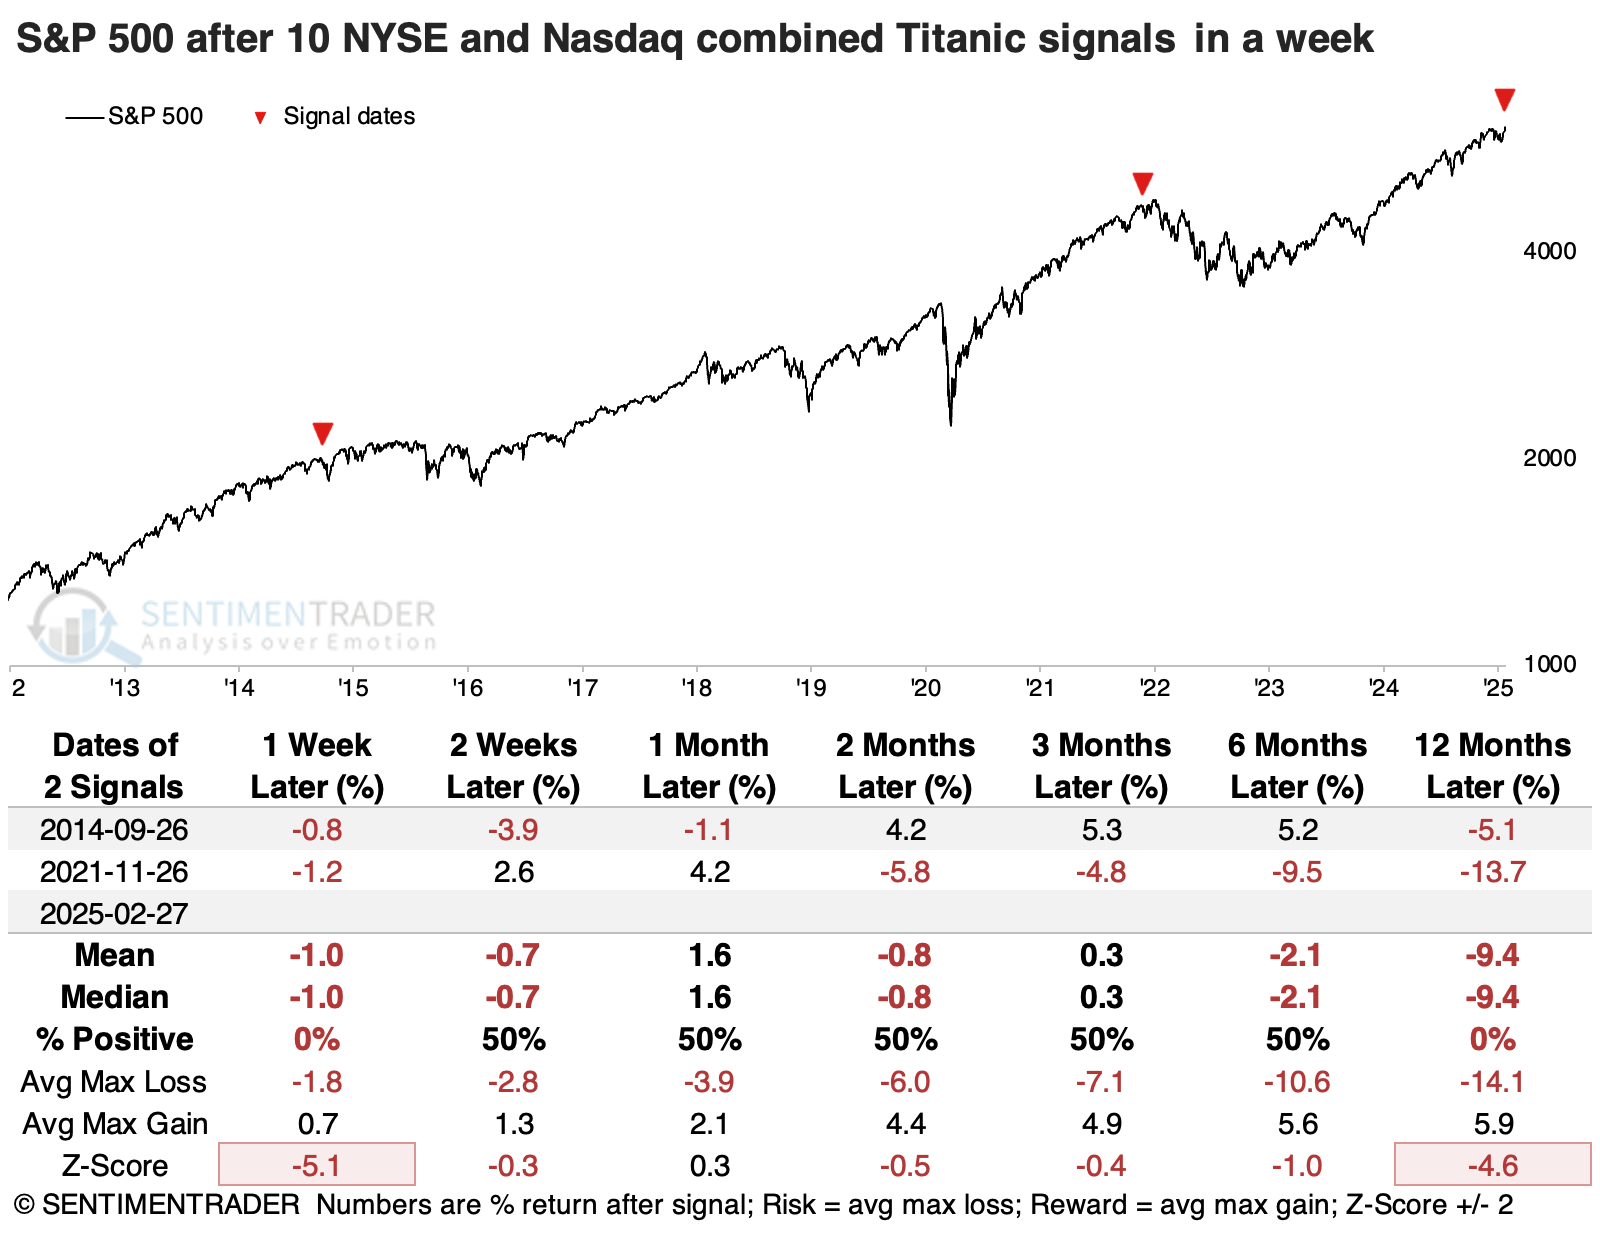
It's tough to rely on such a minuscule sample size, so the table below expands the sample to look for clusters of eight or more signals on the two exchanges. These clusters continued to precede poor returns for the S&P in the weeks ahead, and even over the following year, average risk was higher than average reward. Within the next three months, the S&P lost more than -10% four times while never gaining more than +10%.
A bad sign for indices, with defensive stocks an exception
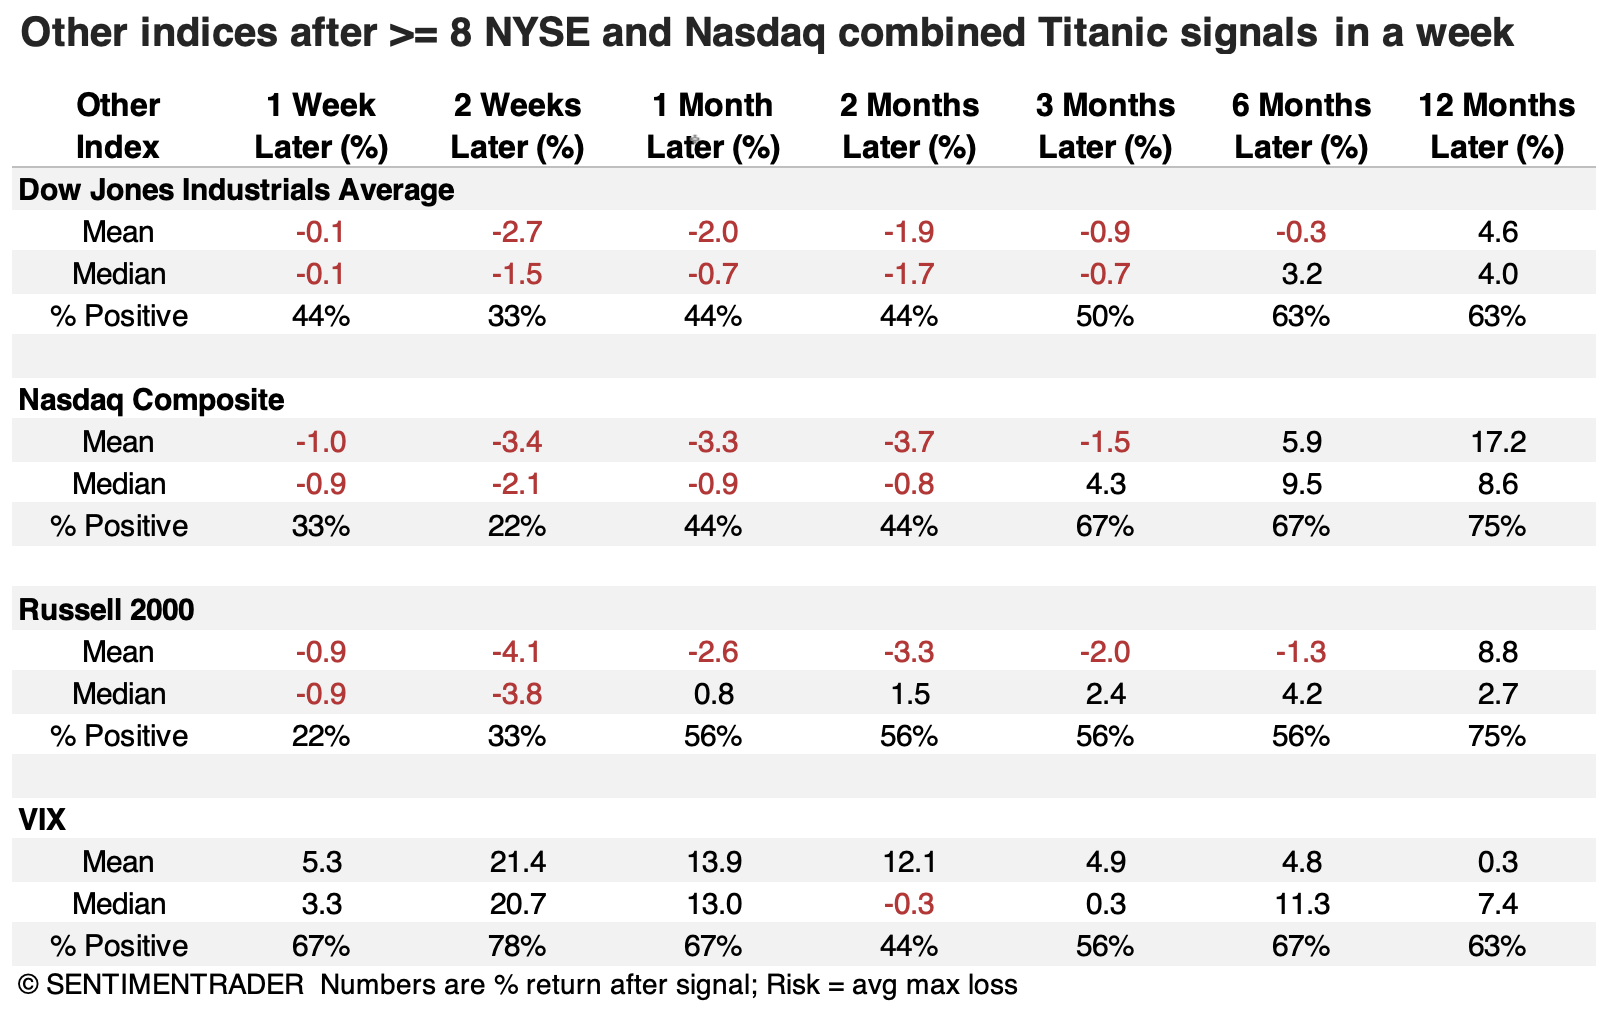
The other major indices also tended to suffer, with the Nasdaq Composite and Russell 2000 bearing the brunt over shorter time frames. Up to six months later, average returns were poor across all the indices. The VIX "fear gauge" tended to spike over the next couple of weeks due to that tendency to see selling pressure.
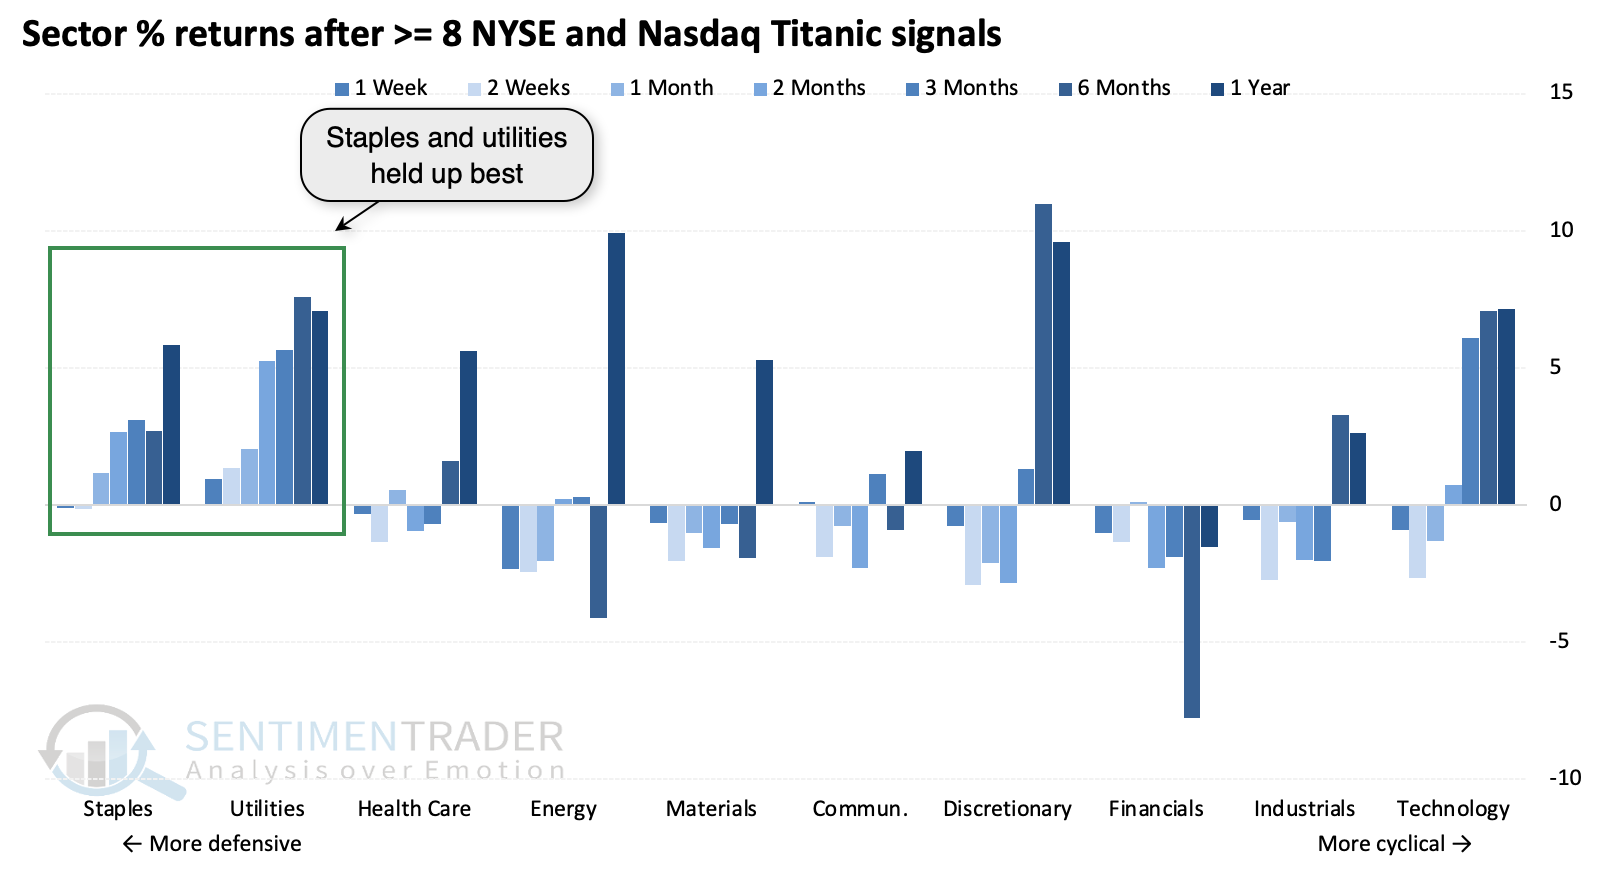
Defensive-oriented sectors like consumer staples and utilities were the only consistent ports in the storm across time frames. They stood out among all sectors as having positive returns over time. Higher-beta sectors like consumer discretionary and technology tended to sell off the most short term and rebound harder over longer time frames.
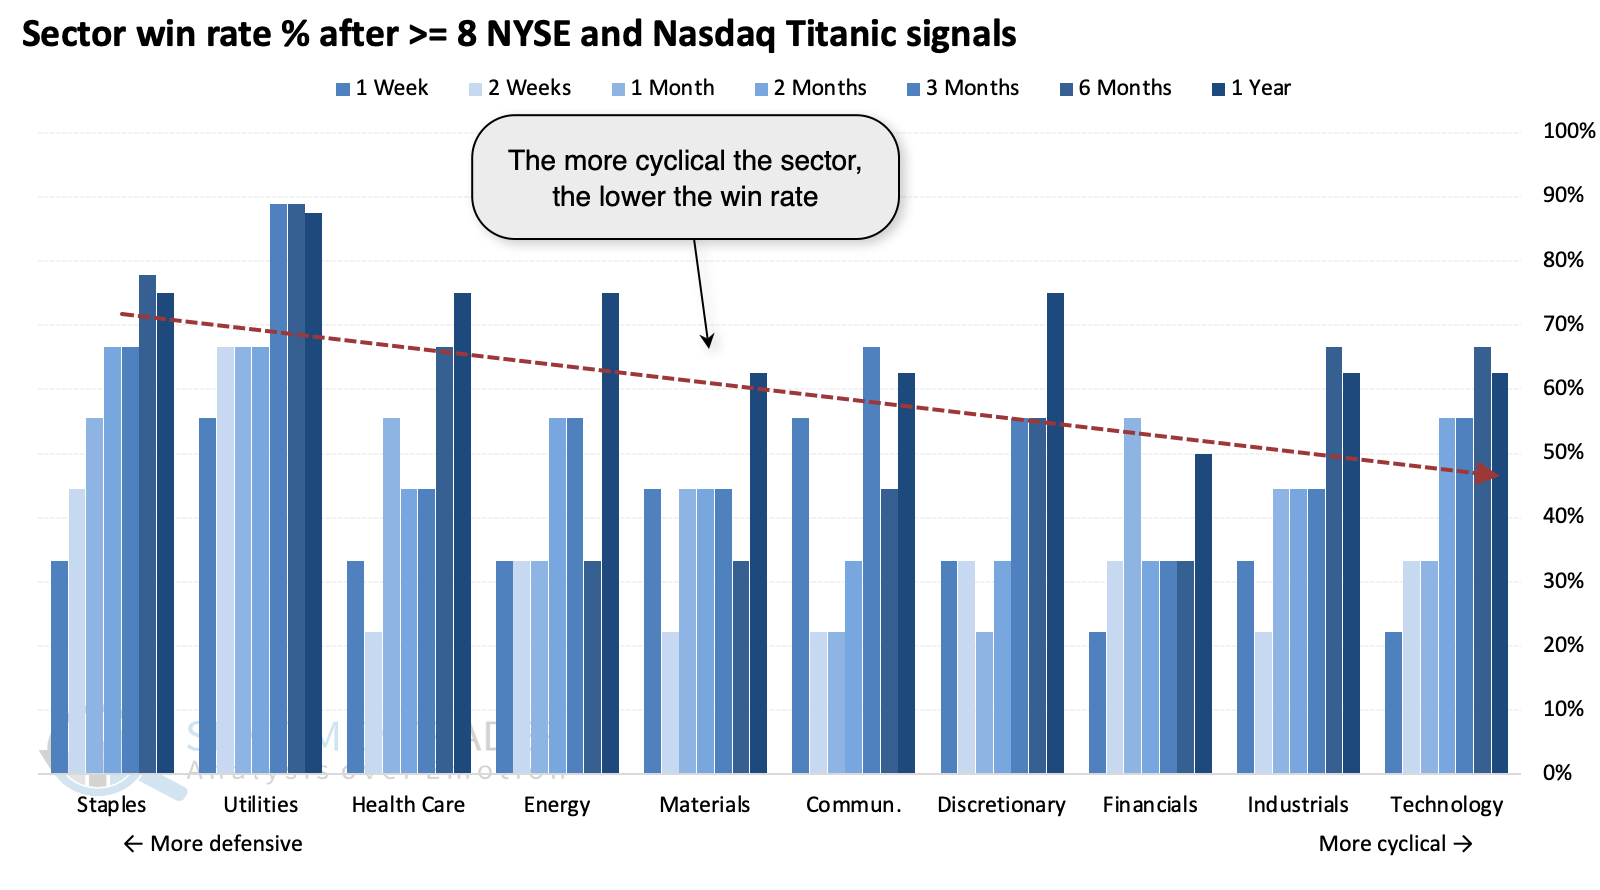
We can see this pattern in the win rate among sectors. As they progressed from the most defensive to the most cyclical, sectors tended to see lower and lower win rates across time frames.
What the research tells us...
A late rebound on Friday saved the markets from generating another Titanic syndrome warning, but that didn't prevent it from triggering every day for a week straight. It's unusual to see such a warning sign persist for a week straight on one exchange, and it's almost unprecedented to see it across two.
It has been beneficial for investors to become more defensive when clusters of warnings pop up like this. Whether that means raising cash, shifting to more defensive sectors, or simply being less aggressive with new buys, it has tended to help returns over short and intermediate time frames. That's something to consider as we endure yet another round of warning clusters. About the only bright spot is that another technical warning, the Hindenburg Omen, has not consistently triggered on the NYSE, though it has on the Nasdaq for months.