
A rare price momentum reversal in semiconductor stocks

Key points:
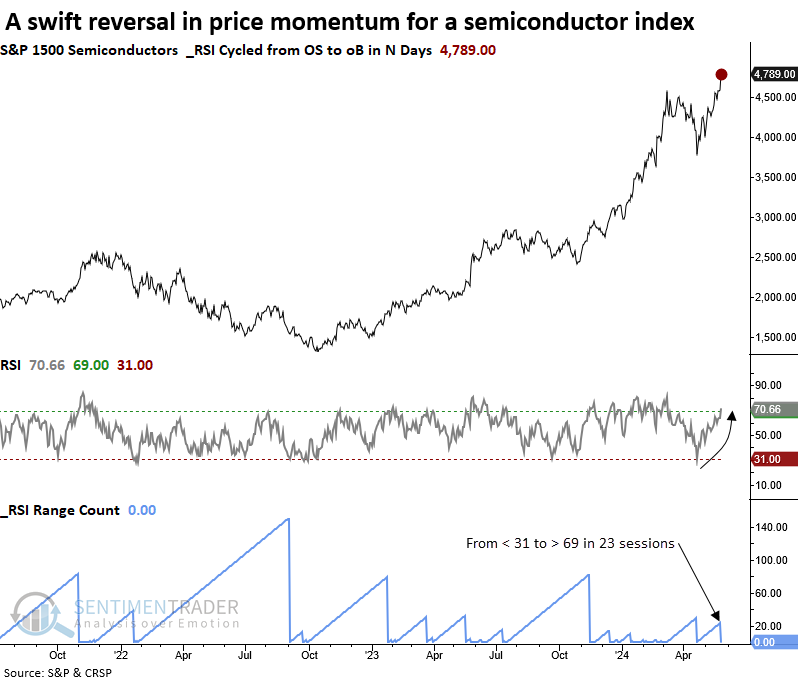
- The Relative Strength Index (RSI) for a Semiconductor index cycled from below 31 to above 69 in 23 sessions
- Similar swift reversals preceded mixed results for the industry over the subsequent three months
- When Semiconductors exhibit bullish momentum, returns and win rates for the broad market are excellent
Can the bullish price momentum in semiconductors persist?
Following a 17% correction from March to April, the S&P 1500 Semiconductor sub-industry group swiftly reversed to the upside, sending its Relative Strength Index (RSI) from below 31 to above 69 in only 23 sessions.
Whether observed in price momentum indicators or breadth-based measures, swift reversals often lead to bullish long-term outcomes. However, they can sometimes result in near-term exhaustion, temporarily causing stocks or indexes to pause.
The previous price momentum shift for semiconductors occurred in 2017 when the broad market was in a low-volatility uptrend similar to now. That reversal produced a 24% gain in six months.
Similar price momentum shifts led to a mixed medium-term outlook
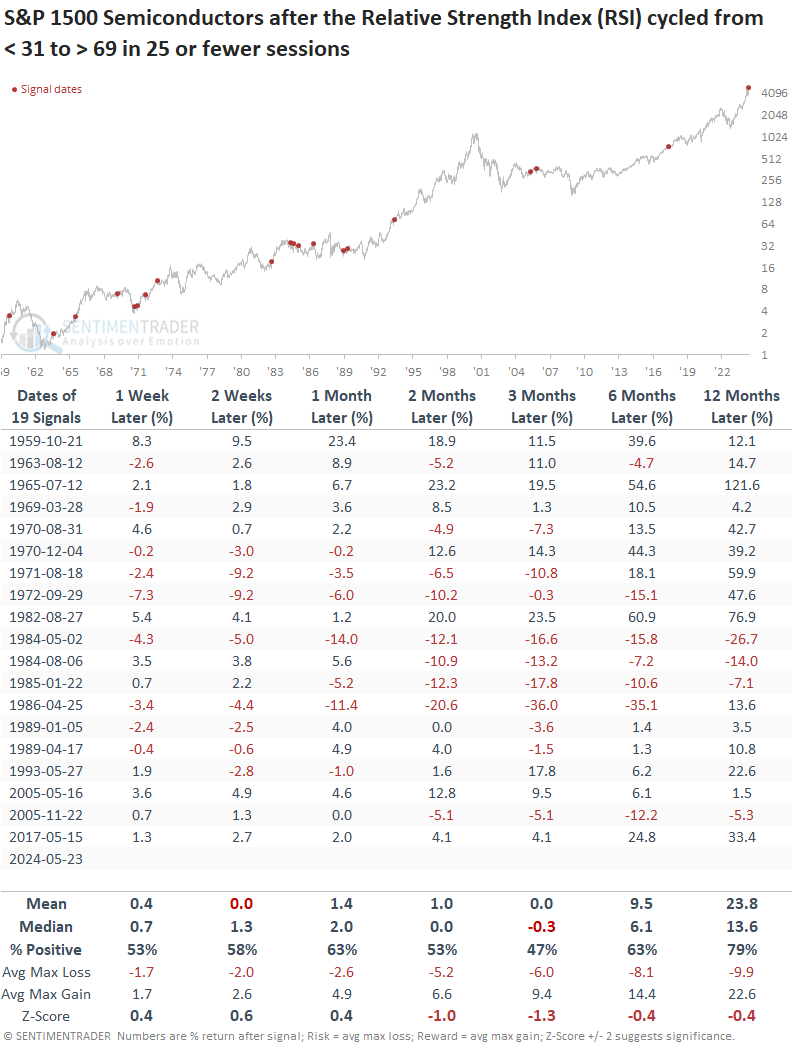
Whenever the Relative Strength Index (RSI) for the S&P 1500 Semiconductor industry cycled from below 31 to above 69 in 25 or fewer sessions, a broad basket of chipmaking stocks showed mixed results for up to three months later.
A year later, the industry was higher 79% of the time, with 3 out of 4 losses confined to an eight-month period between 1984 and 1985.
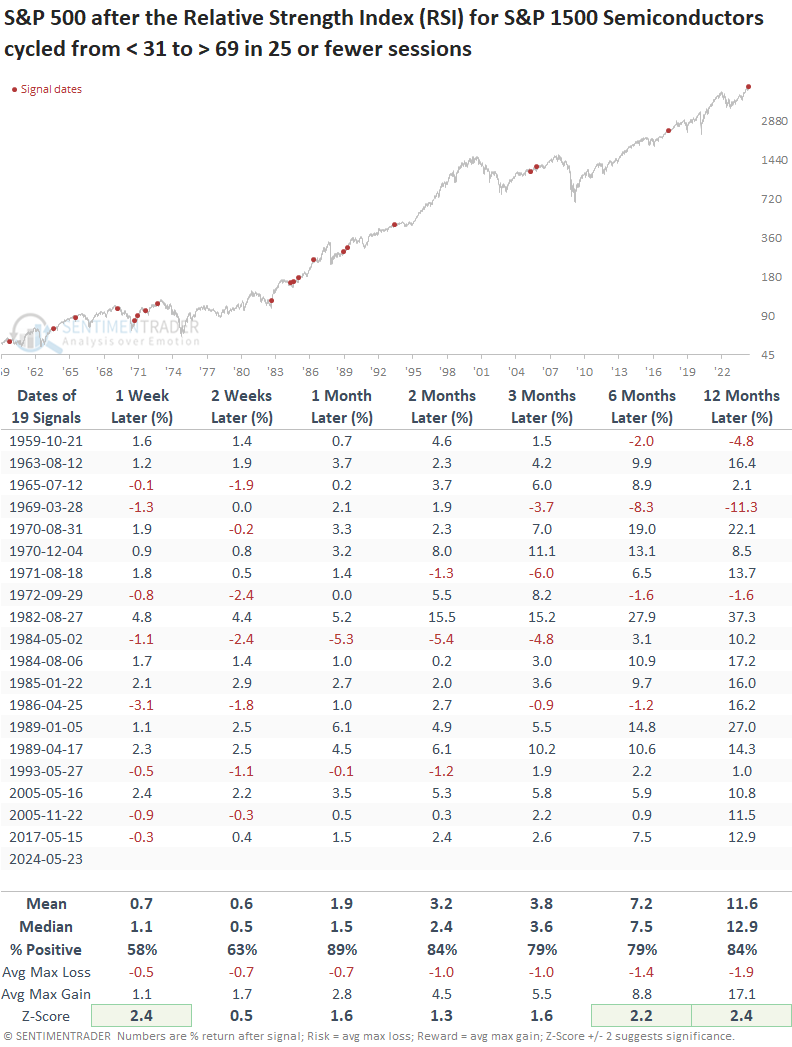
When the semiconductor industry exhibits bullish price momentum like now, the outlook for the S&P 500 is excellent. Over the subsequent twelve months, the world's most benchmark index rose 84% of the time and is presently enjoying an 11-signal win streak that began in 1982.
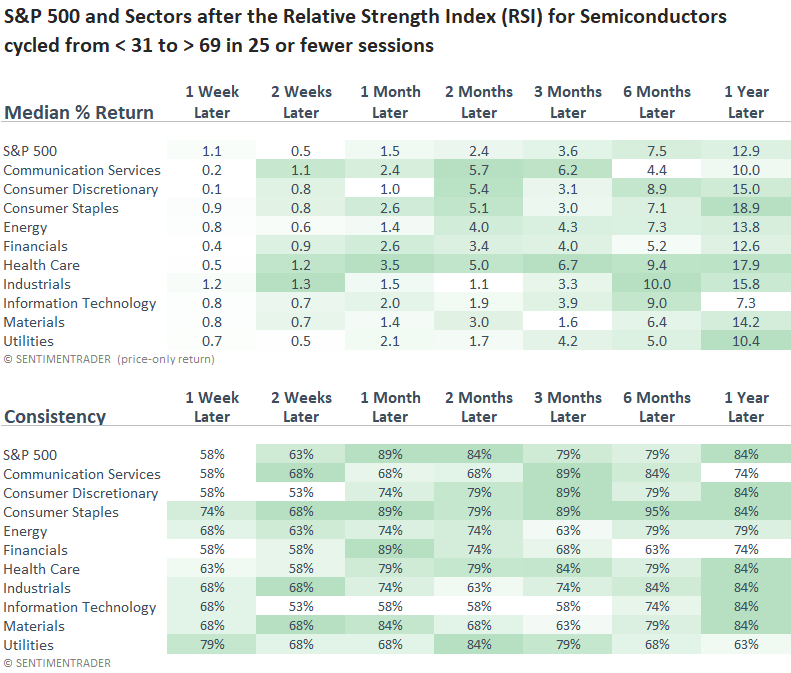
Returns and win rates were impressive across most sectors, indicating that bullish price momentum for a cyclical industry is typical of a favorable overall market environment. Notably, technology exhibited the weakest return over the ensuing year.
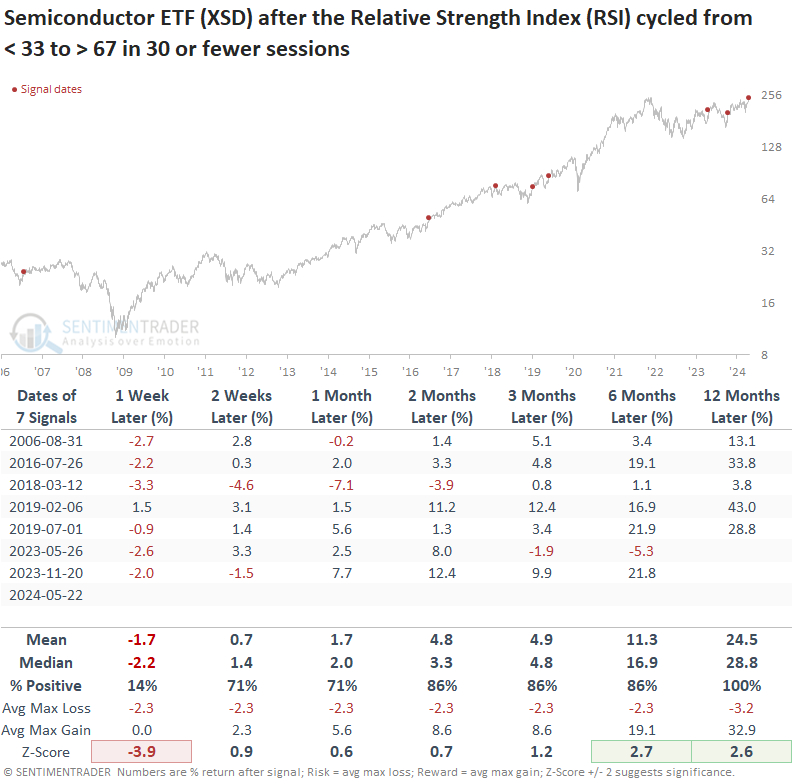
The swift reversal in the semiconductor industry was not driven solely by Nvidia. The Relative Strength Index (RSI) for the equal-weighted semiconductor ETF (XSD) cycled from below 33 to above 67 in 22 sessions.
Even though the sample size is small due to the ETF's short history, the forward returns and win rates were impressive following similar price momentum shifts in a basket of semiconductor stocks that weigh each stock the same, removing market cap bias.
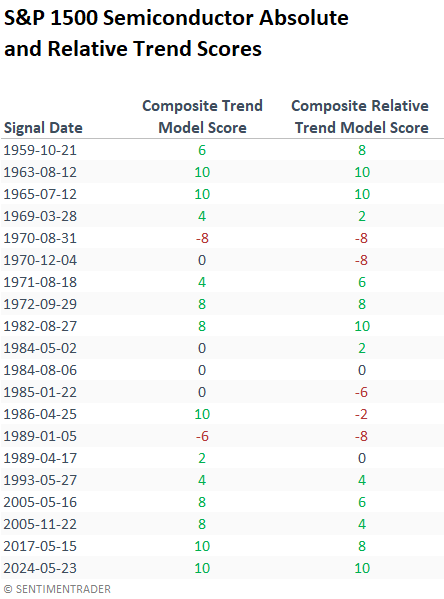
The S&P 1500 Semiconductor sub-industry group currently boasts a perfect absolute and relative trend score, a rarity not seen since 1965 at the time of a price momentum signal. Therefore, despite historical precedents suggesting caution in the medium term, investors should stick with their current semiconductor allocations, as the prevailing trend is favorable.
What the research tells us...
Semiconductor stocks, a pivotal group driving the AI revolution, have recently experienced a bullish shift in price momentum, as indicated by the Relative Strength Index (RSI). Historically, such reversals have led to a mixed market outlook over the subsequent three months, potentially reflecting buyer's exhaustion. A year later, the S&P 1500 semiconductor industry was on an upward trajectory 79% of the time, indicating a resurgence of bullish trends within the group. While semiconductors could experience a pause, the S&P 500 exhibited excellent returns and win rates following similar precedents. The equal-weighted Semiconductor ETF (XSD) also experienced a similar price momentum reversal, implying that this shift was broad-based rather than dominated by a few names like Nvidia. With absolute and relative trends exhibiting perfect scores, investors should maintain allocations until the weight of the evidence suggests otherwise.