Products
SentimenTrader Trading Tools
‍
Backtest Engine
My Trading Toolkit
Correlation Analysis
Seasonality
Market Prediction
Indicators & Data API
‍
Proprietary Indicators & Charts
Market Data API
Strategies & Scanner
‍
50+ Trading Strategies
Smart Stock Scanner
Smart Option Scanner
Research Reports
‍
Research Solutions
Reports Library
Free Resources
Simple Backtest Calculator
Simple Seasonality Calculator
The Kelly Criterion Calculator
Sentiment Geo Map
Public Research Reports
Education
Sentiment Indicators
Technical Indicators
Pricing
Company
About
In the News
Testimonials
Client Success Stories
Contact
Log inLoginSign up
< BACK TO ALL REPORTS

A rare pattern triggers for only the 12th time since 1928

Dean Christians
2023-03-28
The two, four, and ten-month rate of change for the S&P 500 closed within a range of 1% to -1%. After similar consolidation patterns, the index was flat over the next three months. However, rangebound markets tend to resolve themselves in the direction of the prior primary trend. So, one must be mindful of a potential retest of the October low.

Key points:

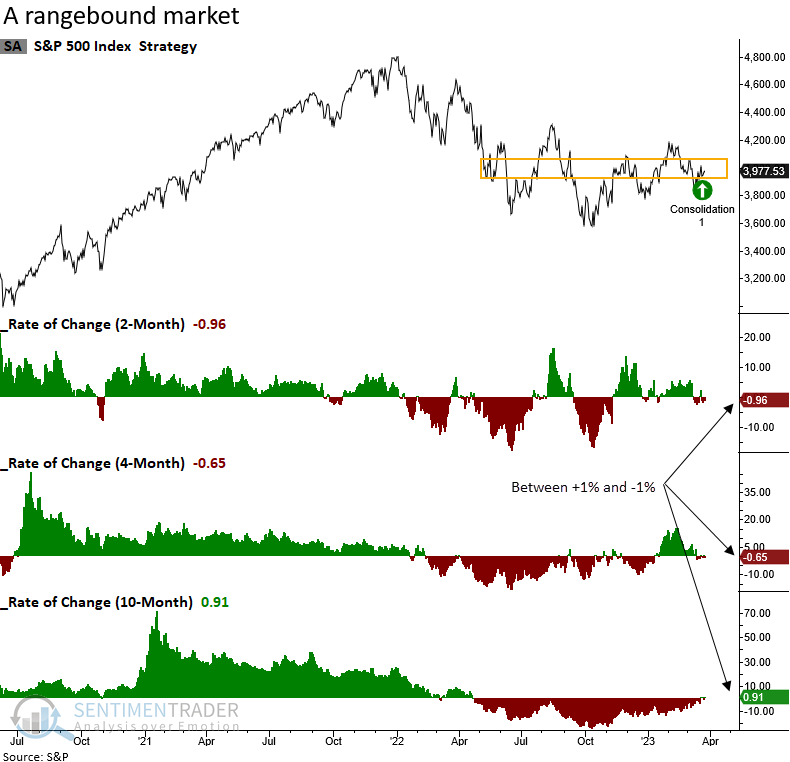
  • The S&P 500 remains rangebound across multiple time frames
  • After similar consolidations, the index made very little progress over the next three months 
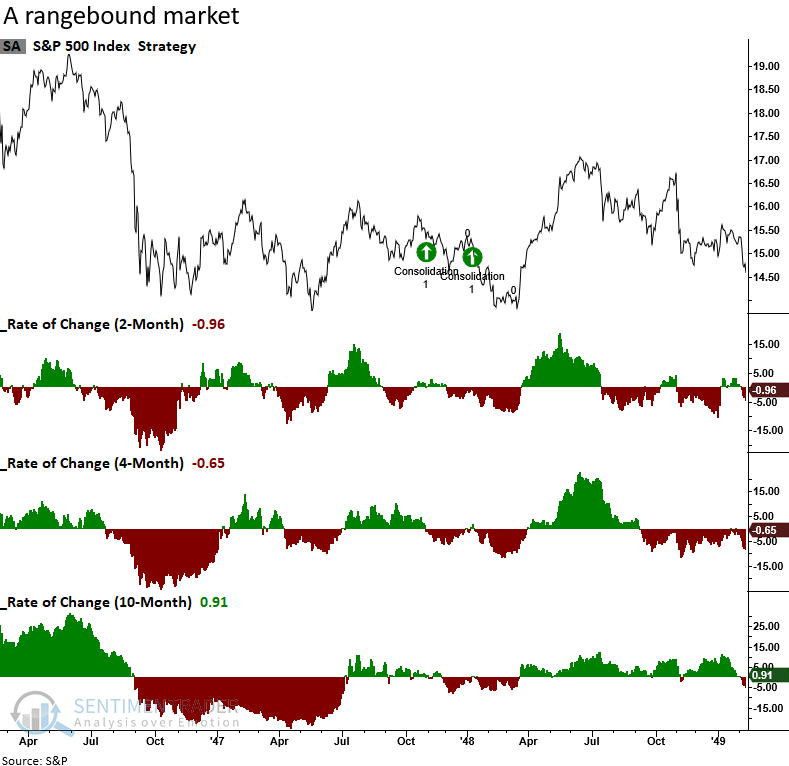
  • The current environment looks similar to the 1946-49 bear market

Nothing is more frustrating than a trendless market 

Consolidations are typically only recognized in hindsight, making them frustrating, especially for trend followers.

Over the last two, four, and ten months, the S&P 500 has gone nowhere. A trendless environment, like now, is rare. I could only find 12 historical cases when the price change over those periods closed within a range of 1% to -1%.

Usually, consolidations resolve themselves in the direction of the prior primary trend.

Similar consolidations led to more frustration over the next three months

When the S&P 500 consolidates in a pattern identical to now, the odds of a sustainable breakout in either direction over the next three months are not great. While the long-term results look excellent, equity markets have an upward bias over time. So, consolidations usually resolve to the upside.

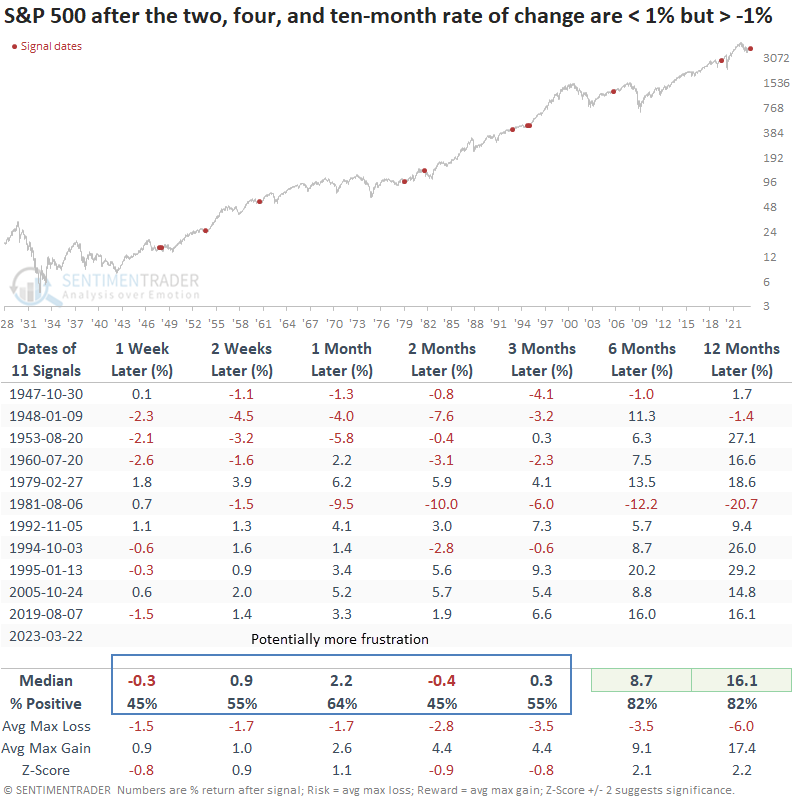
I screened out repeats by identifying the first signal in two months. 

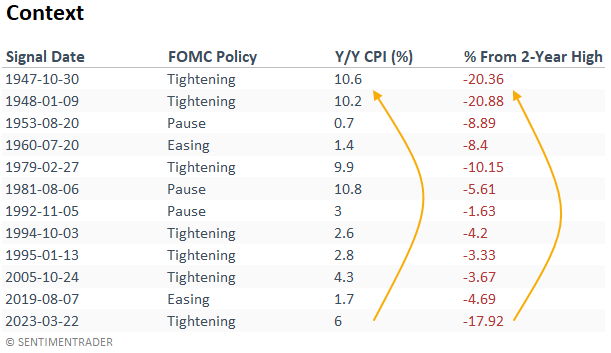
Some additional conditions worth noting 

The consolidation pattern occurred during an FOMC tightening cycle in 7 out of 12 cases. The adjustment to higher rates impacts stocks.

Inflation and the S&P 500's distance from its 2-year high are two conditions that look most similar to the consolidation signals that occurred in the 1946-49 bear market.

A potential analog

The S&P 500 declined from 1946 to 1949 by slightly less than -30%. If the current rangebound market is similar to that period, the bulk of the peak-to-trough drawdown could be over.

However, the bad news is one must consider even more base building and a potential retest of the October low, given that most consolidations resolve in the direction of the primary trend before the consolidation period.

What the research tells us...

Consolidations typically indicate that traders and investors are indecisive about the future direction of a market. The churning environment can be highly frustrating as trading and trend-following signals produce whipsaw situations. Over the last two, four, and ten months, the S&P 500 has gone nowhere. After similar rangebound patterns, the likelihood of a breakout in either direction in the next three months does not look encouraging. Several market conditions suggest the current consolidation pattern could be similar to the 1946-49 period. So, one must keep an open mind to a potential retest of the October low and a multi-year base-building process.

PRODUCTS
SentimenTrader
Trading Tools
Indicators & Data API
‍
Strategies & Scanner
‍
Research Reports
FREE
RESOUrCES
Simple Backtest
Calculator
Simple Seasonality
Calculator
The Kelly Criterion
Calculator
Sentiment Geo Map
‍
Public Research Reports
‍
Education
Sentiment Indicators
‍
Technical Indicators
‍
Pricing
Bundle pricing
‍
FAQ
‍
Announcements
‍
COMPANY
‍
About
‍
In the News
‍
Testimonials
‍
Client Success Stories
CONTACT
‍
General Inquiries
‍
Media Inquiries
‍
Financial Professionals Inquiries
‍
© 2026 Sundial Capital Research Inc. All rights reserved.
Setsail Marketing
TermsPrivacyAffiliate Program
Risk Disclosure: The information and tools provided are for research and analytical purposes only and are not intended as investment advice. Market analysis involves uncertainty, and outcomes may differ from expectations. Users should conduct their own due diligence and consider their individual circumstances before making any financial decisions. Past performance is not necessarily indicative of future results.

Hypothetical Performance Disclosure: Hypothetical performance results have many inherent limitations, some of which are described below. No representation is being made that any account will or is likely to achieve profits or losses similar to those shown; in fact, there are frequently sharp differences between hypothetical performance results and the actual results subsequently achieved by any particular trading program. One of the limitations of hypothetical performance results is that they are generally prepared with the benefit of hindsight. In addition, hypothetical trading does not involve financial risk, and no hypothetical trading record can completely account for the impact of financial risk of actual trading. for example, the ability to withstand losses or to adhere to a particular trading program in spite of trading losses are material points which can also adversely affect actual trading results. There are numerous other factors related to the markets in general or to the implementation of any specific trading program which cannot be fully accounted for in the preparation of hypothetical performance results and all which can adversely affect trading results.

Testimonial Disclosure: Testimonials appearing on this website may not be representative of other clients or customers and is not a guarantee of future performance or success.