
A rare combination of annual highs from cyclical sectors

Key points:
- Annual highs for stocks in the Discretionary, Financial, and Industrial sectors surged higher
- Similar expansions in new highs suggest the uptrend in the S&P 500 will persist over the following year
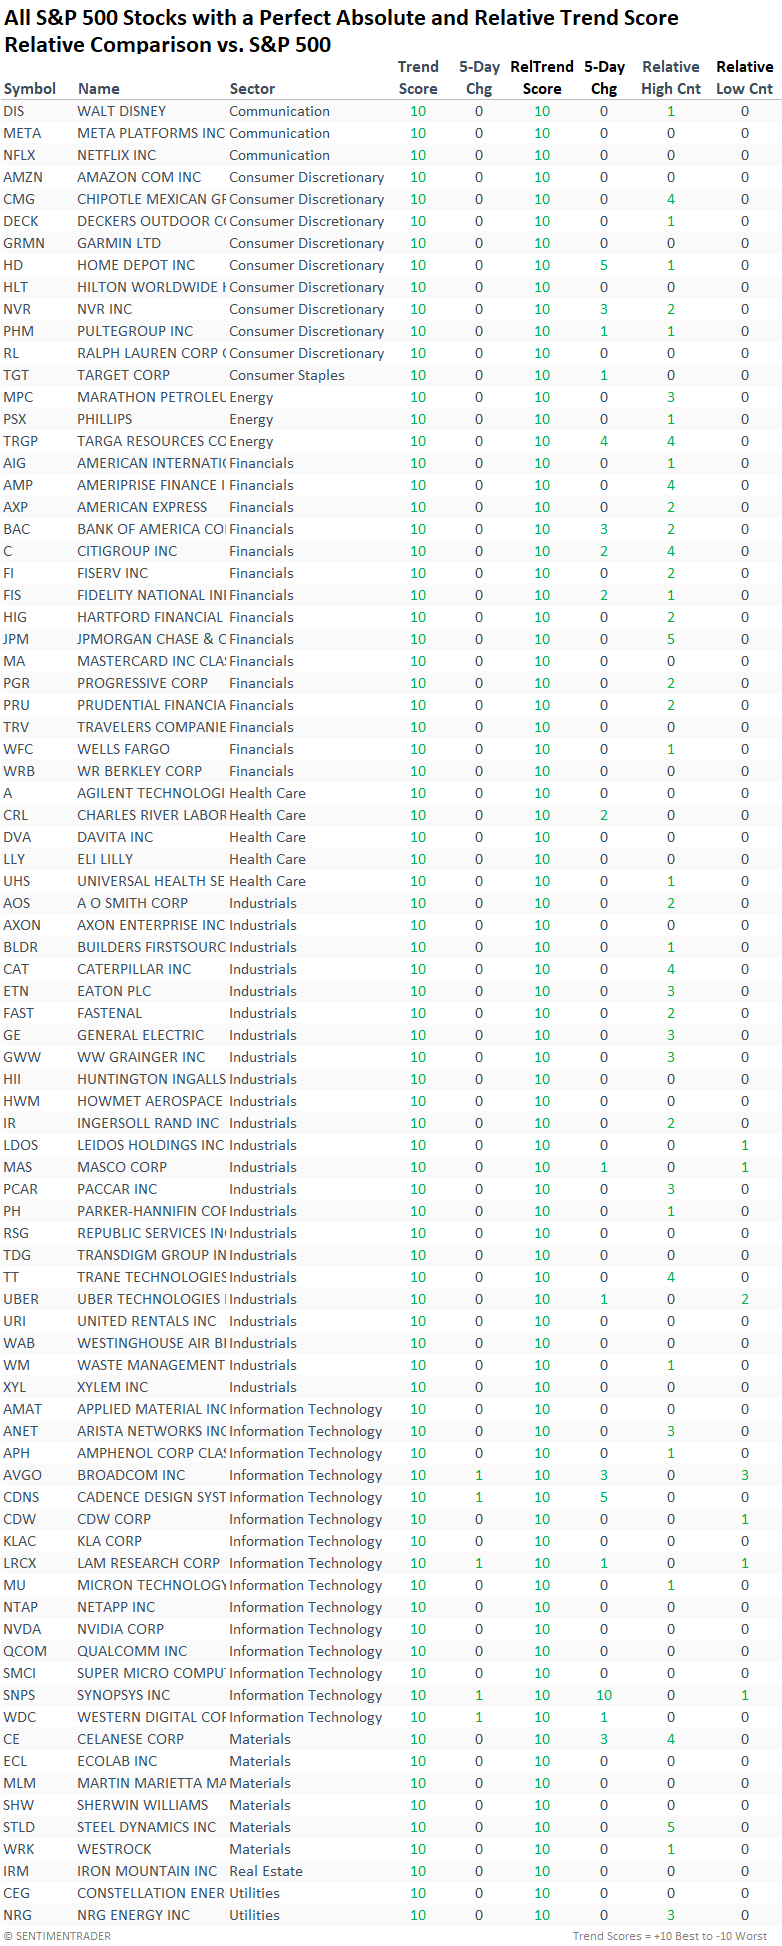
- The Financial sector ETF (XLF) is the only sector to boast perfect absolute and relative trend scores
Markets rarely peak when new highs are expanding
Last week, I highlighted a bullish trading signal from an indicator that measures the percentage of S&P 500 stocks trading within 5% of a 252-day high. This breadth-based indicator showed that most stocks were hovering just below annual highs.
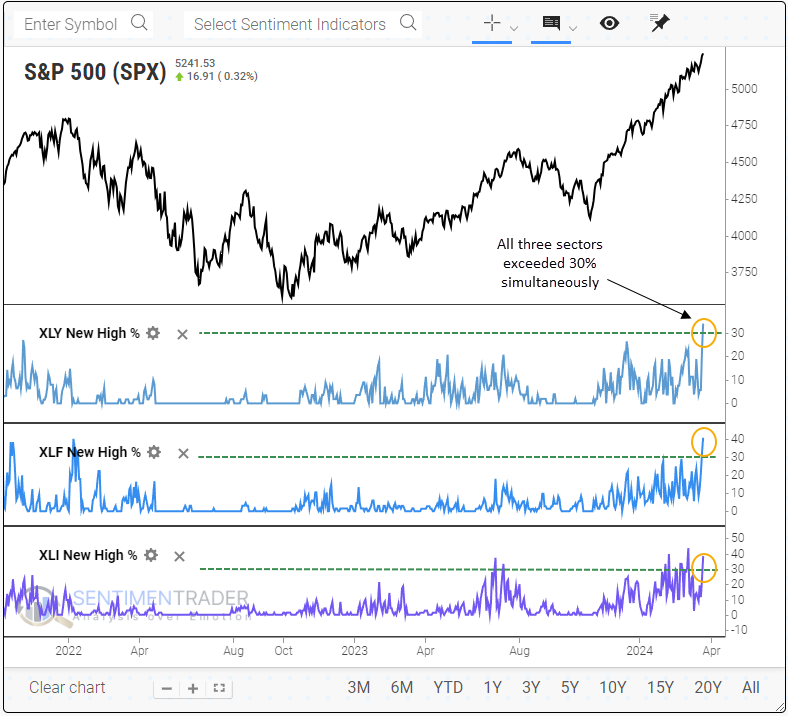
On Thursday, a considerable number of these stocks catapulted higher, sending the percentage of S&P 500 stocks registering annual highs to the most significant level since May 2021.
When I examined the breakdown by sector, Financials, Industrials, and Consumer Discretionary maintained the highest proportion of members, registering a high, with all three groups exceeding 30%.
With so many cyclical sector stocks breaking out, what message does the market provide about the sustainability of the uptrend?
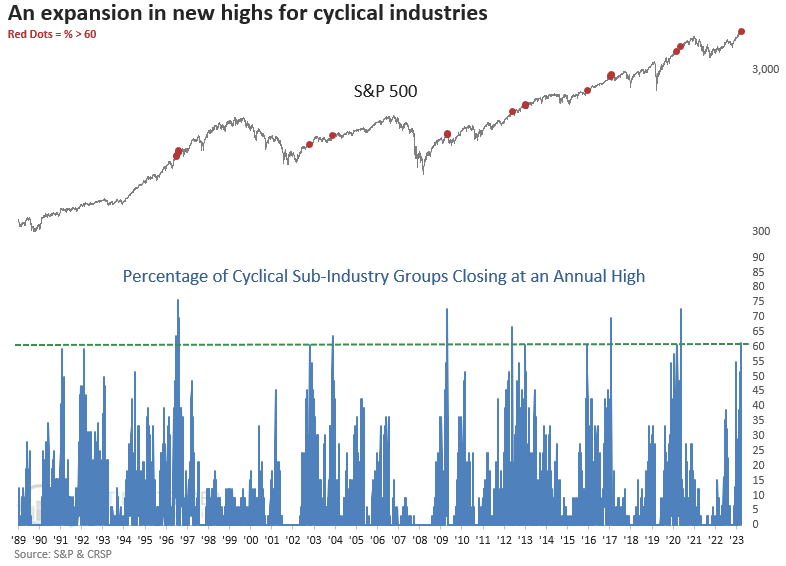
New highs also expanded at the index level, with more than 60% of cyclical sub-industry groups closing at the highest level in a year. So, both internal and external measures of price action for stocks that are sensitive to shifts in the economy confirm the uptrend in stocks.
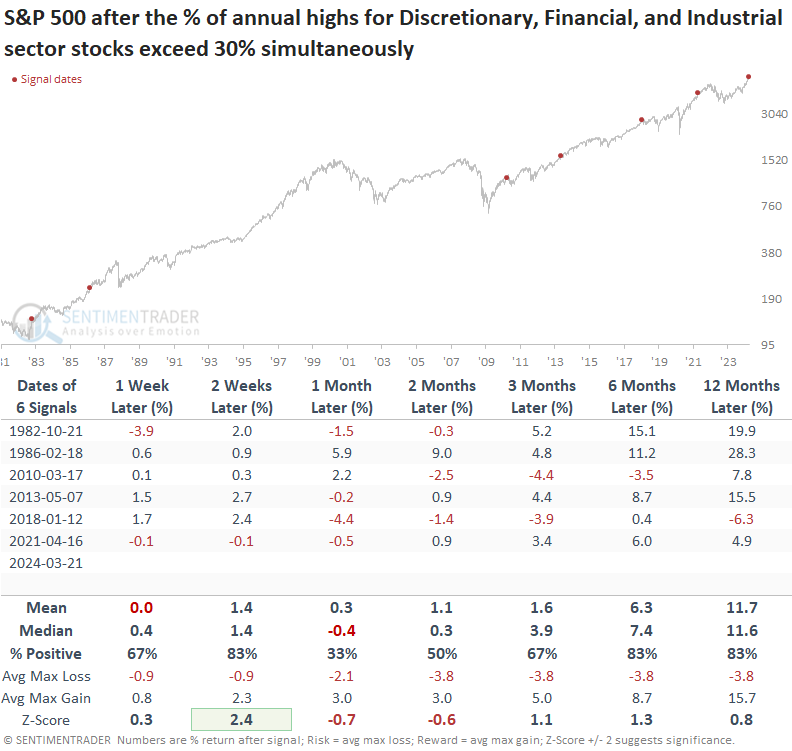
Similar expansions in annual highs preceded solid results for the S&P 500
While the sample size is small, when the percentage of stocks in the Discretionary, Financial, and Industrial sectors recorded annual highs surpassing 30% concurrently, the world's most benchmarked index tends to rally over the following year. However, it was not without risk. Precedents in 2010 and 2018 occurred within a few weeks of medium-term corrections.
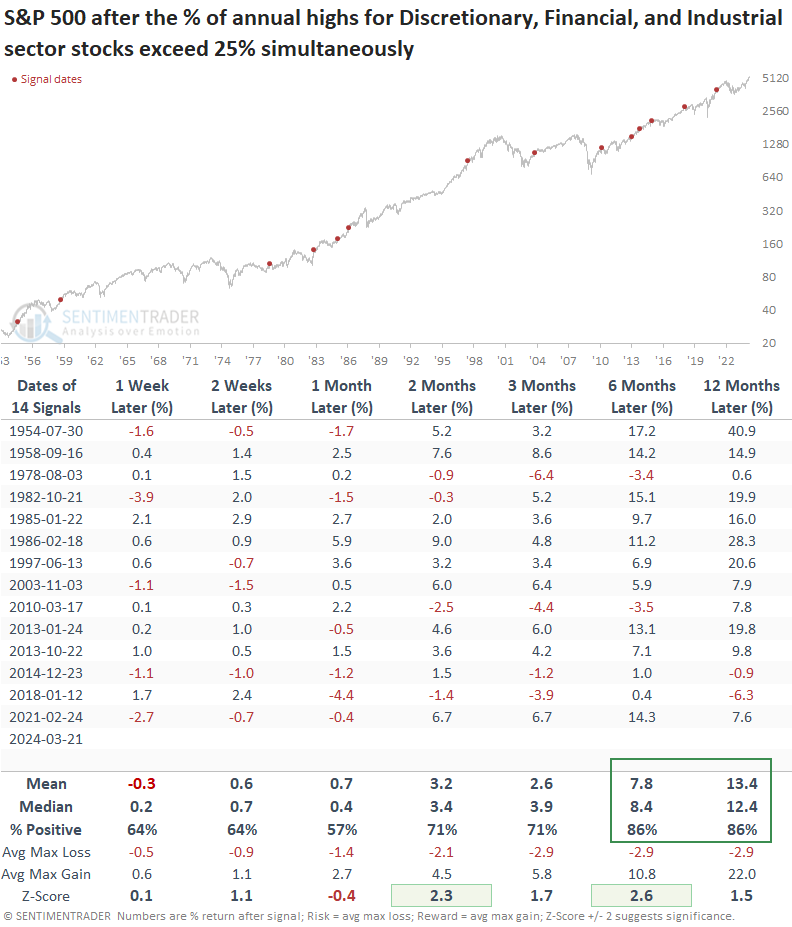
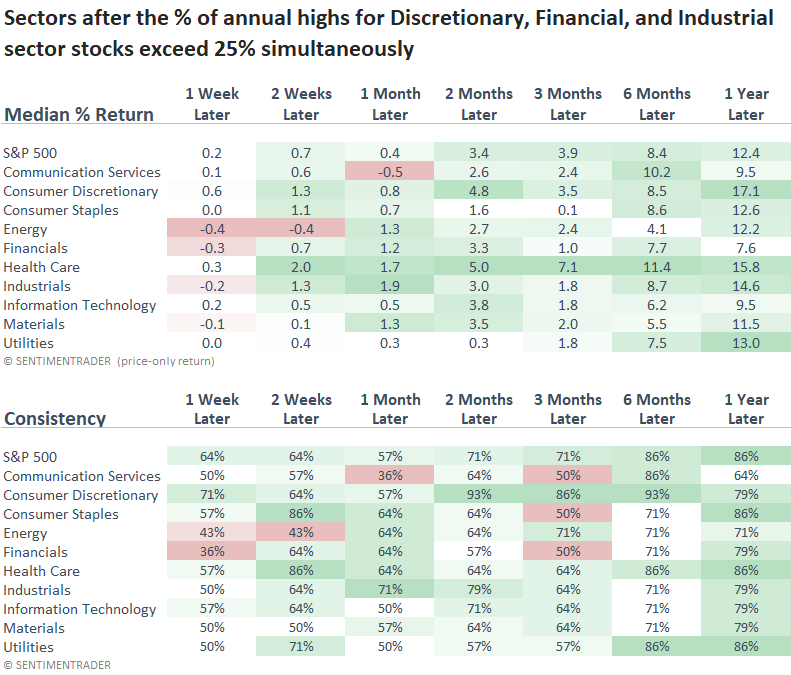
When I lowered the threshold to 25% to increase the sample size, the S&P 500 displayed favorable returns and win rates, especially over the subsequent six and twelve months. In both of those time frames, the average maximum gain surpassed the average maximum loss by a considerable margin.
Over the following year, Discretionary and Industrials outperformed the S&P 500 while Financials underperformed.
Absolute and Relative Trends
Although historical tendencies provide a framework for understanding what might succeed, they don't always align with present-day trends.
Based on current-day sector/ETF scores, one could argue for a broad-based allocation to Financials and Industrials, while Consumer Discretionary is a wait-and-see scenario.
Bold symbols represent cap-weighted ETFs.
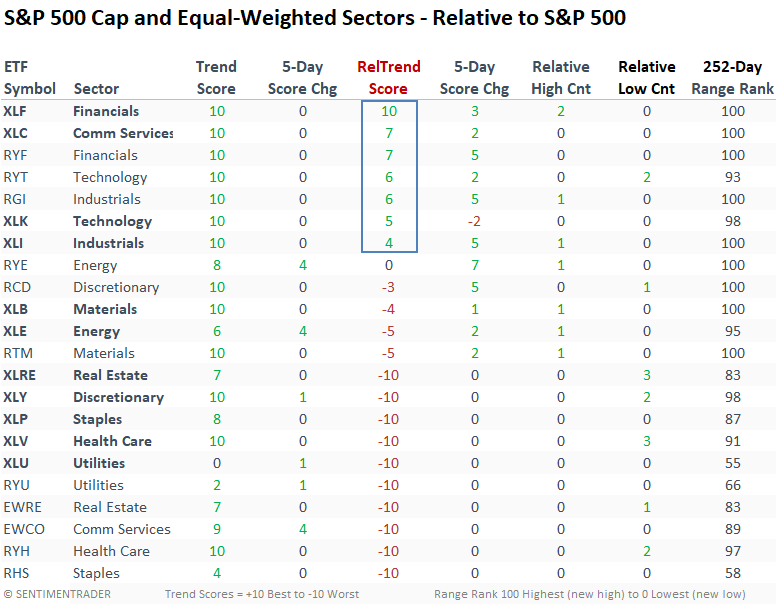
Digging beneath the surface of indexes or sectors can provide a broader perspective into underlying trends within a group. Industrials maintain the highest percentage of stocks with a perfect relative trend score of ten, followed by Technology, Materials, and Financials.
What the research tells us...
With a signficant number of stocks in economically sensitive sectors like Consumer Discretionary, Financials, and Industrials registering annual highs simultaneously, the uptrend in the world's most benchmarked index should persist, especially since indexes rarely peak when participation is broadening. From a sector allocation perspective, Financials and Industrials offer a compelling alternative to Technology, especially at the individual stock level.