Products
SentimenTrader Trading Tools
‍
Backtest Engine
My Trading Toolkit
Correlation Analysis
Seasonality
Market Prediction
Indicators & Data API
‍
Proprietary Indicators & Charts
Market Data API
Strategies & Scanner
‍
50+ Trading Strategies
Smart Stock Scanner
Smart Option Scanner
Research Reports
‍
Research Solutions
Reports Library
Free Resources
Simple Backtest Calculator
Simple Seasonality Calculator
The Kelly Criterion Calculator
Sentiment Geo Map
Public Research Reports
Education
Sentiment Indicators
Technical Indicators
Pricing
Company
About
In the News
Testimonials
Client Success Stories
Contact
Log inLoginSign up
< BACK TO ALL REPORTS

A rare buy signal in natural gas

Dean Christians
2023-02-28
Natural gas plunged by the most significant amount in history over the last six months. An indicator I use to monitor dislocations in the commodity triggered only the 6th buy signal in more than 30 years. After similar precedents, natural gas was higher every single time.

Key points:

  • The 1-year futures spread as a % of the 1st contract price for natural gas plunged below -60% and reversed
  • After similar spread reversals, natural gas rallied every time from one week to twelve months later 
  • Natural gas stocks typically follow the commodity higher, with solid returns across most time frames

A mean reversion opportunity after a significant decline

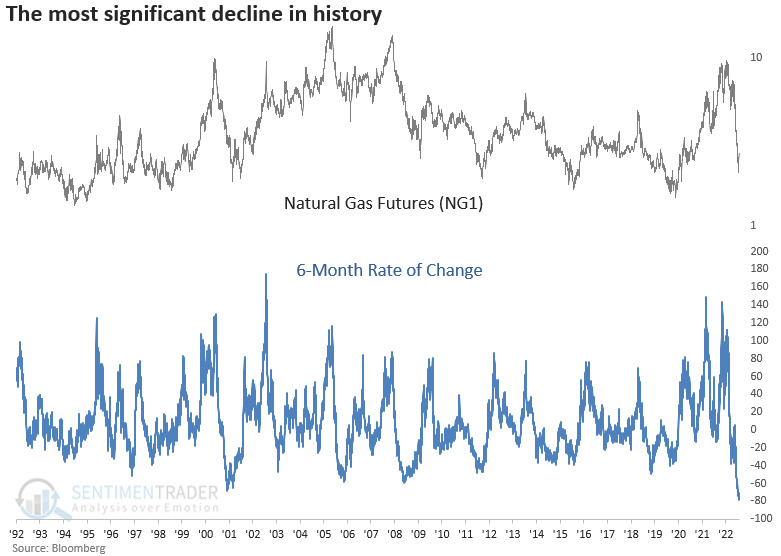
Warm weather around the globe and especially in Europe, sent natural gas prices plunging at a historic rate. Over the last six months, the commodity declined by -77%, shattering the previous record decline of -68% from 2001. 

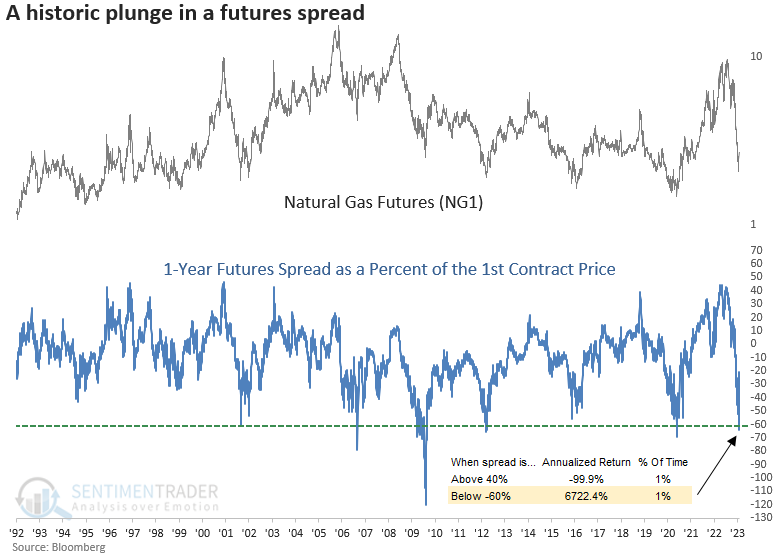
I track dislocations in the natural gas market by monitoring the 1-year futures spread as a percent of the 1st contract price. Last week, the spread fell below -60% for only the 6th time in history.

While extremely rare, annualized returns are uber bullish when the indicator falls below -60%. Conversely, natural gas is highly likely to decline when it exceeds +40%, which it did in 2022.

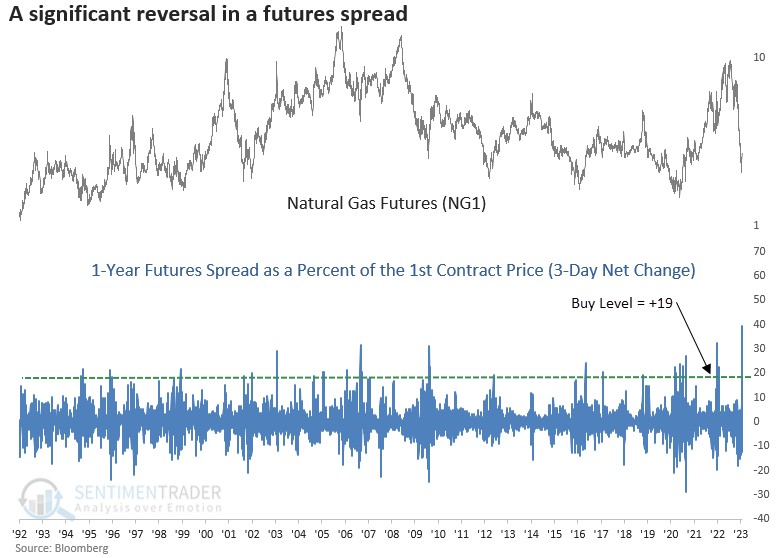
As stated in previous research notes, I dislike catching a falling knife. I would rather wait for a reversal signal, even if it means I miss some of the early stages of the recovery. 

With that in mind, I created a simple trading signal for the futures spread. After the indicator declines below -60%, the model looks for a 3-day net change increase in the spread of +19%.

 On Monday, the 3-day net change surged by the most significant amount in history, triggering a new buy signal.

Similar spread reversals preceded bullish natural gas prices

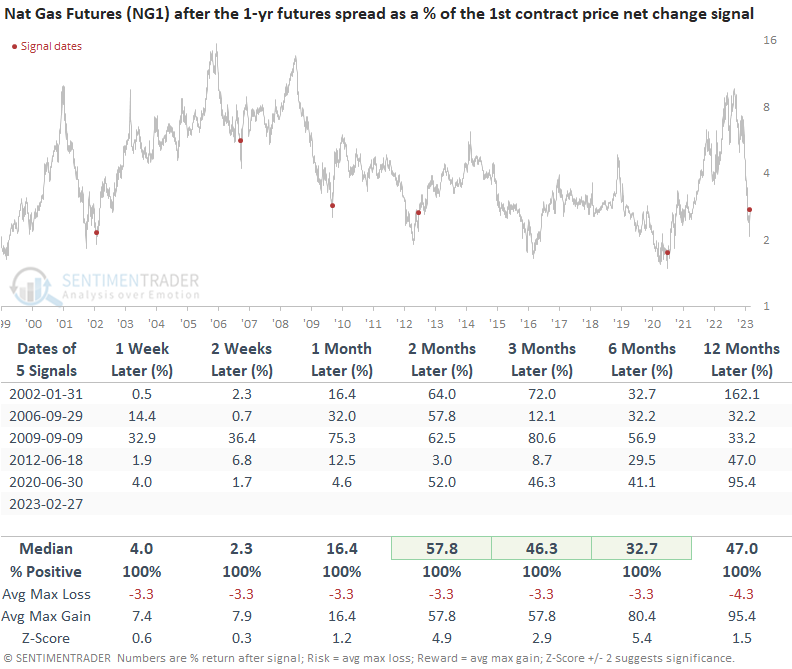
When the 1-year futures spread as a % of the 1st contract price falls below -60% and subsequently increases by 19% over three sessions, natural gas had a 100% win rate across every time frame. 

If you were wondering, the signals in 2006 and 2020 were triggered almost immediately after the spread fell below -60%, which is the case now.

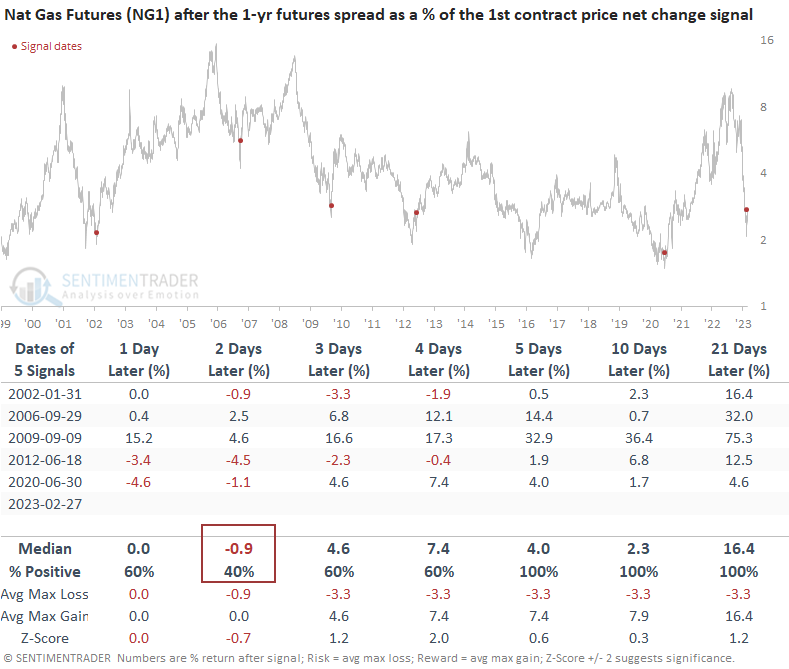
With the 3-day net change increasing by the most significant amount in history, let's look at a short-term outlook table to see if we should expect some giveback in the next few days.   

A pullback in the next few days would not be unprecedented, which is what I see on my screen today.  

An additional way to position for a rally in natural gas futures

My colleague, Jay Kaeppel, published a note on natural gas seasonality on Monday. The cliff note version says seasonality is about to turn positive. Jay suggested one option for playing a rally in the commodity would be to allocate capital to the ETF (UNG). 

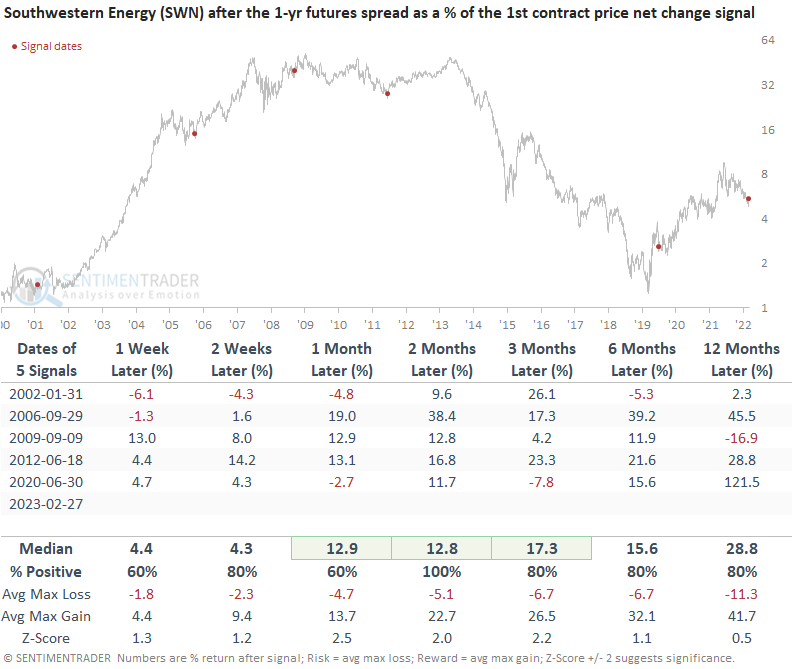
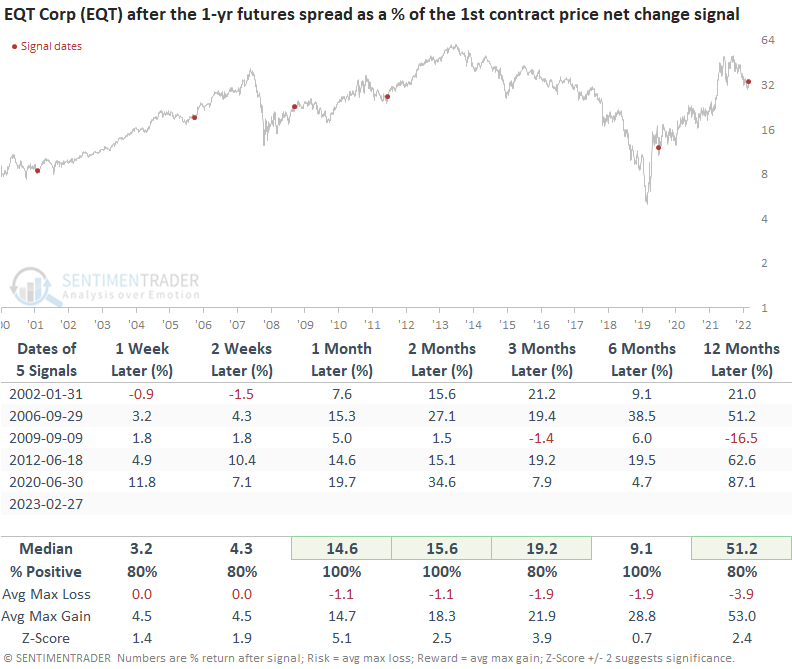
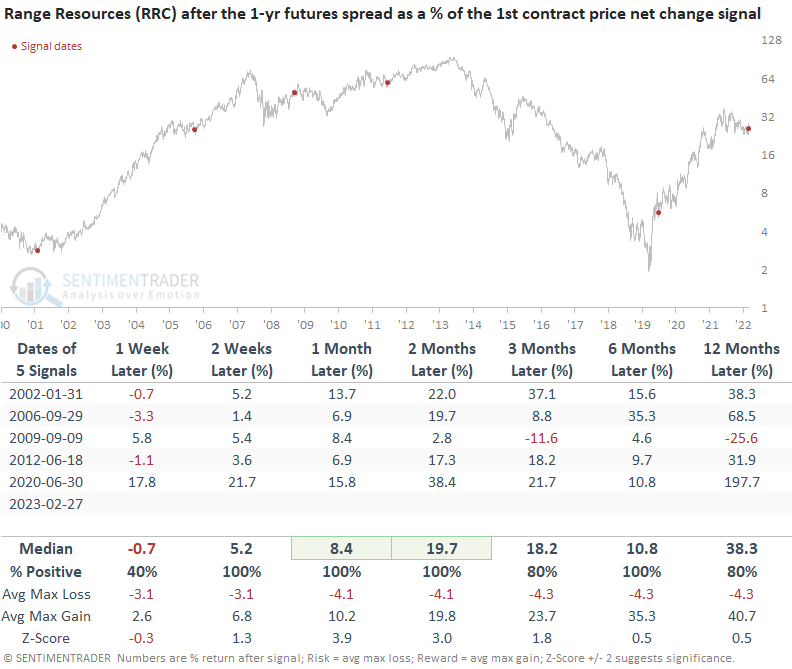
Another option would be natural gas stocks. As always, this is not a recommendation for any particular stock. The intent is to show an example of a potential outcome.

Natural gas stocks should trade higher as long as the commodity rhymes with history.


What the research tells us...

Natural gas prices plunged by the most significant amount in history over the last six months. In doing so, the 1-year futures spread as a percent of the 1st contract price declined by more than -60% and subsequently reversed higher, triggering a buy signal for natural gas. After similar spread signals, the commodity was higher every single time from one week to twelve months later. One possible way to play a rally in natural gas would be to allocate to stocks with a high correlation to the commodity. 

PRODUCTS
SentimenTrader
Trading Tools
Indicators & Data API
‍
Strategies & Scanner
‍
Research Reports
FREE
RESOUrCES
Simple Backtest
Calculator
Simple Seasonality
Calculator
The Kelly Criterion
Calculator
Sentiment Geo Map
‍
Public Research Reports
‍
Education
Sentiment Indicators
‍
Technical Indicators
‍
Pricing
Bundle pricing
‍
FAQ
‍
Announcements
‍
COMPANY
‍
About
‍
In the News
‍
Testimonials
‍
Client Success Stories
CONTACT
‍
General Inquiries
‍
Media Inquiries
‍
Financial Professionals Inquiries
‍
© 2026 Sundial Capital Research Inc. All rights reserved.
Setsail Marketing
TermsPrivacyAffiliate Program
Risk Disclosure: The information and tools provided are for research and analytical purposes only and are not intended as investment advice. Market analysis involves uncertainty, and outcomes may differ from expectations. Users should conduct their own due diligence and consider their individual circumstances before making any financial decisions. Past performance is not necessarily indicative of future results.

Hypothetical Performance Disclosure: Hypothetical performance results have many inherent limitations, some of which are described below. No representation is being made that any account will or is likely to achieve profits or losses similar to those shown; in fact, there are frequently sharp differences between hypothetical performance results and the actual results subsequently achieved by any particular trading program. One of the limitations of hypothetical performance results is that they are generally prepared with the benefit of hindsight. In addition, hypothetical trading does not involve financial risk, and no hypothetical trading record can completely account for the impact of financial risk of actual trading. for example, the ability to withstand losses or to adhere to a particular trading program in spite of trading losses are material points which can also adversely affect actual trading results. There are numerous other factors related to the markets in general or to the implementation of any specific trading program which cannot be fully accounted for in the preparation of hypothetical performance results and all which can adversely affect trading results.

Testimonial Disclosure: Testimonials appearing on this website may not be representative of other clients or customers and is not a guarantee of future performance or success.