Products
SentimenTrader Trading Tools
‍
Backtest Engine
My Trading Toolkit
Correlation Analysis
Seasonality
Market Prediction
Indicators & Data API
‍
Proprietary Indicators & Charts
Market Data API
Strategies & Scanner
‍
50+ Trading Strategies
Smart Stock Scanner
Smart Option Scanner
Research Reports
‍
Research Solutions
Reports Library
Free Resources
Simple Backtest Calculator
Simple Seasonality Calculator
The Kelly Criterion Calculator
Sentiment Geo Map
Public Research Reports
Education
Sentiment Indicators
Technical Indicators
Pricing
Company
About
In the News
Testimonials
Client Success Stories
Contact
Log inLoginSign up
< BACK TO ALL REPORTS

A rare buy signal from a TCTM composite thrust model component

Dean Christians
2022-07-21
NYSE up volume has surged relative to down volume, triggering an alert for a model with an 88% win rate. The algorithm is a component in the TCTM composite thrust model.

Key points:

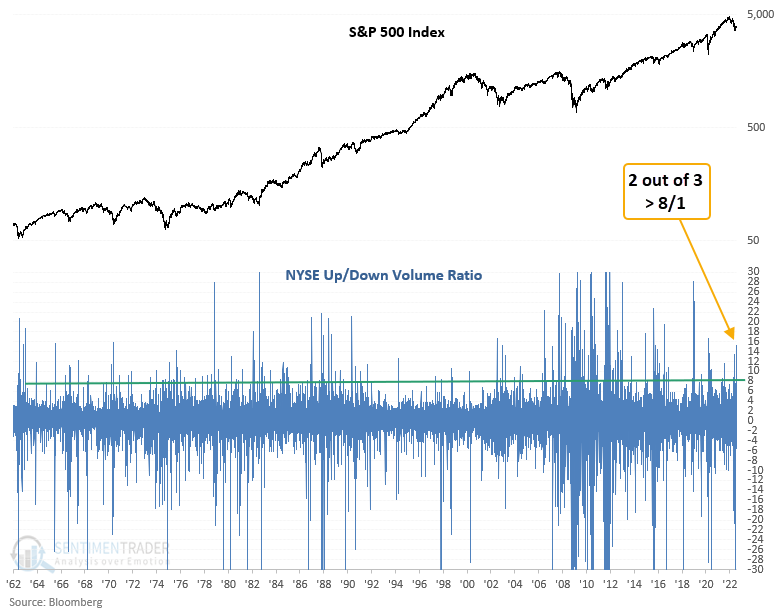
  • On Tuesday, the NYSE up/down volume ratio exceeded 8/1 for the 2nd time in the last 3 sessions
  • The surge in up volume relative to down volume triggered a new TCTM composite thrust model signal
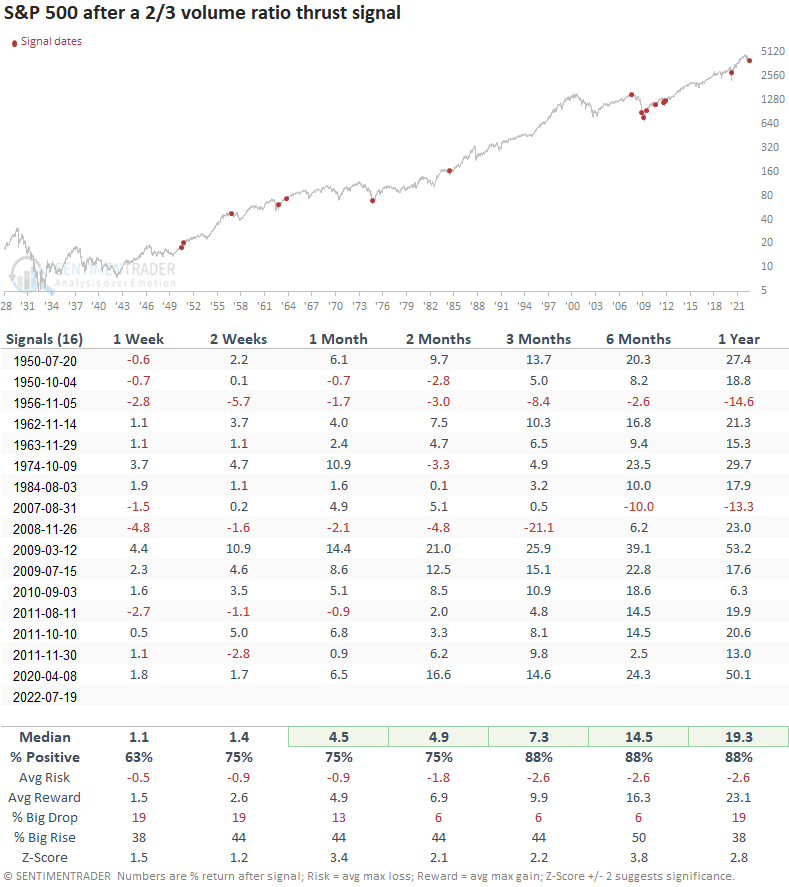
  • The S&P 500 rallied 88% of the time over the next 3, 6, & 12-month time frames after other signals

A short-duration volume indicator suggests panic buying

A new signal from a voting member in the TCTM Composite Thrust Model issued an alert at the close of trading on Tuesday. The component is called the 2/3 volume ratio thrust.

The algorithm identifies when the ratio between NYSE up and down volume exceeds 8/1 in 2 out of the last 3 sessions, with the pause coming in the middle. i.e., day 2. If the signal looks familiar, it's because Jason highlighted a similar volume-based surge in a note on Wednesday. 

Similar signals preceded gains 88% of the time

This model generated a signal 16 other times over the past 70 years. After the others, S&P 500 future returns, win rates, and z-scores were excellent across all time frames. The signal shows a gain at some point in the first three months in 14 out of 16 instances.

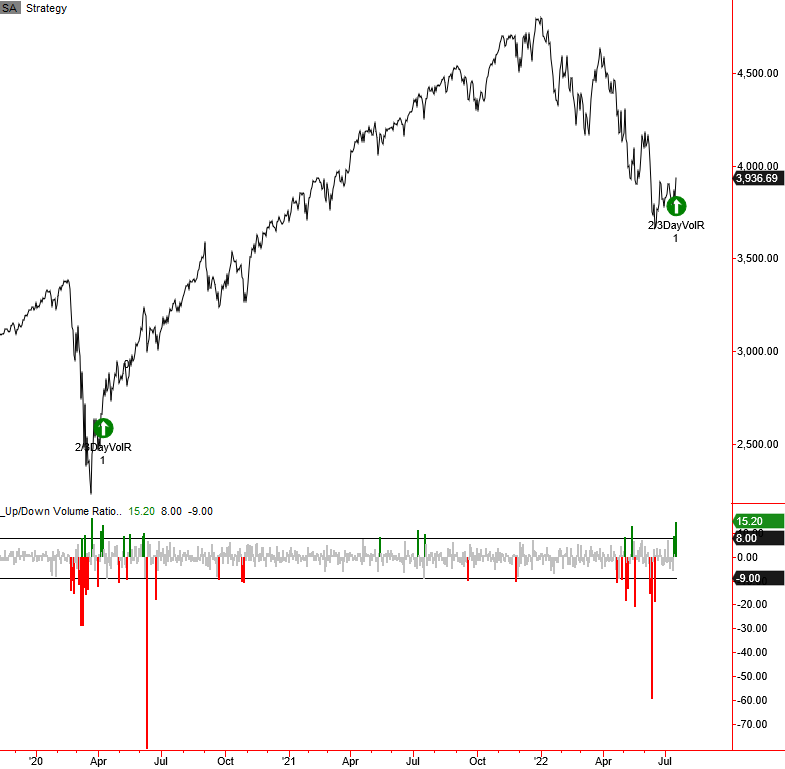
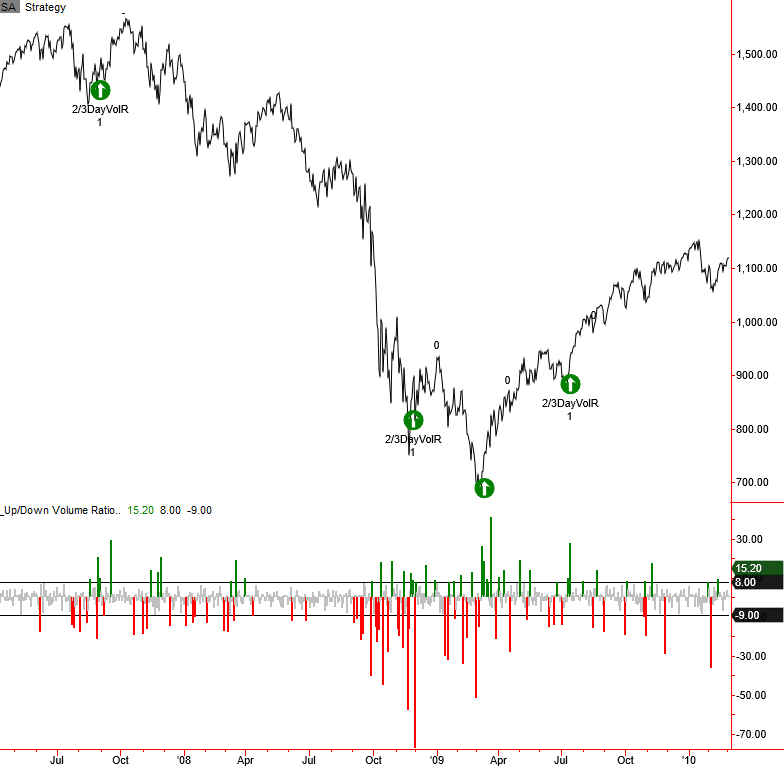
Let's zoom in and review some of the signals/charts since 1962. 

Current day chart example


2007-08 chart example

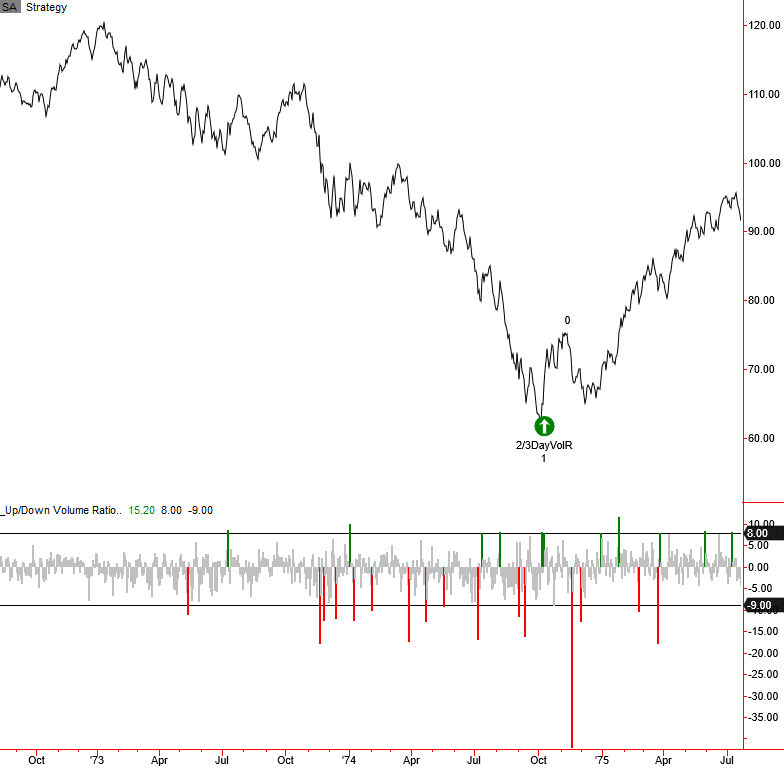
1973-74 chart example
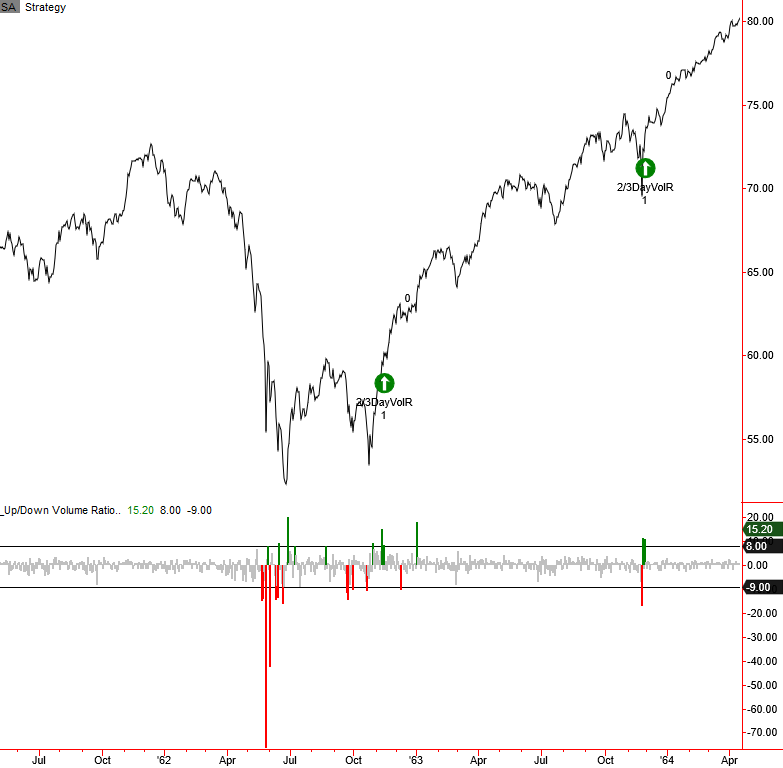
1962 chart example

The 2/3 volume ratio signal has an excellent track record. However, I would note the rarity of signals when compared to other components in the TCTM composite thrust model. 

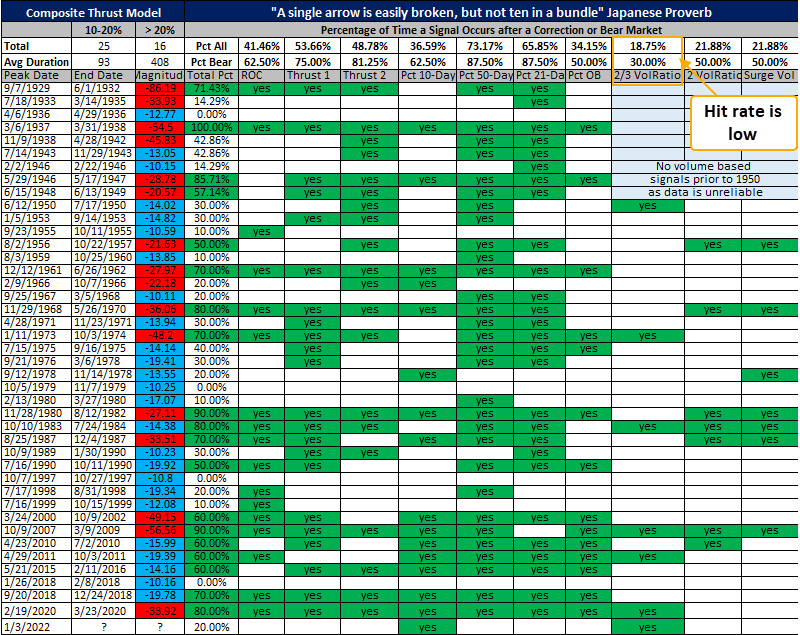
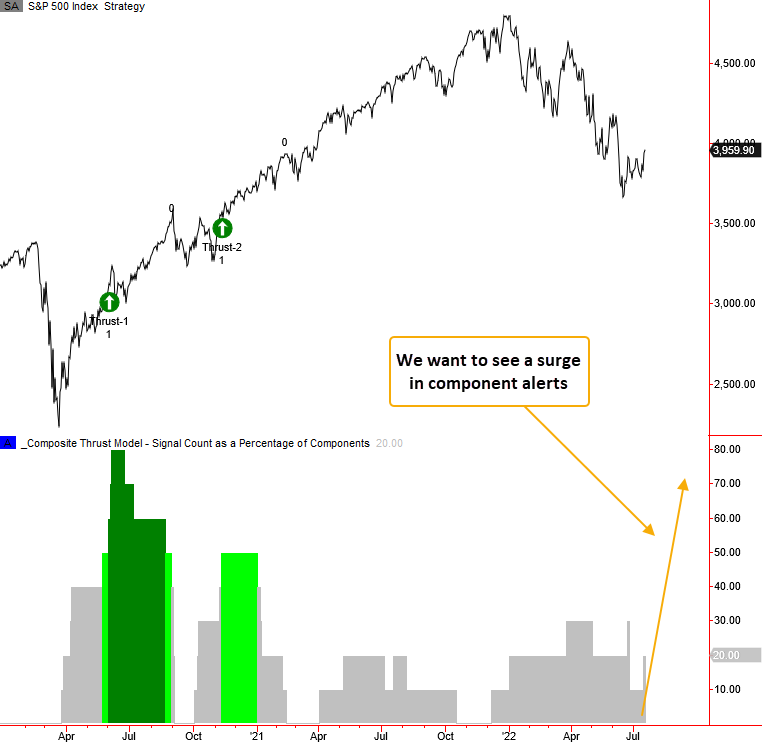
While a few short-duration components have triggered a signal in the current drawdown phase, we have not seen long-duration models like the percent above the 50-day or percent of issues at a 4-week high initiate an alert. One of the fundamental principles behind the composite thrust model is duration diversification. Using a broad range of input lengths for the indicators makes the model less likely to trigger a whipsaw signal.  

What the research tells us...

When the ratio between NYSE up and down volume exceeds 8/1 in 2 out of the last 3 sessions, the surge in up volume relative to down volume signals a sense of urgency on the part of buyers that typically leads to further positive momentum. Similar setups to what we're seeing now have preceded excellent returns, win rates, and z-scores across all time frames. 

PRODUCTS
SentimenTrader
Trading Tools
Indicators & Data API
‍
Strategies & Scanner
‍
Research Reports
FREE
RESOUrCES
Simple Backtest
Calculator
Simple Seasonality
Calculator
The Kelly Criterion
Calculator
Sentiment Geo Map
‍
Public Research Reports
‍
Education
Sentiment Indicators
‍
Technical Indicators
‍
Pricing
Bundle pricing
‍
FAQ
‍
Announcements
‍
COMPANY
‍
About
‍
In the News
‍
Testimonials
‍
Client Success Stories
CONTACT
‍
General Inquiries
‍
Media Inquiries
‍
Financial Professionals Inquiries
‍
© 2026 Sundial Capital Research Inc. All rights reserved.
Setsail Marketing
TermsPrivacyAffiliate Program
Risk Disclosure: The information and tools provided are for research and analytical purposes only and are not intended as investment advice. Market analysis involves uncertainty, and outcomes may differ from expectations. Users should conduct their own due diligence and consider their individual circumstances before making any financial decisions. Past performance is not necessarily indicative of future results.

Hypothetical Performance Disclosure: Hypothetical performance results have many inherent limitations, some of which are described below. No representation is being made that any account will or is likely to achieve profits or losses similar to those shown; in fact, there are frequently sharp differences between hypothetical performance results and the actual results subsequently achieved by any particular trading program. One of the limitations of hypothetical performance results is that they are generally prepared with the benefit of hindsight. In addition, hypothetical trading does not involve financial risk, and no hypothetical trading record can completely account for the impact of financial risk of actual trading. for example, the ability to withstand losses or to adhere to a particular trading program in spite of trading losses are material points which can also adversely affect actual trading results. There are numerous other factors related to the markets in general or to the implementation of any specific trading program which cannot be fully accounted for in the preparation of hypothetical performance results and all which can adversely affect trading results.

Testimonial Disclosure: Testimonials appearing on this website may not be representative of other clients or customers and is not a guarantee of future performance or success.