
A put/call ratio trading model triggers a buy signal for the energy sector

Key points:
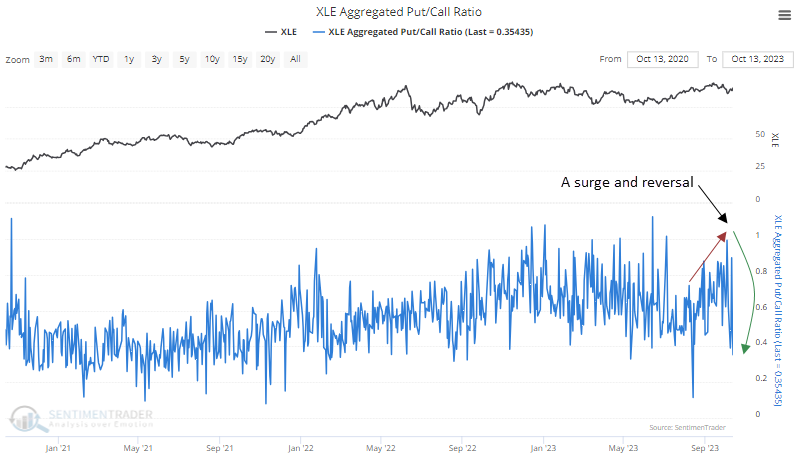
- The put/call ratio for the energy sector surged and subsequently reversed low, triggering a buy signal
- Similar shifts in sentiment led to excellent returns and win rates for the energy sector ETF (XLE)
- Absolute and relative trend score rankings for the energy sector suggest an improving backdrop
Measuring shifts in sentiment with the aggregated put/call ratio
Investors opt for call options to wager on price increases in bullish stock uptrends. Conversely, during bearish market conditions, they prefer put contracts to speculate or hedge against falling stock values. The put/call ratio can be used as a contrary indicator to identify when sentiment amongst traders has become too optimistic or pessimistic. When the sentiment pendulum swings too far one way, a market will likely snap back in the other direction.
A trading model that monitors the aggregated put/call ratio for the Energy ETF (XLE) surged, indicating fear amongst energy traders. Subsequently, it reversed lower, triggering a buy signal.
A trading model that identifies a reversal in the aggregated put/call ratio
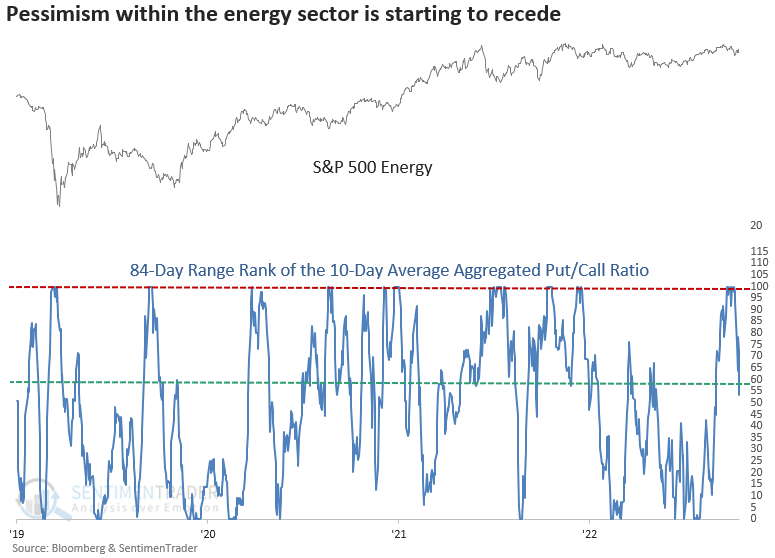
The put/call ratio trading model applies an 84-day range rank to a 10-day moving average of the XLE aggregated put/call ratio. A pessimistic reset condition becomes active when the range rank indicator climbs above the 99th percentile. Once confirmed, a new buy signal triggers after the range rank falls below the 57th percentile and market momentum for the XLE ETF turns positive in five sessions or fewer.
Similar aggregated put/call ratio signals preceded positive returns
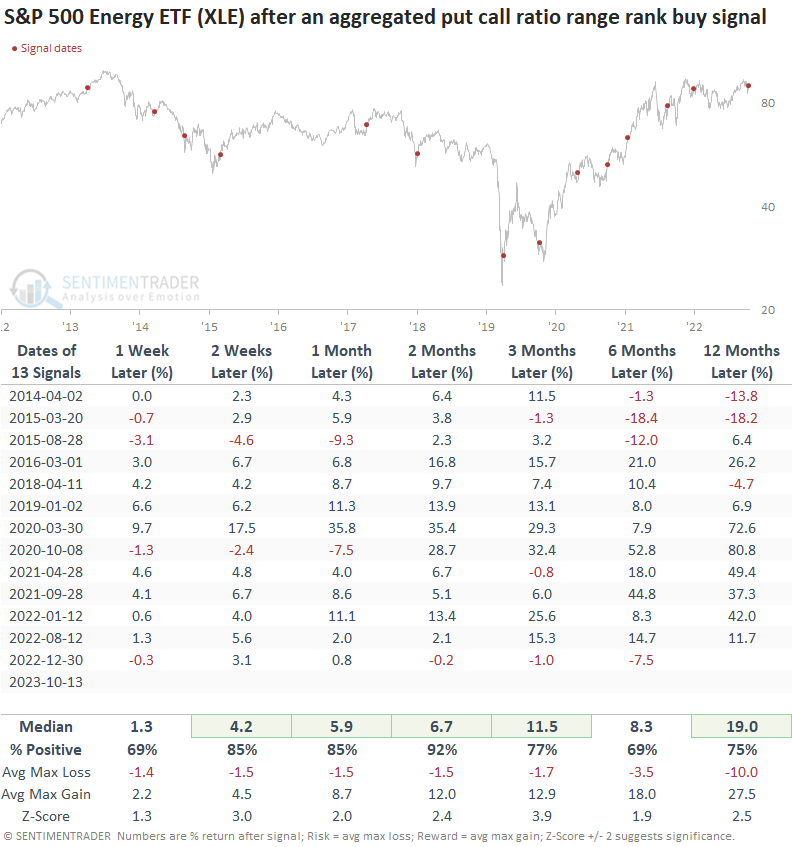
While the sample size is small due to limited data, results are excellent despite several signals occurring in extremely unfavorable conditions. The previous signal is the only precedent to show a loss at the two-month horizon. However, that alert displayed a max gain of 6.4% in the first month before faltering.
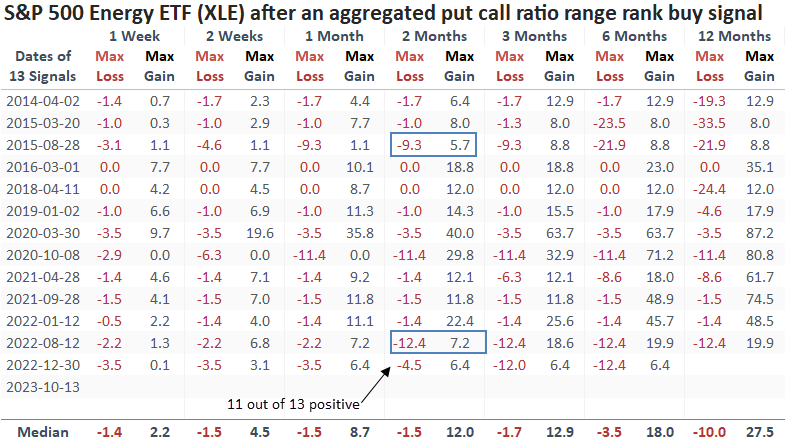
Risk reward was favorable over the following two months, with 11 out of 13 signals showing a max gain that exceeded the max loss.
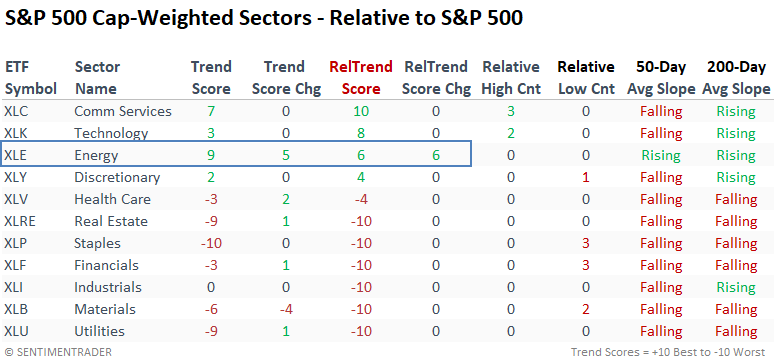
The energy sector is near the top of the absolute and relative trend score rankings
Last week, the absolute and relative trend scores for the S&P 500 energy sector ETF (XLE) jumped five and six points, respectively. And it's the only sector to maintain a rising 50 and 200-day moving average.
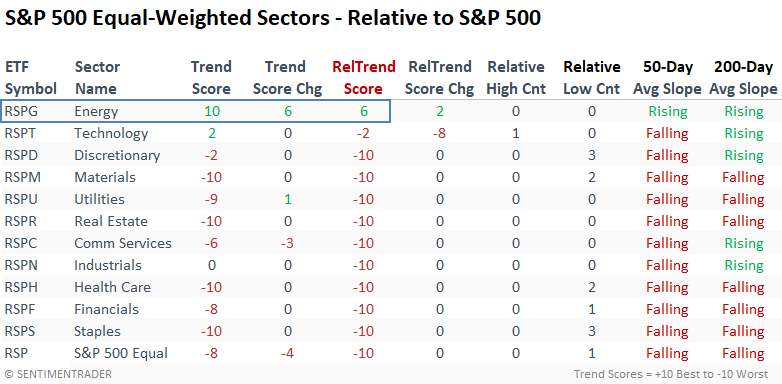
The equal-weighted S&P 500 energy sector ETF (RSPG) is the only group to maintain a positive absolute and relative strength score versus the cap-weighted index.
When I searched back to 1960, I found only one instance in history when the equal-weighted energy sector had a positive relative trend score, with all the other sectors exhibiting a negative profile. That precedent occurred in January 1973.
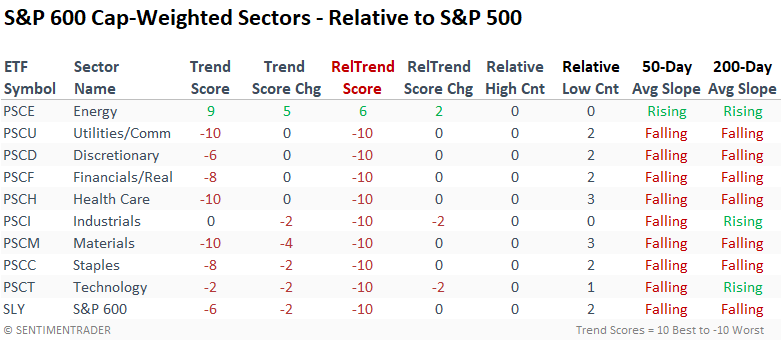
Similar to the large-cap equal-weighted sector trends, the small-cap energy sector looks favorable versus the S&P 500 and really stands out compared to other groups within the small-cap space.
Within industry group ETFs, energy and insurance maintain a favorable profile versus the S&P 500 in an otherwise weak backdrop for most groups.

What the research tells us...
The aggregated put/call ratio for the Energy sector surged higher, indicating fear amongst traders. It has subsequently reversed lower, triggering a buy signal for a trading model that monitors shifts in sentiment. Similar reversals led to excellent returns and win rates regardless of the market environment, highlighting the efficacy of sentiment-based indicators like the put/call ratio. With the upswing in energy stock prices, the sector's absolute and relative trend scores have improved, suggesting a more favorable backdrop.
While the put/call trading model has an excellent historical record, one must acknowledge that the turmoil in the Middle East impacted crude oil and energy stocks bullishly. So, this time could be different.