
A pullback in an uptrend - or something worse?

Key points
- Numerous indicators are - or have recently - flashed "oversold in an uptrend" signals
- As long as the majority of major market indexes hold above their long-term averages, the "normal correction" argument holds water
- But there are no guarantees, and investors must continue to respect the trend
How the market works
A classic market cycle typically plays out something like this:
- After months or years of declining stock prices, the market turns higher - usually unexpectedly and with some surprising early strength (breadth thrusts are common)
- The major market indexes rise above their respective 200-day moving averages, and those averages reverse from downtrend to uptrend
- The market trends higher for many months and sometimes years
- Along the way, there are pullbacks - often, the entire pullback plays out with the (majority of) major market indexes holding above their respective 200-day moving average; Sometimes, the indexes dip below their 200-day moving average before reversing, thus creating a whipsaw (which sees some investors bail out and then either have to scramble to get back in, or get left behind as the market powers higher once again)
- Invariably, market pullbacks in an uptrend are marked by oversold readings in any number of overbought/oversold technical indicators; This can happen repeatedly during a bull market - in each case, the market declines, and the oversold indicators start to flash green
- In most cases, this oversold situation is a buying opportunity…
- …UNTIL one day when it is NOT; One day, the stock market tops out, declines, gets oversold, BUT DOES NOT bounce back meaningfully. From there, a new bear market unfolds
Where we are now
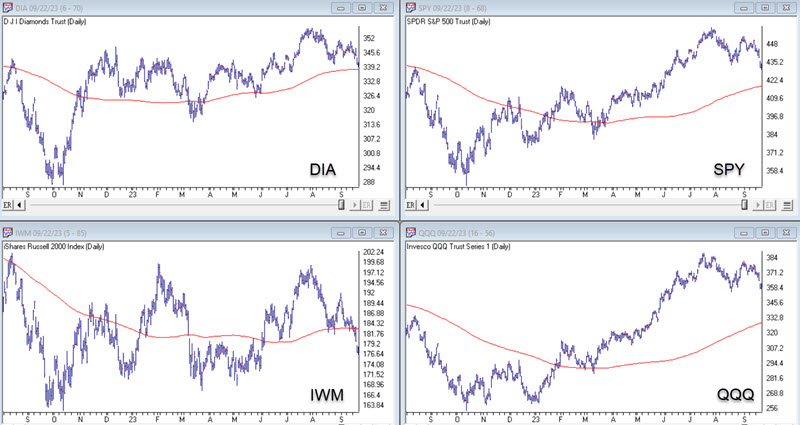
We are presently in Stage 5, described above - most of the market indexes are still above their respective 200-day moving average (with the notable exception of the Russell 2000 small-cap index), and numerous technical indicators have been or are currently flashing oversold signals. The charts below (courtesy of AIQ Systems) highlight ETFs that track four major stock market indexes. Three indexes remain above their 200-day average - with the Russell 2000 small-cap index as the exception.
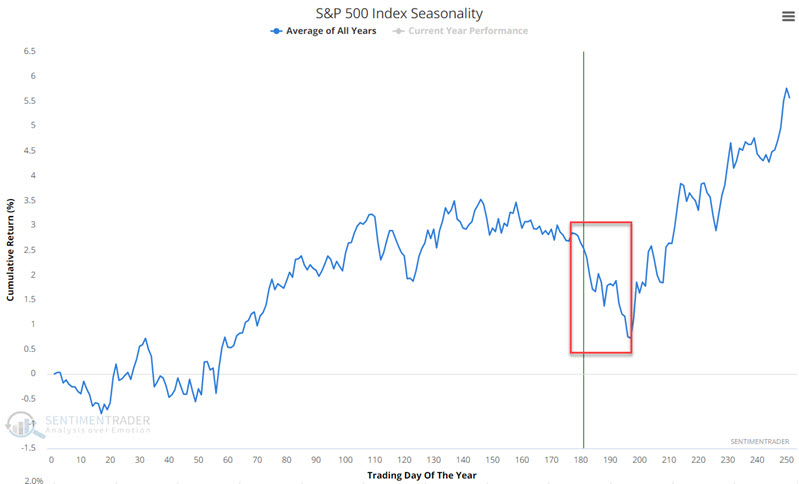
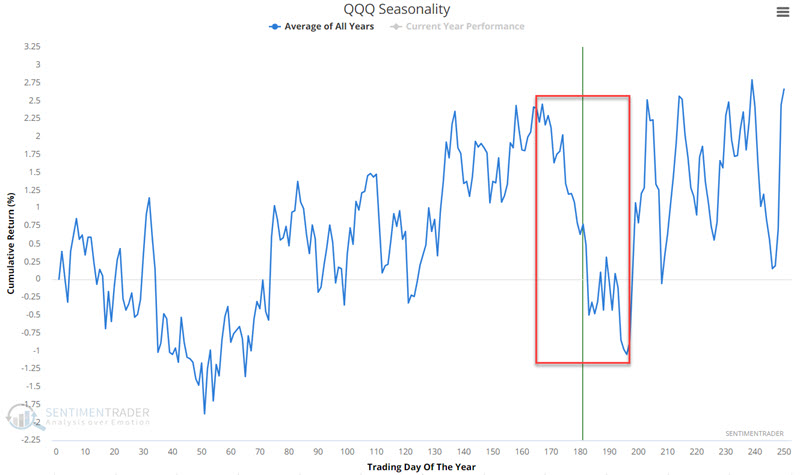
Given the strength of the advance through the first seven months of the year and the general seasonal pattern for stocks (i.e., often experiencing weakness during mid-September into mid-October), a market pullback should probably not come as a surprise.
The question now for investors is, "Do we hold in Stage #6, or are we starting #7?" I do not have the prescience to answer that question in advance. I can only follow objective indicators and try to latch on to new trends as early as possible. The current status is "oversold in an uptrend," which suggests that the recent decline would ultimately end up as a buying opportunity. However, if the other major averages break down further, a re-examination will be in order.
In the meantime, the oversold signals continue to pile up.
Major Sector Breadth reaches a washed-out level
Our Major Sector Breadth (% above 50-Day Avg) indicator shows the percentage of 11 major sectors trading above their 50-day moving averages. It includes technology, energy, financials, health care, utilities, consumer discretionary, consumer staples, industrials, communications, materials, and real estate. The chart below highlights those dates when the Major Sector Breadth (% above 50-Day Avg) indicator was below 10% while the S&P 500 Index was above its 200-day moving average (i.e., a pullback in an uptrend).
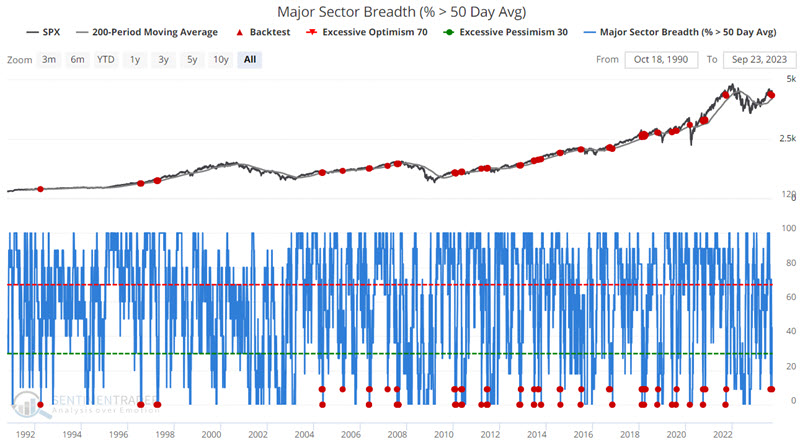
The table below summarizes the S&P 500 Index performance following the signals in the chart above.
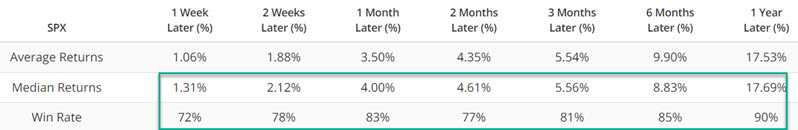
In a nutshell, the signals in mid-2007 and late 2021 were significant losers. All others saw the market advance in the ensuing 12 months.
High beta versus High quality indicating some signs of panic
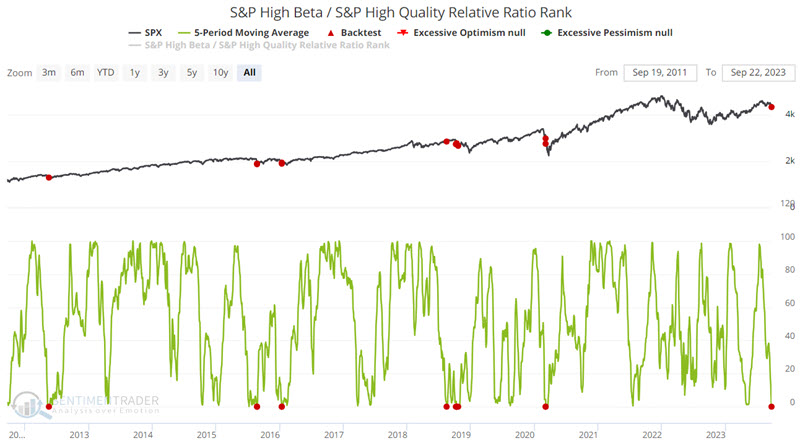
Our S&P High Beta / S&P High-Quality Relative Ratio Rank indicator shows where the ratio is relative to its range over the past four months. One sign of growing fear in the market is signaled by a decline in the performance of high beta (i.e., more volatile, high-risk, high-reward types of stocks) relative to high-quality stocks. A sharp decline in the S&P High Beta / S&P High-Quality Relative Ratio Rank indicator can signal a "flight to safety" as investors abandon volatile stocks for the perceived safety of higher-quality stocks.
The chart below highlights those dates when the 5-day moving average of the S&P High Beta / S&P High-Quality Relative Ratio Rank equals 0.
The table below summarizes the S&P 500 Index performance following the signals in the chart above.
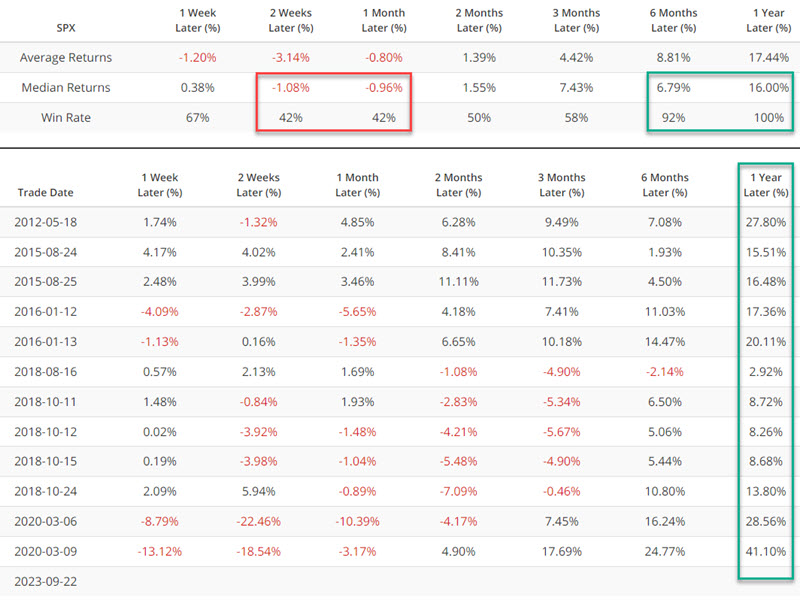
Returns during the first two months after a signal has been hit-or-miss. However - and more importantly to longer-term investors - 6 to 12-month returns have been consistently favorable.
A compendium of other recent oversold signals
More evidence of a potential "oversold in an uptrend" scenario can be found here, here, here, here, here, and here.
What the research tells us…
Based on everything highlighted above, a strong case can be made that we are presently experiencing a normal correction within a more significant uptrend. However - as always - no guarantees can be issued. The argument remains strong as long as the S&P 500, Nasdaq 100, and Dow Industrials hold above their respective 200-day moving averages. If these indexes break down below their long-term averages, investors will be faced with a decision regarding whether or not to reduce exposure to stocks.