
A pullback in an uptrend (also indicators versus trading systems)

Key points
- Indicators convey single pieces of information; trading systems generate actual buy and sell signals
- Can a single indicator be used as a trading system? Yes... but it carries risks
- An oversold indicator recently flashed a signal - we will look at what happens if we use this indicator as a trading system
A word on indicators versus trading systems
I am fond of saying:
- Not every squiggle of every indicator "means something."
- Not every signal from every indicator is an automatic buy or sell signal
- Not every indicator is a trading system
An indicator typically conveys one piece of information. That is different from a trading system, which is designed to generate specific buy and sell signals. Most indicator signals are best used as "weight of the evidence" rather than as trading signals. That said, it is often helpful to test the usefulness of a given indicator as if it were a trading system (with the understanding that you will most likely not use it in that manner). Let's consider an example.
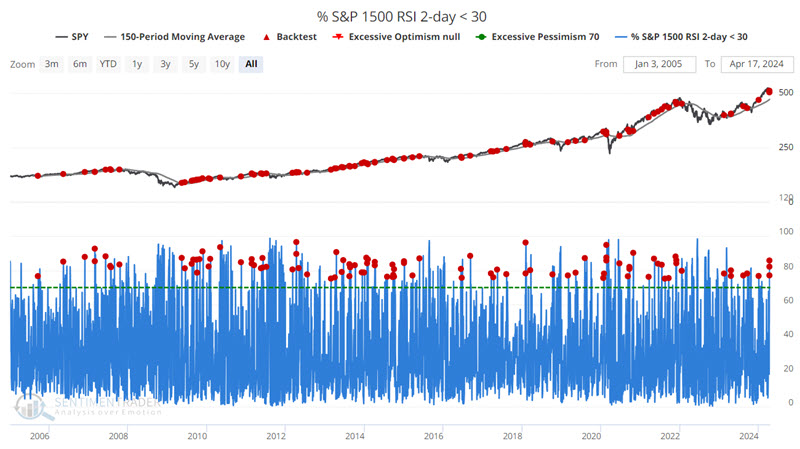
The % S&P 1500 RSI 2-day < 30 indicator reaches oversold
The chart below highlights with a red dot those dates when:
- The % of S&P 1500 stocks with a 2-day RSI is above 75%
- AND the S&P 500 Index closed above its 150-day moving average
These rules are essentially a rudimentary attempt to identify a pullback in an uptrend.
The table below summarizes subsequent S&P 500 performance.
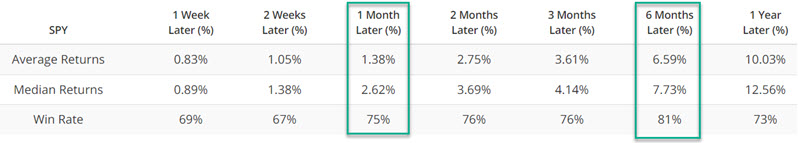
In the table above, we note that 1-month results show a Win Rate of 75%, and 6-month results show a Win Rate of 81%. Let's review what results would have looked like if we had used this signal as an automatic "buy and hold for one month" or "buy and hold for six months" strategy.
One thing to note is that there are many overlapping signals in the raw results, i.e., new signals that occur within one month (or six months) of a previous signal. We will treat any overlapping as a continuation signal. For example:
- A new signal occurs, triggering a buy signal and a one-month holding period
- Within that month, another signal occurs
- This new signal extends the holding period for another month
For these tests, no stop-loss provision is included.
The same will be true for the six-month test. A new indicator within an existing six-month holding period will extend the holding period an additional six months and we will apply no stop-loss provision.
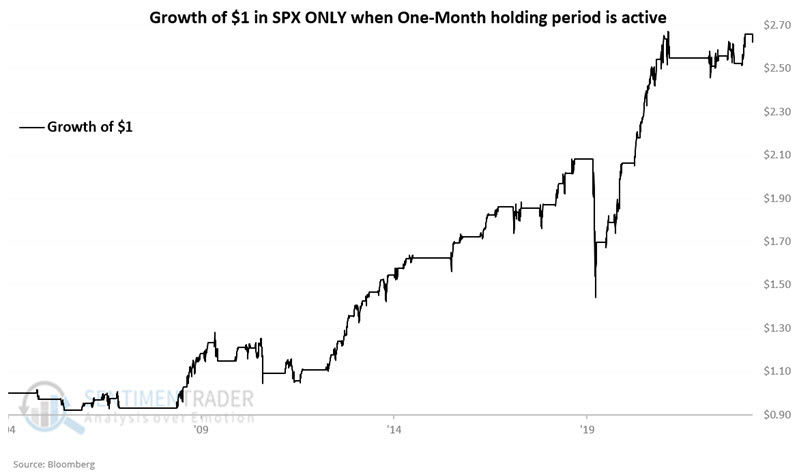
The one-month strategy
We will technically use a 21-trading day holding period for a one-month strategy. The first signal occurred on 2005-09-21. Because there were no new signals within a month of that date, the holding period ended on 2005-10-20. The chart below displays the hypothetical growth of $1 invested in the S&P 500 Index only when a trading signal is active.
The table below summarizes trading results.
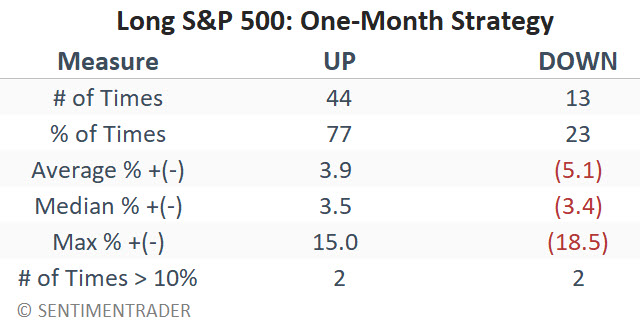
Is this a viable trading strategy? That is up to each trader to decide. The good news is the 77% win rate; the bad news is some sharp declines, particularly in 2011 and 2020.
The six-month strategy
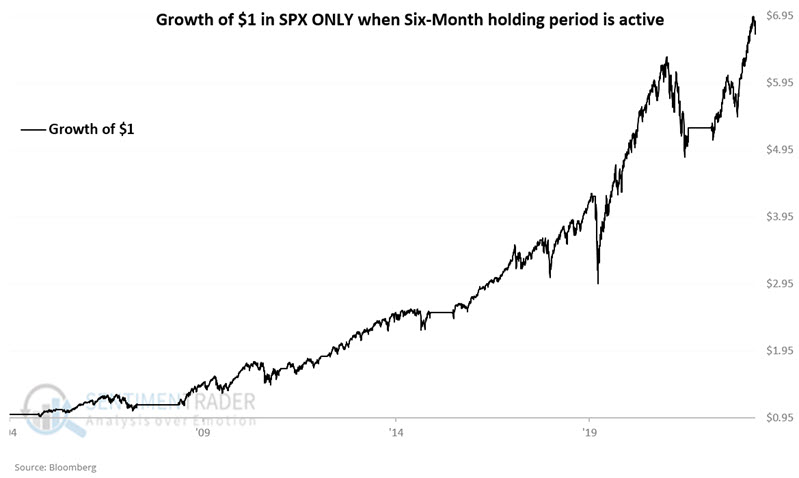
For a six-month strategy, we will technically use a 126-trading-day holding period. The first signal occurred on 2005-09-21. Because there were no new signals within a month of that date, the holding period ended on 2006-03-23. The chart below displays the hypothetical growth of $1 invested in the S&P 500 Index only when a trading signal is active. Because overlapping signals are common and because of the relatively long holding period, this approach is in the market most of the time.
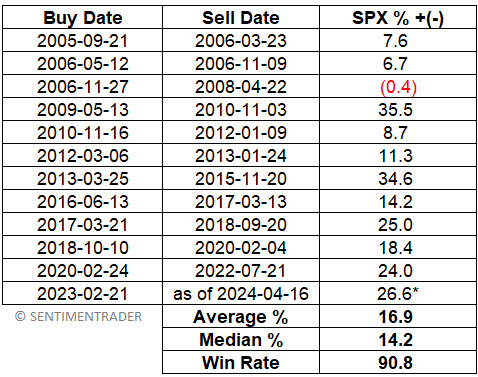
The table below shows the hypothetical trading dates and results.
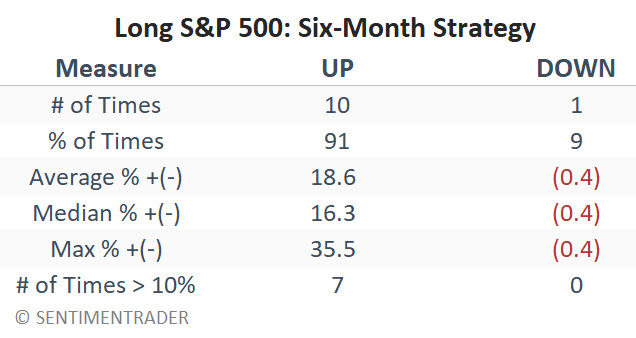
The table below summarizes trading results.
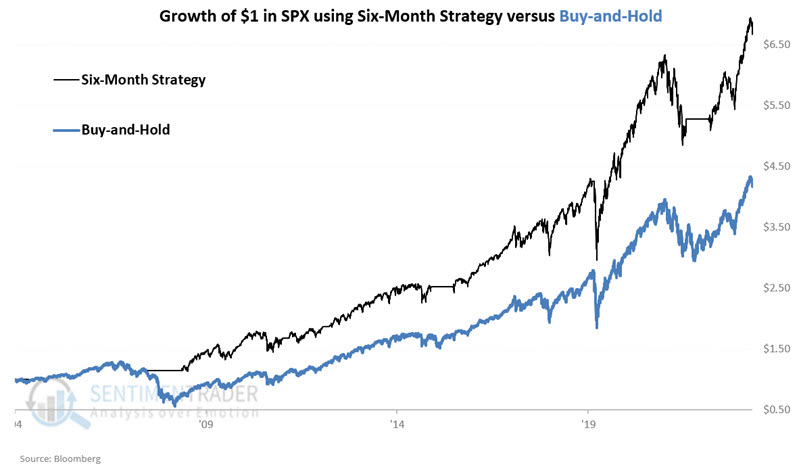
Another thing to note is that the six-month strategy outperformed buy-and-hold, as shown in the chart below.
When viewed in table format, the results seem pretty compelling. We see a 91% Win Rate with a maximum loss of a mere -0.4%! However, as we can see in the equity curve chart above, these summary results mask much of the intra-trade volatility. The chart below shows the maximum drawdowns for the six-month strategy.
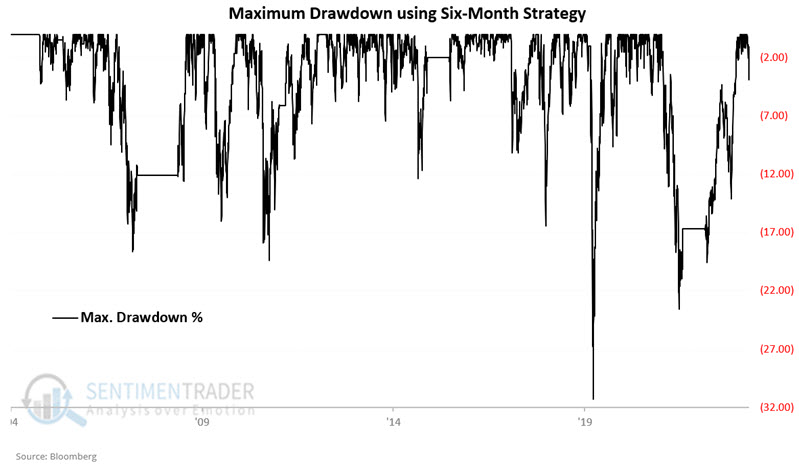
A maximum drawdown of -31.3% differs from claiming that "the only losing trade lost just -0.4%." The good news is that -31.3% is still quite a bit better than the -56.8% maximum drawdown suffered using a buy-and-hold strategy.
What the research tells us…
So, can one turn the indicator signal detailed above into a trading system that generates specific buy and sell signals? Technically, yes. The real question, however, is, "Should one?" The answer to that question is up to each trader to decide based on their temperament and risk tolerance. Regardless of one's answer to that question, it is worth noting that the stock market has recently experienced a pullback (based on the % of S&P 1500 stocks with a 2-day RSI < 30%) within a larger uptrend (based on SPX holding above its 150-day moving average). Whether used systematically or not, the results above tell us that this configuration often results in decent trading opportunities.