
A prolonged stretch of negative momentum not seen since the Dotcom bust

Key points:
- The Relative Strength Index (RSI) for the S&P 500 has remained below 50 for two months straight
- Similar streaks saw the large-cap index struggle over the next month, followed by a rebound
- In 82% of past cases, the events took place during bear markets
Has price momentum become so bad that it's good?
Last week, my colleague Jay Kaeppel highlighted our proprietary Risk On/Off indicator, suggesting that the percentage of components in risk-off status had become so bad that it's good for stocks. A popular technical indicator, the Relative Strength Index (RSI), which measures price momentum for an asset, could provide a similar market message, depending on one's time horizon.
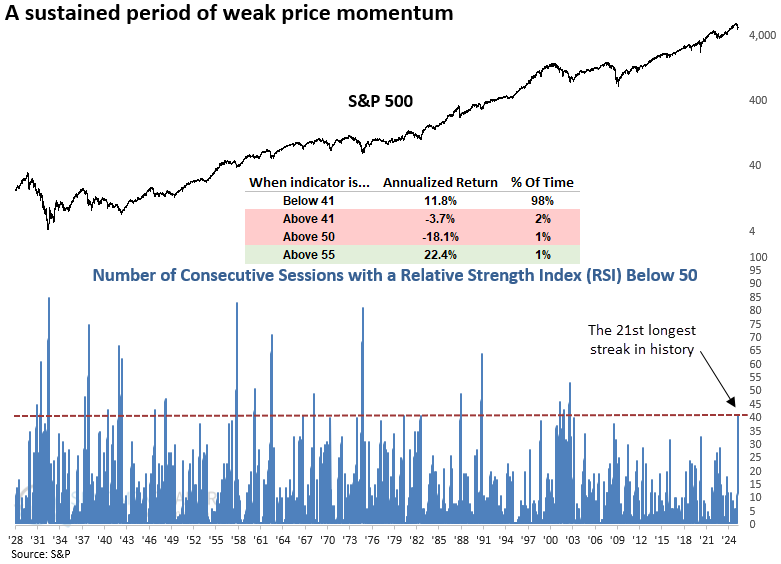
Over the past two months, the S&P 500 has exhibited weak price momentum, with its RSI stuck below 50, marking the most extended streak since the 2000-02 bear market and the 21st longest in nearly a century of data.
The chart below shows that the S&P 500 delivered an annualized return of -3.7% after the RSI count reached 41 sessions (roughly two months), deteriorating further to -18% as the streak hit 50. Only at 55 sessions did performance shift into positive territory.
This report falls into the observation category, providing a historical perspective, rather than an actionable trading signal.
Similar price momentum backdrops suggest a cautious near-term outlook
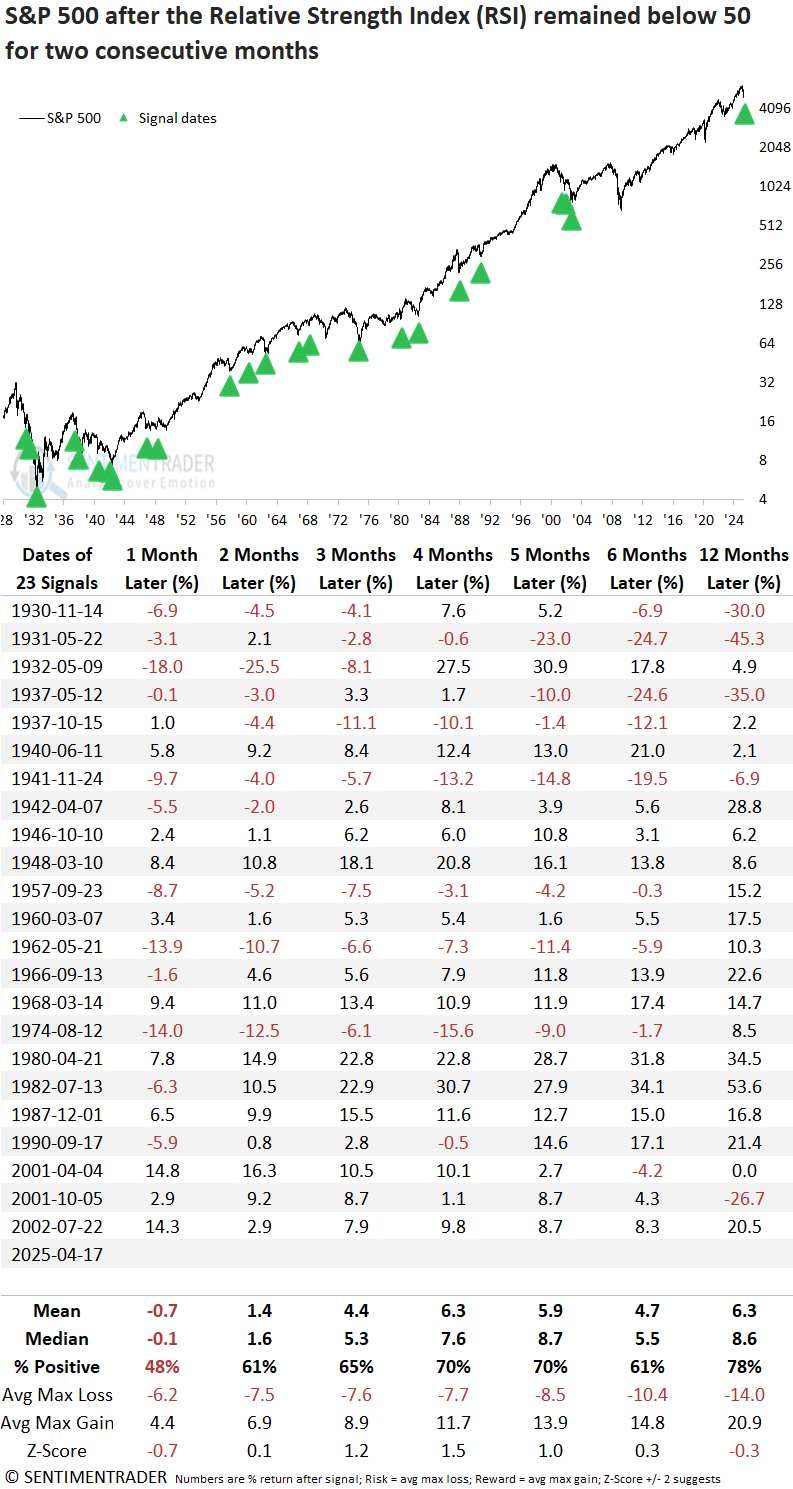
Each time the S&P 500's RSI stayed below 50 for 41 consecutive sessions, the index struggled over the next month. Once that stretch ended, performance gradually improved, with returns and win rates climbing steadily through the five-month mark. One year later, the index was higher 78% of the time, and since 1942, there's been only one loss.
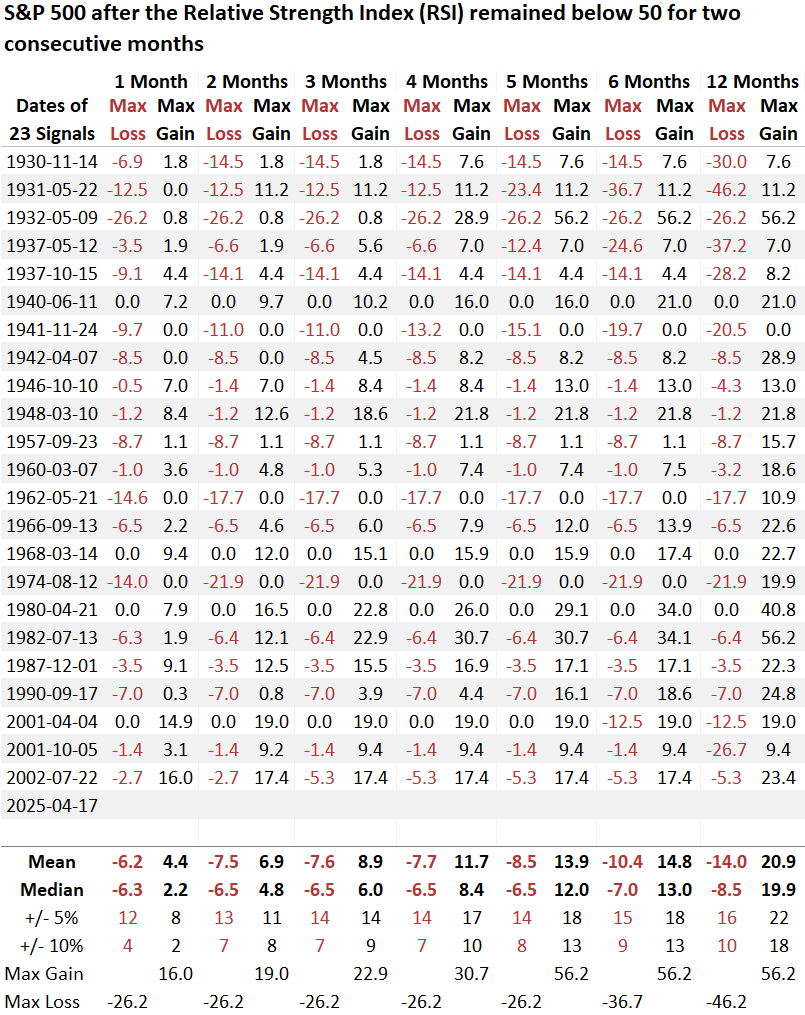
Although conditions began to improve around the two-month mark, the mean and median maximum losses still exceeded the corresponding maximum gains, indicating that risk continued to outweigh reward slightly beyond the one-month timeframe.
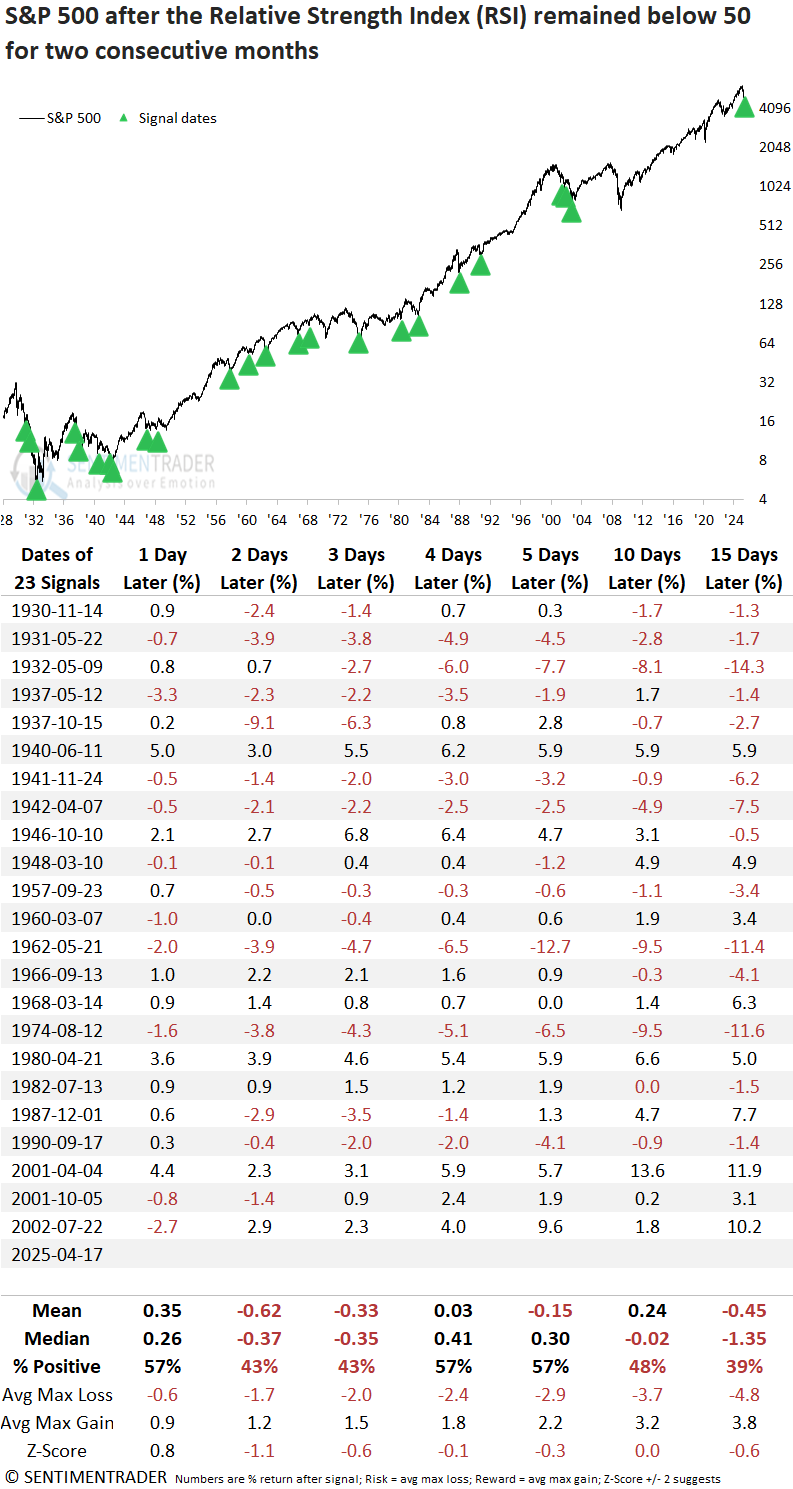
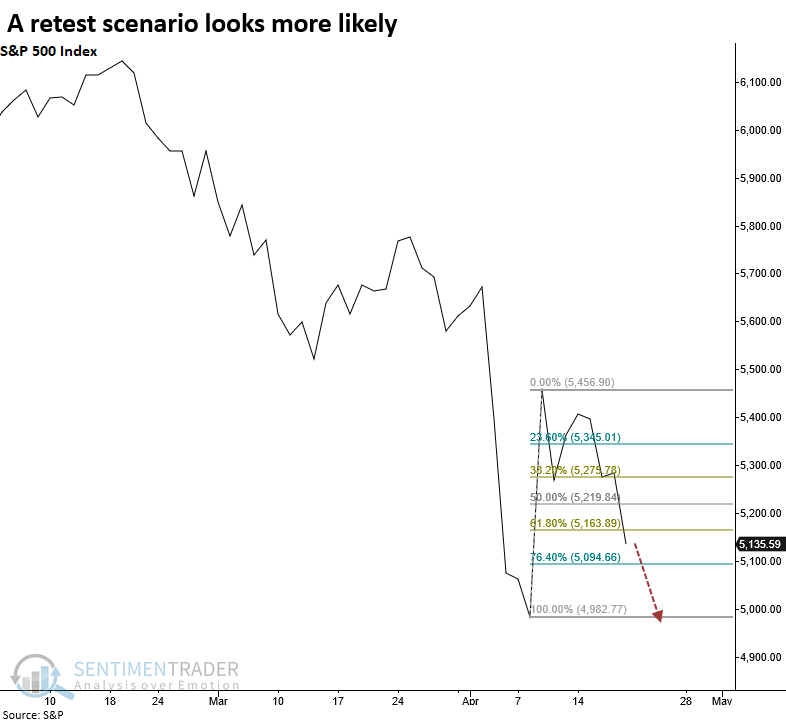
Over short-term horizons of one to fifteen sessions, the S&P 500's three-week outlook delivered the weakest performance of any interval. With the index having retraced half of its relief rally from 4982 to 5456, the unfavorable momentum backdrop doesn't bode well for stocks, raising the odds of a retest of the recent lows.
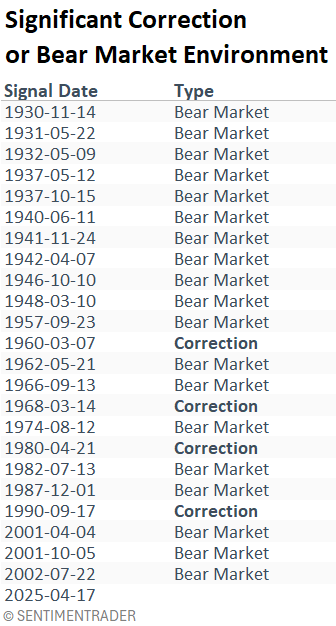
The odds suggest a bear market
Of the 23 prior occasions when the RSI held below the 50 level for 41 consecutive sessions, 19 (or 82%) coincided with bear market conditions.
If today's decline persists into the close, the S&P 500 will have retraced more than 62% of the rally from 4982 to 5456, bringing a potential retest of the April 8th low into focus.
What the research tells us...
The S&P 500's Relative Strength Index (RSI), a widely followed measure of price momentum, has remained below 50 for the past two months, indicating weak price momentum. Similar RSI behavior has coincided with bear market conditions in 82% of past instances. Although the world's most benchmarked index may struggle over the next month as downward pressure persists, history also shows that after such periods of prolonged RSI weakness, the S&P 500 often rebounds over medium to long-term horizons. That was especially the case since 1942 when all but one instance showed a gain a year later. With the RSI signaling short-term vulnerability, another test of the recent low seems probable. Remember, any bottoming process will hinge on fewer stocks registering new lows.