Products
SentimenTrader Trading Tools
‍
Backtest Engine
My Trading Toolkit
Correlation Analysis
Seasonality
Market Prediction
Indicators & Data API
‍
Proprietary Indicators & Charts
Market Data API
Strategies & Scanner
‍
50+ Trading Strategies
Smart Stock Scanner
Smart Option Scanner
Research Reports
‍
Research Solutions
Reports Library
Free Resources
Simple Backtest Calculator
Simple Seasonality Calculator
The Kelly Criterion Calculator
Sentiment Geo Map
Public Research Reports
Education
Sentiment Indicators
Technical Indicators
Pricing
Company
About
In the News
Testimonials
Client Success Stories
Contact
Log inLoginSign up
< BACK TO ALL REPORTS

A powerful indicator combination for technology stocks is in play

Jay Kaeppel
2025-07-28

One of my favorite combinations of indicators (that almost no one else is even aware of) is Component Correlation and Insider Buying.

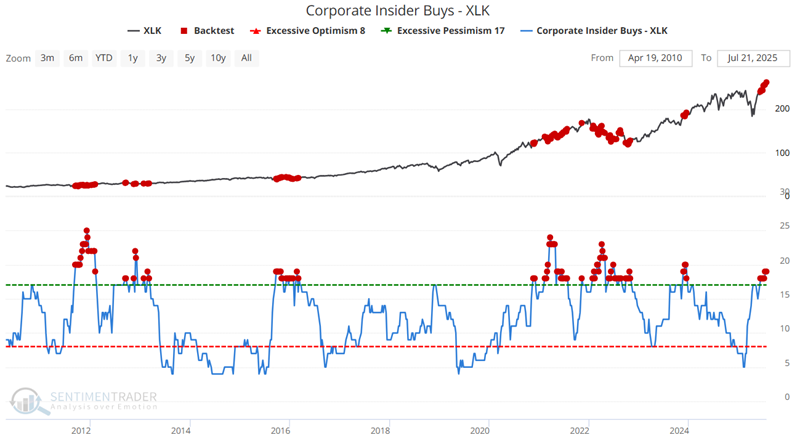
Corporate Insider Buying - XLK shows the total number of corporate insiders of companies covered by the XLK ETF that have bought shares on the open market during the past six months. Because insiders typically only buy if they have confidence that their company (and stock) will do well, insider buying is considered a stronger signal than insider selling. When buying picks up quickly and dramatically, it tends to be a very good sign for the stock market.

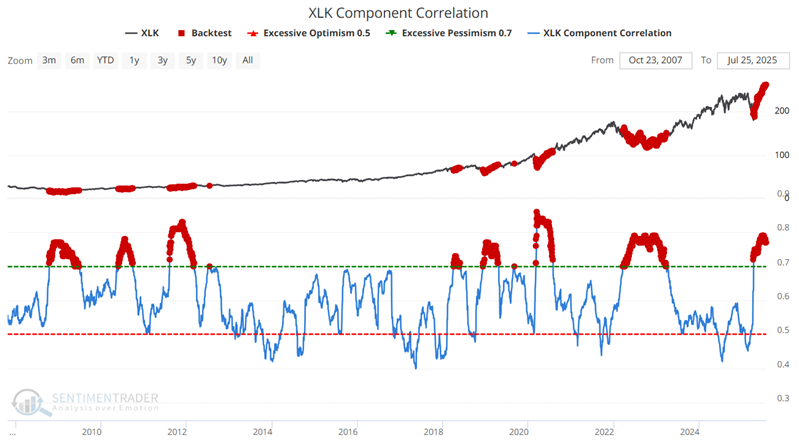
XLK Component Correlation shows the correlation among members of the S&P 500 Technology sector. During times of panic, investors tend to buy or sell "everything" together, no matter their individual merits, so correlation rises. The higher it goes, the more we see groupthink, which tends to happen at times of extreme pessimism, and is thus usually a positive for stocks in the future.

When both indicators are at a high level, it tells us that:

  • The insiders are bullish
  • The investing masses are wary

This is not a "precision market timing" tool, but it tends to be a good time to accumulate shares.

To view these two indicators together, I first select "Corporate Insider Buys - XLK" from the "Indicators | Stock Indicator List" menu. Then, in the lower right-hand corner, select "Choose a Secondary Indicator" and start typing "XLK Component Correlation" and select that indicator.

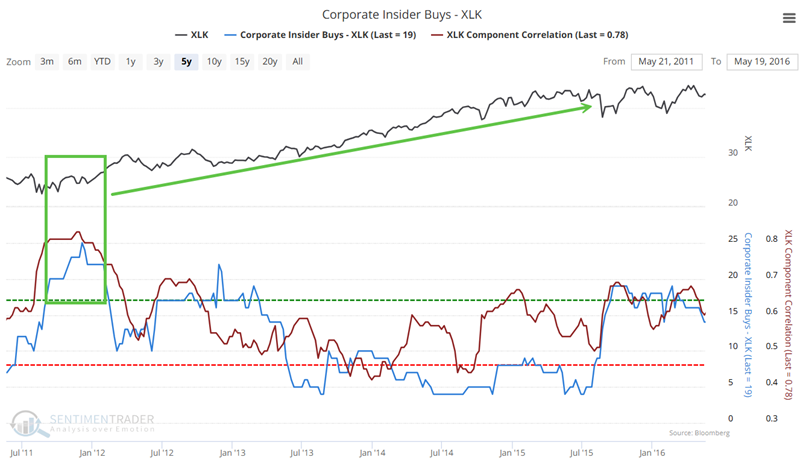
Below we see Insider Buys above 17 and Component Correlation above 0.70 during the 2011-2012 weakness. XLK rallied 75% over the next several years.

2022 we saw another period of high insider buying and component correlation. XLK has advanced over 50% in two years.

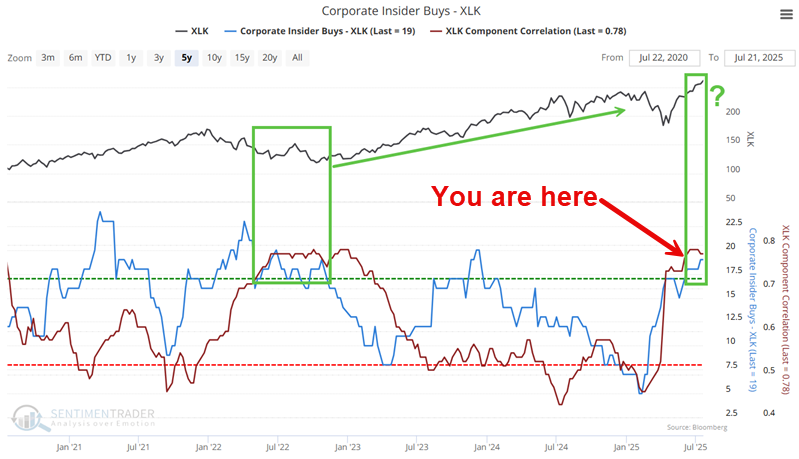
At the far right of the chart above, we see another period of strong insider buying and high component correlation happening in real-time. Does this guarantee a continued rally for XLK? Not necessarily. But history suggests giving the bullish case for tech the benefit of the doubt until it gives a reason not to.

PRODUCTS
SentimenTrader
Trading Tools
Indicators & Data API
‍
Strategies & Scanner
‍
Research Reports
FREE
RESOUrCES
Simple Backtest
Calculator
Simple Seasonality
Calculator
The Kelly Criterion
Calculator
Sentiment Geo Map
‍
Public Research Reports
‍
Education
Sentiment Indicators
‍
Technical Indicators
‍
Pricing
Bundle pricing
‍
FAQ
‍
Announcements
‍
COMPANY
‍
About
‍
In the News
‍
Testimonials
‍
Client Success Stories
CONTACT
‍
General Inquiries
‍
Media Inquiries
‍
Financial Professionals Inquiries
‍
© 2026 Sundial Capital Research Inc. All rights reserved.
Setsail Marketing
TermsPrivacyAffiliate Program
Risk Disclosure: The information and tools provided are for research and analytical purposes only and are not intended as investment advice. Market analysis involves uncertainty, and outcomes may differ from expectations. Users should conduct their own due diligence and consider their individual circumstances before making any financial decisions. Past performance is not necessarily indicative of future results.

Hypothetical Performance Disclosure: Hypothetical performance results have many inherent limitations, some of which are described below. No representation is being made that any account will or is likely to achieve profits or losses similar to those shown; in fact, there are frequently sharp differences between hypothetical performance results and the actual results subsequently achieved by any particular trading program. One of the limitations of hypothetical performance results is that they are generally prepared with the benefit of hindsight. In addition, hypothetical trading does not involve financial risk, and no hypothetical trading record can completely account for the impact of financial risk of actual trading. for example, the ability to withstand losses or to adhere to a particular trading program in spite of trading losses are material points which can also adversely affect actual trading results. There are numerous other factors related to the markets in general or to the implementation of any specific trading program which cannot be fully accounted for in the preparation of hypothetical performance results and all which can adversely affect trading results.

Testimonial Disclosure: Testimonials appearing on this website may not be representative of other clients or customers and is not a guarantee of future performance or success.