
A potentially important shift in Transportation sentiment

Key points
- Signs of overdone fear in the market continue to pile up
- The latest example comes from transportation stocks via our IYT Optix indicator
- While indicator signals continue to pile, investors should still be prepared for extreme volatility as tariff-related uncertainty remains
IYT traders' sentiment suggests a potential reversal
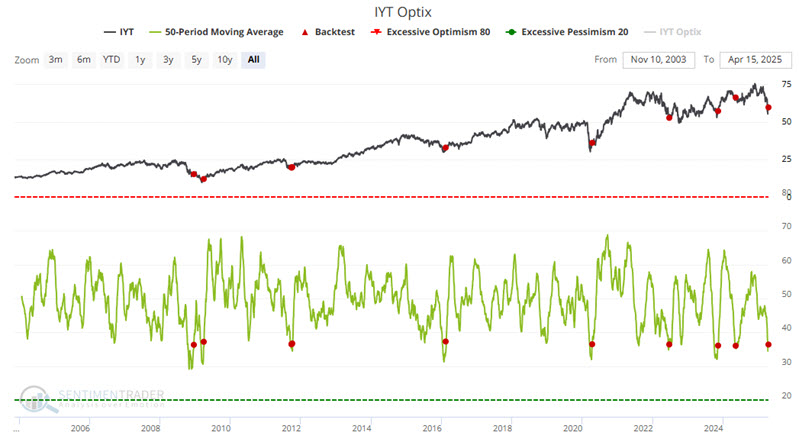
The iShares US Transportation ETF (IYT) tracks the S&P Transportation Select Industry FMC Capped Index. This index is composed of US equities in the transportation sector. It's a broad-based, modified market-cap-weighted index that invests solely in companies defined by GICS (Global Industry Classification Standard) as transportation.
As with most sectors, investor fear spiked during the recent tariff-related market decline. Fortunately, this fear appears to be reversing, which may be a positive sign for this sector and the broader market.
The chart below highlights those dates when the 20-day moving average for our IYT Optix indicator crossed above 36. The most recent signal occurred on 2025-04-15.
The table below summarizes subsequent IYT performance and results on a signal-by-signal basis.
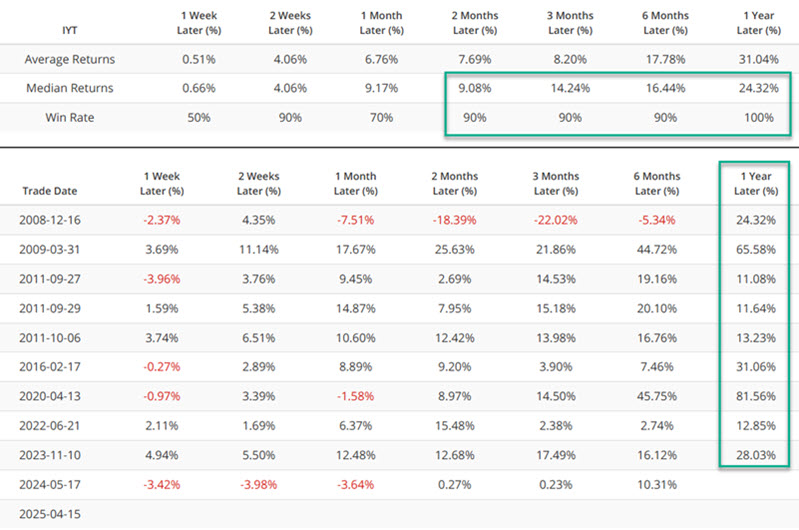
The 2008 and 2024 signals saw initial downside activity. So, investors should consider this latest signal as the weight of the evidence and not as an outright "buy" signal. Nevertheless, the high win rates across the board and the solid six-month and one-year returns suggest looking for an opportunity to play the long side of the transportation sector.
This signal is usually a positive sign for the broader market
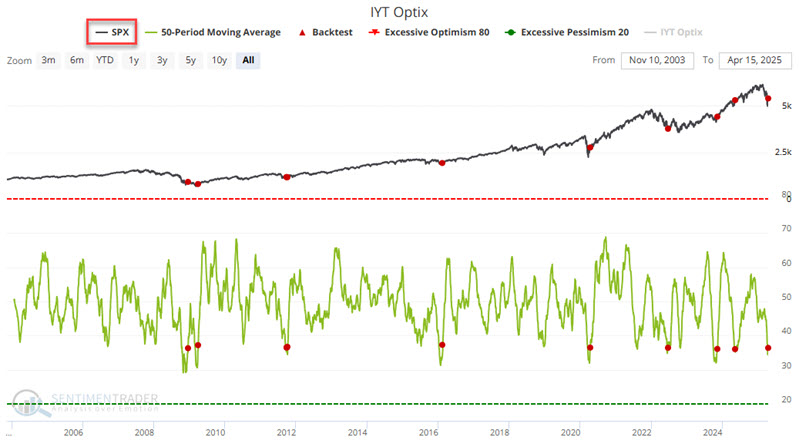
While the signal above emanates solely and specifically from the transportation sector, it typically serves as a positive sign for the broader stock market.
The chart below highlights those dates when the 20-day moving average for our IYT Optix indicator crossed above 36, but uses the S&P 500 Index as the index under analysis. The most recent signal occurred on 2025-04-15.
The table below summarizes subsequent SPX performance and results on a signal-by-signal basis.
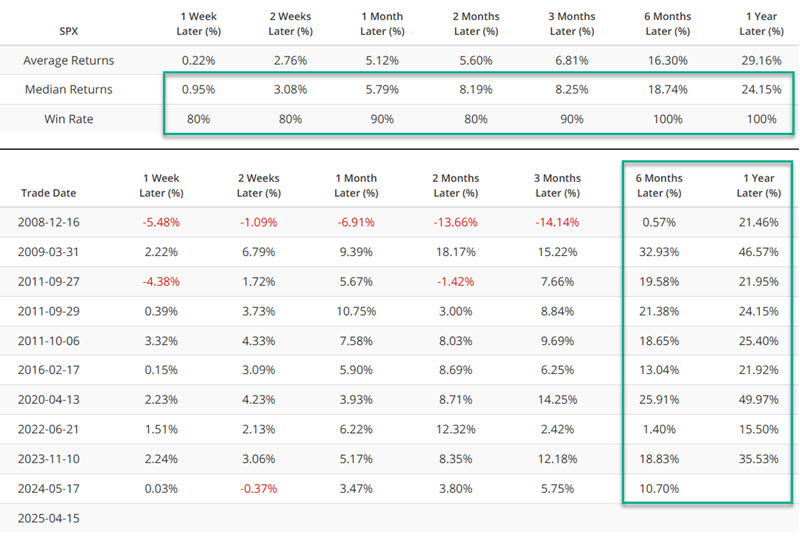
Again, it is important to note:
- Following the December 2008 signal, the S&P 500 proceeded to fall another 26% before finally bottoming in March 2009
- The 80% to 100% Win Rates across the board do not guarantee a market rally in the next year
So, remember, there are no "sure thing buy signals."
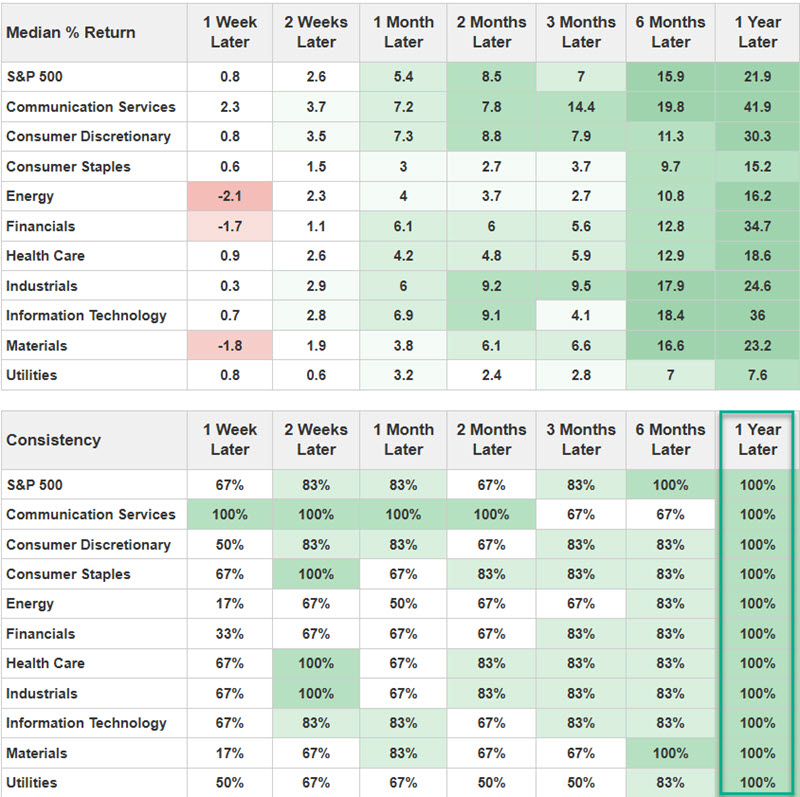
With that caveat firmly in mind, it is also compelling to consider the results for the S&P 500 sectors below, following the IYT signals highlighted above.
What the research tells us…
The historical performance of the transportation sector and the S&P 500 following the signals highlighted above is compelling. But nothing is ever guaranteed. No signal is ever guaranteed to be correct the next time around. The continued uncertainty regarding the ultimate effect of tariffs could easily continue to cause violent swings in the market, a retest of the recent lows, and possibly a decline to lower lows. That said, the results above offer a compelling reason to consider the possibility that the market might surprise to the upside in the year ahead.