
A potential trading opportunity in t-bonds

Key points
- Long-term treasury bonds have been in a bear market since the top in March 2020
- There are reasons for investors to remain wary of long-term bonds, but traders should be looking for a trading opportunity
- Seasonality suggests the potential for a tradable bounce in the months ahead
Investing versus trading
The crux of this piece is that a bullish trading opportunity in long-term treasury bonds may be forming. But before going into that, I first want to clarify the difference in my usage of the words "investing" versus "trading." Although they both involve the same act of placing buy (or sell) orders and taking a position in something, the mindset and expectations are different. In my market-addled mind, the following definitions apply:
- Investing means putting money to work in the hope of making money "over time."
- Trading means buying or selling short something in hopes of making money "right now!"
From an investing point of view, I have been bearish on long-term treasury bonds (which are the purest play on interest rate trends) and, importantly, remain so. In other words, I am not looking to make a significant long-term investment/commitment to long-term treasuries. However, based on the information that will follow later, I am looking for a potential opportunity to profit from at least a short-to-intermediate-term rally in long-term treasury bond prices.
Reasons remain for long-term investor caution
From the perspective of an investor considering whether or not to make a meaningful long-term commitment to the long side of treasury bonds, there are still numerous reasons to remain cautious. Since this is not the crux of this article, I will list several factors with links to the relevant information.
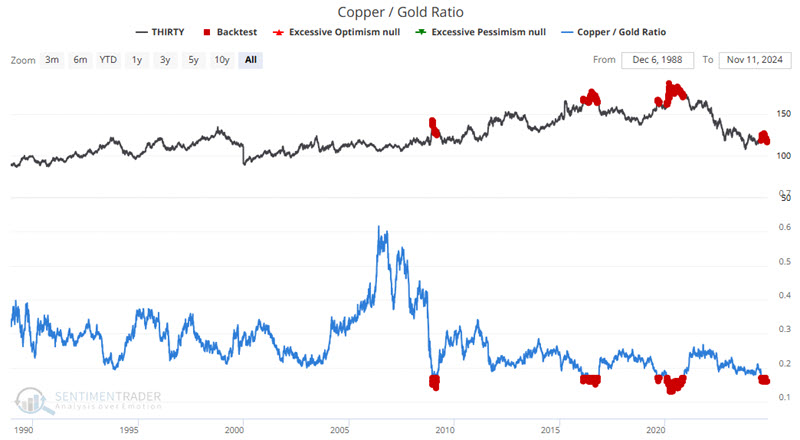
The Copper/Gold Ratio remains unfavorable.
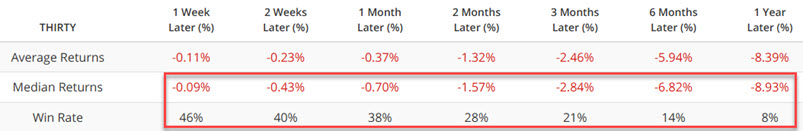
The JK Bond Cycle Model remains unfavorable.
Based on the factors highlighted above, now does not appear to be an ideal time for longer-term investors to make a significant buy-and-hold commitment to long-term treasury bonds. However, trading opportunities do arise even in the most persistent bear markets. Let's now consider the potential setup forming for more active traders.
Seasonality suggests a bounce
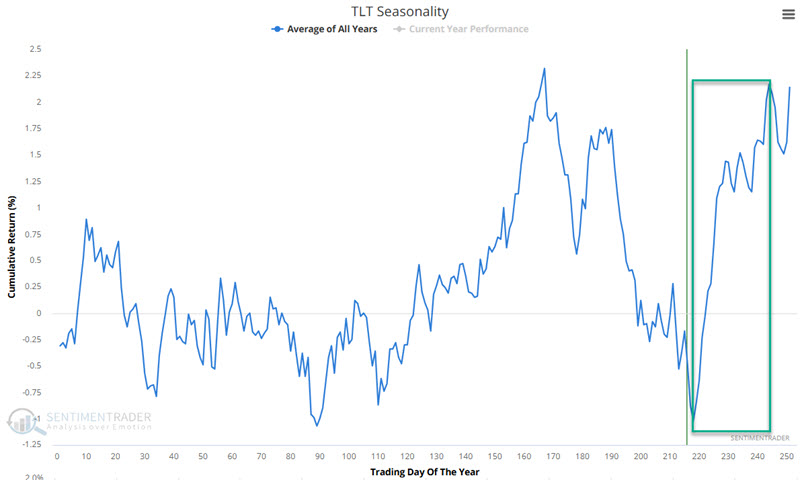
The charts below show that both the 30-year treasury bond futures contract and the iShares 20+ Year Treasury Bond ETF (TLT) topped out in March 2020, bottomed out in October 2023, and have traded sideways ever since.
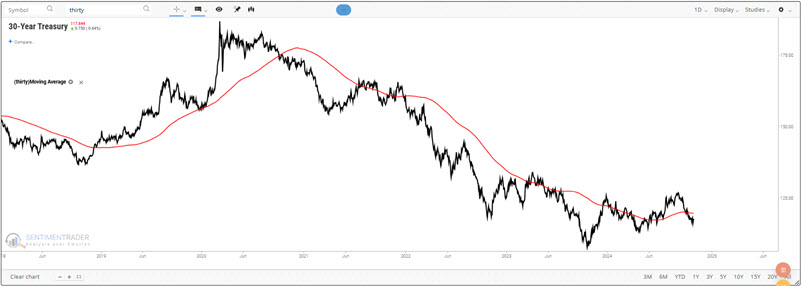
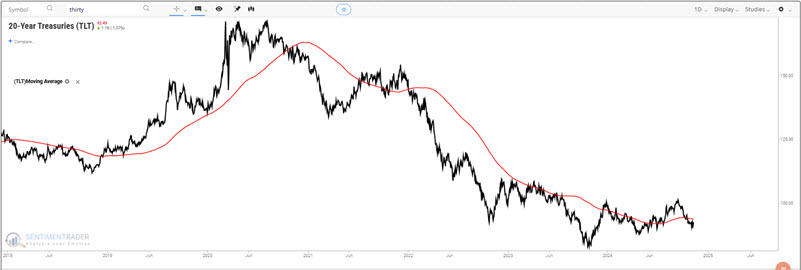
Both remain above the October 2023 low but below their respective 200-day moving average. So, if we compare the price to the 200-day moving average, we could objectively deem the current price trend unfavorable.
On the other hand, if we drew 10-week and 30-week moving averages instead (not shown), we would find the 10-week above the 30-week and could objectively deem the current trend favorable.
So, whether one considers the trend to be favorable or unfavorable is entirely in the eye of the beholder. This can be a tricky situation since an individual can see whatever they want to see. A trader who wants to be bullish will argue that bonds have not made a new low in over a year, that a potential head-and-shoulders bottom is forming, and (as we will see in a moment) that seasonality will soon be favorable. A trader who wants to be bearish will argue that bonds have been dead money (while stocks and Bitcoin have soared) and remain objectively in a downtrend.
As always, seasonality is not a roadmap and is typically most useful when price action and seasonality align. Seasonality is on the cusp of a (potentially) favorable period, but price action remains a mixed bag. Still, it appears time to be prepared for a positive reversal.
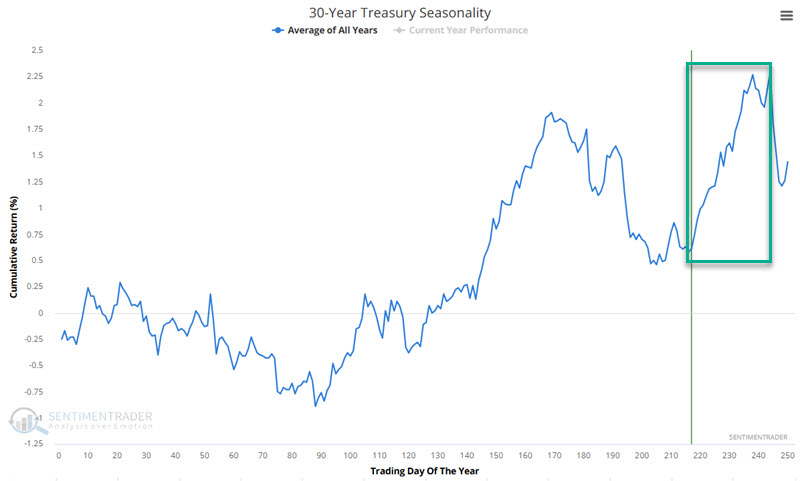
Seasonality suggests a bounce - T-bond futures
The chart below displays the annual seasonal trend for 30-year treasury bond futures. A favorable period extends from Trading Day of the Year (TDY) #216 through TDY #244. For 2024, this period extends from 2024-11-06 through 2024-12-17.
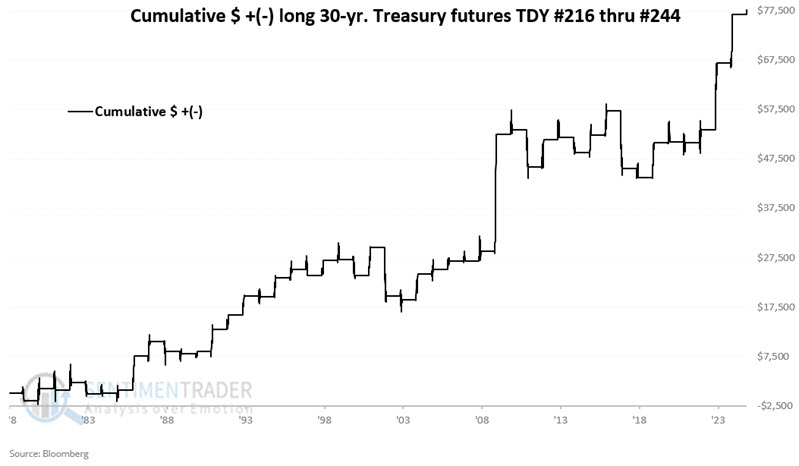
The chart below displays the hypothetical cumulative $ +(-) from holding a long position in t-bond futures only during this period each year since 1978.
The table below summarizes the results.
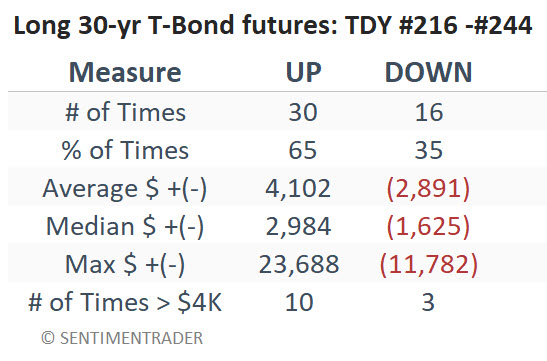
A 65% Win Rate tells us there may be an "edge," but this is far from a "sure thing " year by year. Also, on the favorable side, the median win is 1.83 times the median loss, and moves of $4,000 or more have skewed 10 to 3 to the favorable side. Again, favorable historical odds, but not a "set it and forget it" type of trade. Likewise, at $1,000 a point, trading t-bond futures can be a little rich for many traders' blood. So, let's consider an ETF alternative.
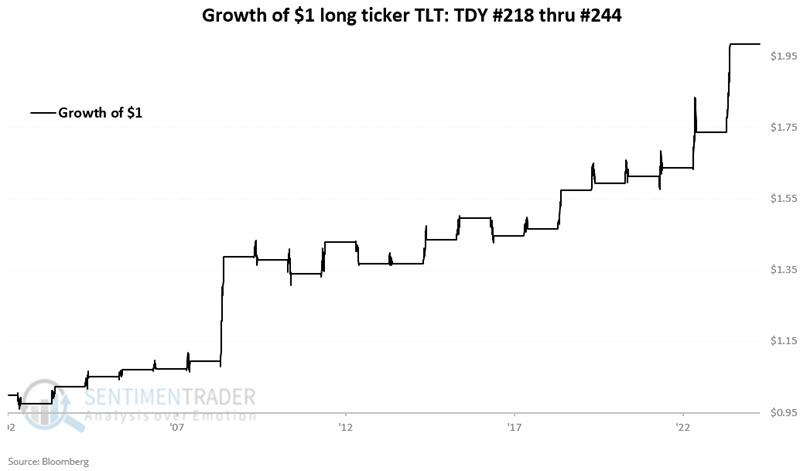
Seasonality suggests a bounce - Ticker TLT
The chart below displays the annual seasonal trend for ticker TLT, which started trading in 2002. A favorable period extends from Trading Day of the Year (TDY) #218 through TDY #244. For 2024, this period extends from the close on 2024-11-11 through 2024-12-18.
The chart below displays the hypothetical growth of $1 from holding a long position in TLT only during this period each year since 2002.
The table below summarizes TLT results during this seasonal period.
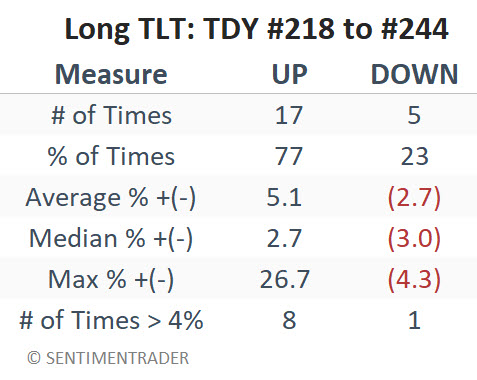
The Win Rate has been higher over the past 22 years, at 77%. The bad news is that the median win has been lower than the median loss. The good news is that the maximum loss for TLT during this seasonal window was a manageable -4.3%. Likewise, 4% or more moves have skewed 8 to 1 to the favorable side.
What the research tells us…
Based on seasonality, one can argue that long-term treasury bonds "may" be poised for a meaningful bounce. That said, seasonality is only one factor and is best used in conjunction with price action. Likewise, the overall environment may still be unfavorable for long-term bonds, so any long position might best be viewed as a short-term trading opportunity.