Products
SentimenTrader Trading Tools
‍
Backtest Engine
My Trading Toolkit
Correlation Analysis
Seasonality
Market Prediction
Indicators & Data API
‍
Proprietary Indicators & Charts
Market Data API
Strategies & Scanner
‍
50+ Trading Strategies
Smart Stock Scanner
Smart Option Scanner
Research Reports
‍
Research Solutions
Reports Library
Free Resources
Simple Backtest Calculator
Simple Seasonality Calculator
The Kelly Criterion Calculator
Sentiment Geo Map
Public Research Reports
Education
Sentiment Indicators
Technical Indicators
Pricing
Company
About
In the News
Testimonials
Client Success Stories
Contact
Log inLoginSign up
< BACK TO ALL REPORTS

A potential trading opportunity in EFA

Jay Kaeppel
2025-03-13
International indexes have significantly outperformed U.S. stocks so far in 2025. Whether or not this is sustainable remains to be seen. Regardless of the long-term outlook, a potential short-term opportunity is at hand.

Key points

  • International stocks in general - and ticker EFA specifically - seriously lagged behind U.S. stocks for well over a decade
  • However, EFA has shown significant absolute and relative strength in 2025
  • EFA is soon to enter one of its most favorable seasonal periods of the year - and traders should be alert for a potential opportunity

International stocks have long lagged U.S. stocks

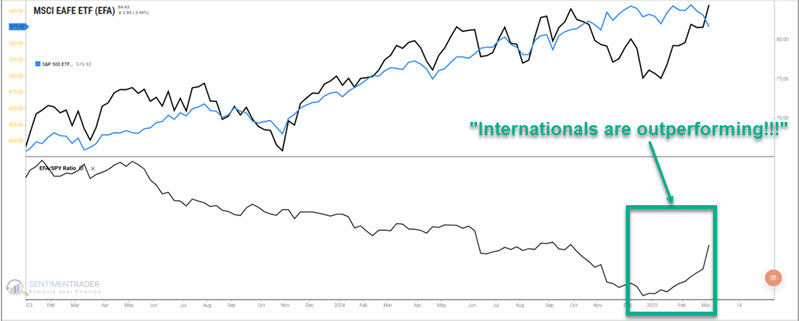
The stock market equivalent of "The Boy Who Cried Wolf" is the current social media cacophony trumpeting the recent strong performance of international stocks relative to U.S. stocks. As shown in the chart below, international stocks (represented by iShares MSCI EAFE ETF - ticker EFA) have significantly outperformed U.S. stocks so far in 2025.

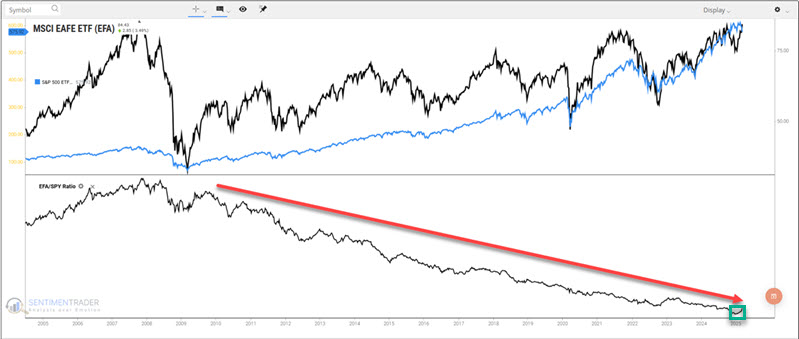
If we zoom out a bit, this recent reversal of fortune in favor of international stocks barely registers, as shown in the chart below.

So, is this finally, at long last, THE reversal? In reality, it is impossible to predict. Fortunately, that is not our concern here. The focus of this note is not necessarily whether or not a major reversal of fortune favoring international stocks in relation to U.S. stocks is beginning. Our focus below is solely on the typical seasonal action for international stocks in the month or so ahead.

International stocks are entering a favorable seasonal period 

The chart below displays the annual seasonal trend for iShares MSCI EAFE ETF (ticker EFA), a broad-based international ETF. 

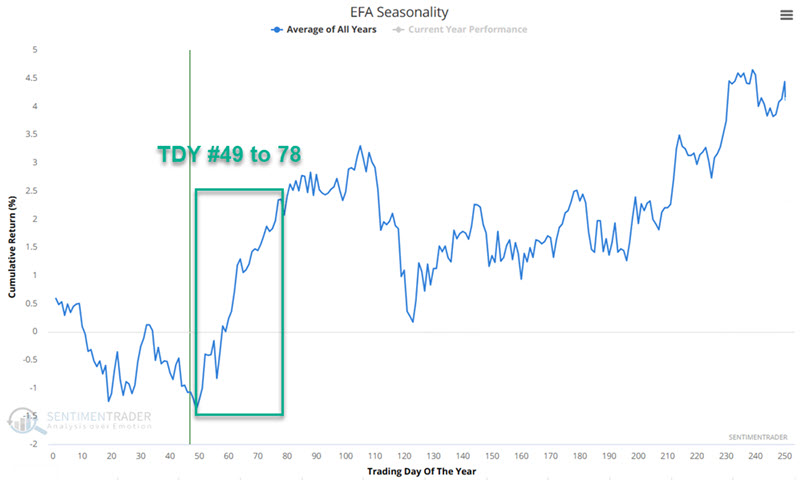
The good news is that EFA is about to enter a favorable seasonal period extending from the close on Trading Day of the Year #49 through TDY #78. For 2025, this period extends from the close of 2025-03-14 through 2025-04-25.

The potentially better news is that EFA enters this favorable seasonal period with a great deal of momentum on its side. The chart below shows that the action so far in 2025 is much better than average.

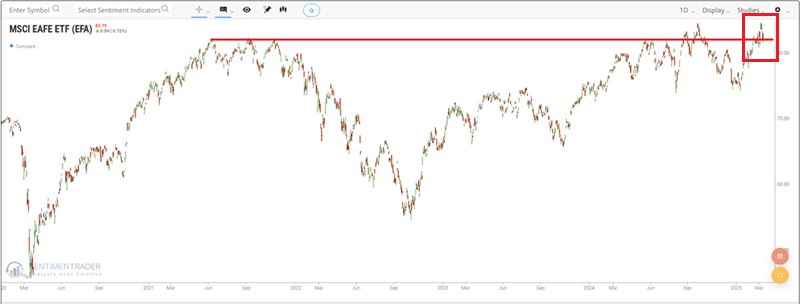
The weekly chart below shows that EFA is attempting to break out to a multi-year high. If it can do so and then hold above the old high, it would lend much weight to the bullish case.

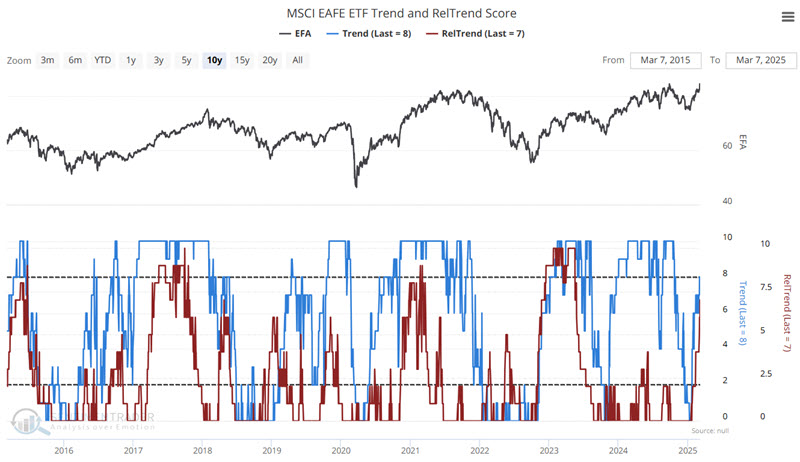
Finally, on more of an anticipatory note, Trend Strength and Relative Trend Strength for EFA have both picked up notably during the recent advance. If these measures reach the 8 to 10 range, it would argue strongly for a continued advance.


A closer look at seasonality

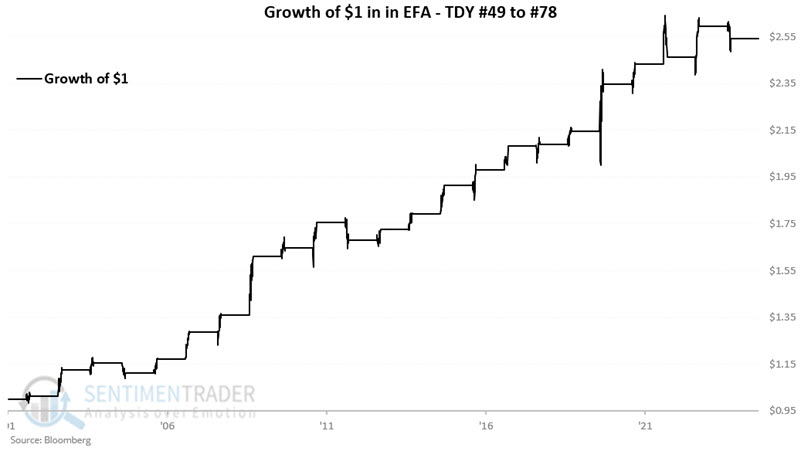
The chart below displays the hypothetical growth of $1 invested in EFA only during the TDY #49 to #78 period every year since 2001. $1 grew to $2.54.

The table below summarizes EFA's performance during this period. 

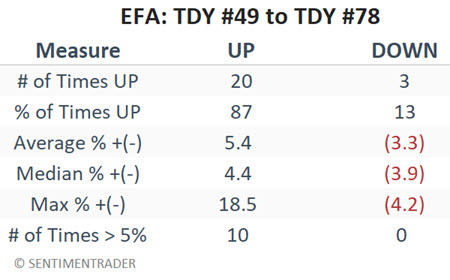
The key things to note are the 87% Win Rate and the fact that 5% or more moves have skewed positively by a factor of 10-to-0. While these figures do not guarantee performance this year, they point to a viable opportunity.

What the research tells us…

As always, seasonality is "climate, not weather," and there is no guarantee that ticker EFA will move higher between now and late April. Nevertheless, history suggests that that is the way to bet for short-term traders. Also, as always, individual traders are solely responsible for deciding a) whether or not to trade, b) how much capital to allocate, and c) when to cut a loss (or take an early profit).

PRODUCTS
SentimenTrader
Trading Tools
Indicators & Data API
‍
Strategies & Scanner
‍
Research Reports
FREE
RESOUrCES
Simple Backtest
Calculator
Simple Seasonality
Calculator
The Kelly Criterion
Calculator
Sentiment Geo Map
‍
Public Research Reports
‍
Education
Sentiment Indicators
‍
Technical Indicators
‍
Pricing
Bundle pricing
‍
FAQ
‍
Announcements
‍
COMPANY
‍
About
‍
In the News
‍
Testimonials
‍
Client Success Stories
CONTACT
‍
General Inquiries
‍
Media Inquiries
‍
Financial Professionals Inquiries
‍
© 2026 Sundial Capital Research Inc. All rights reserved.
Setsail Marketing
TermsPrivacyAffiliate Program
Risk Disclosure: The information and tools provided are for research and analytical purposes only and are not intended as investment advice. Market analysis involves uncertainty, and outcomes may differ from expectations. Users should conduct their own due diligence and consider their individual circumstances before making any financial decisions. Past performance is not necessarily indicative of future results.

Hypothetical Performance Disclosure: Hypothetical performance results have many inherent limitations, some of which are described below. No representation is being made that any account will or is likely to achieve profits or losses similar to those shown; in fact, there are frequently sharp differences between hypothetical performance results and the actual results subsequently achieved by any particular trading program. One of the limitations of hypothetical performance results is that they are generally prepared with the benefit of hindsight. In addition, hypothetical trading does not involve financial risk, and no hypothetical trading record can completely account for the impact of financial risk of actual trading. for example, the ability to withstand losses or to adhere to a particular trading program in spite of trading losses are material points which can also adversely affect actual trading results. There are numerous other factors related to the markets in general or to the implementation of any specific trading program which cannot be fully accounted for in the preparation of hypothetical performance results and all which can adversely affect trading results.

Testimonial Disclosure: Testimonials appearing on this website may not be representative of other clients or customers and is not a guarantee of future performance or success.