
A potential signal in semiconductors

Key points
- A counterintuitive sentiment signal has triggered: the SMH Optix 3-day average crossed above 80% while the ETF is in a long-term uptrend.
- Historically, this specific setup has preceded strong long-term returns, with a 92% win rate over the next year.
- The semiconductor sector (SMH) is also entering its most favorable seasonal period of the year.
SMH Optix gives a counterintuitive signal
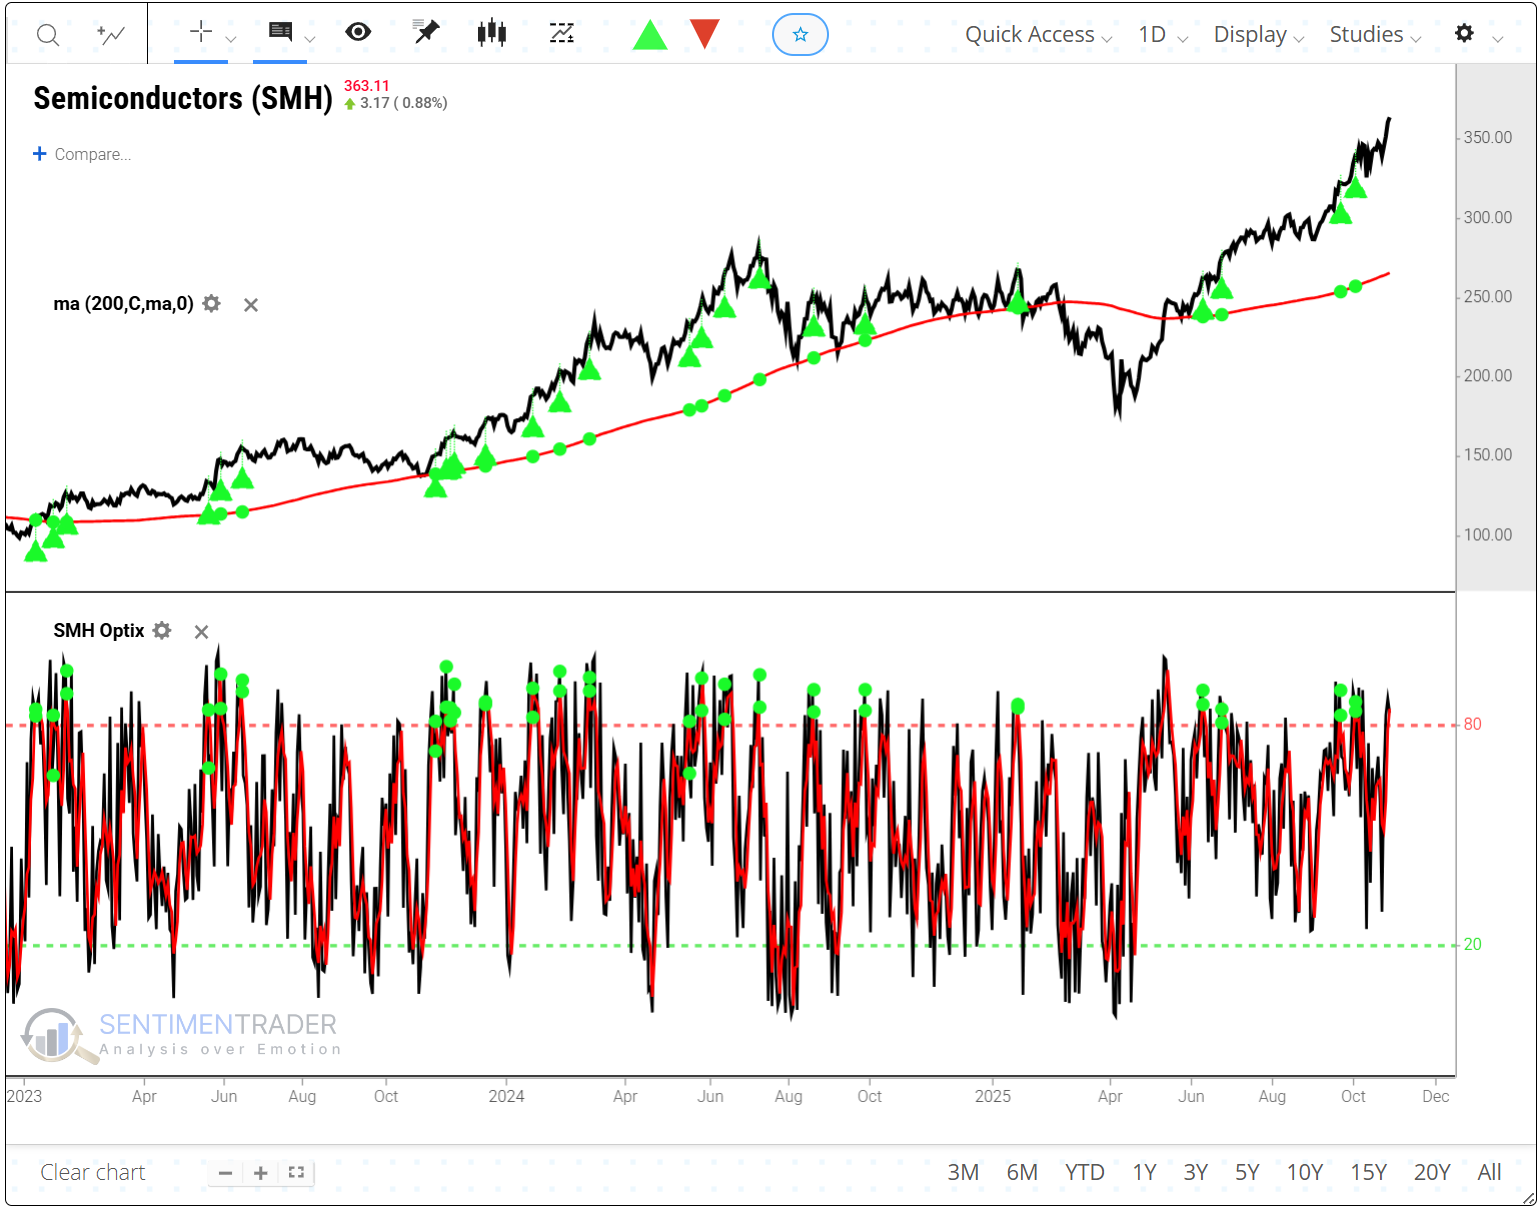
Typically, high Optix readings suggest too much bullishness on the part of traders. However, for SMH, we have come across a counterintuitive usage. The chart below highlights all dates when:
- The 3-day average of SMH Optix crossed above 80%
- While SMH was above its 200-day moving average
For related backtest, click here.
The table below summarizes subsequent SMH performance.
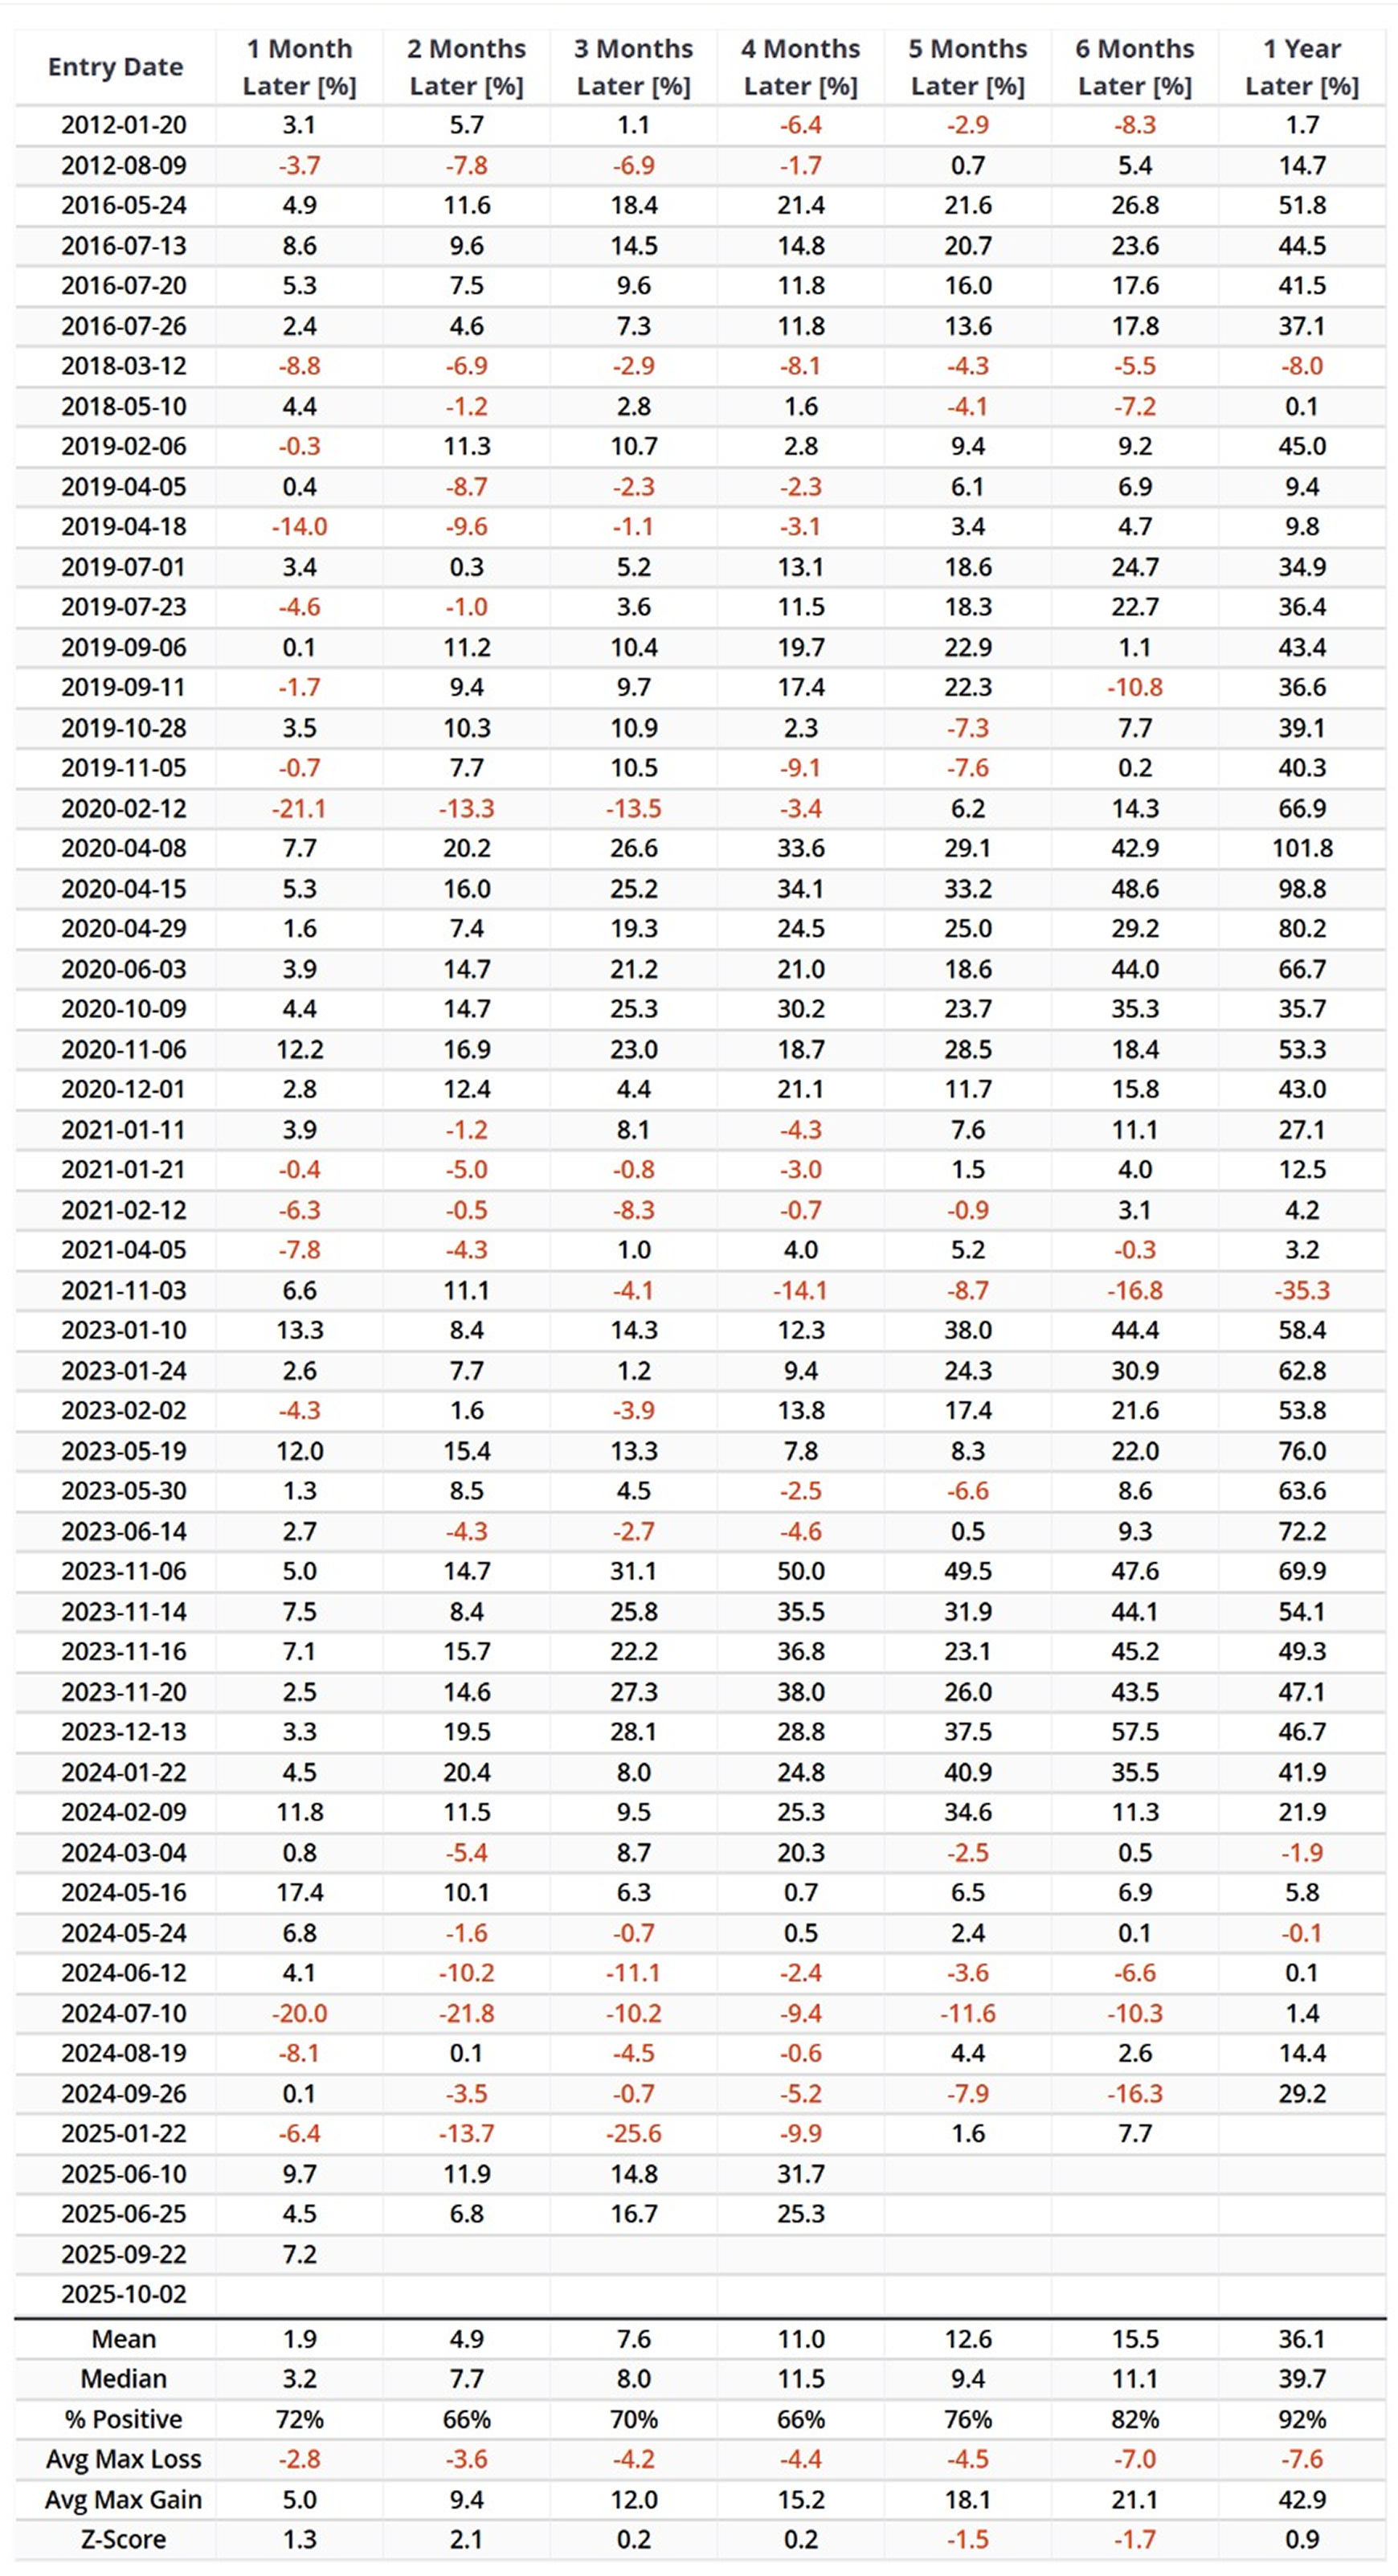
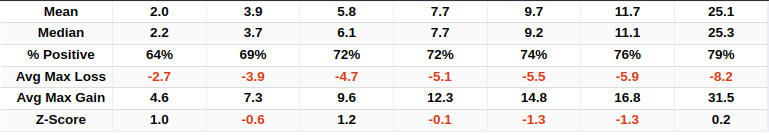
The six- and twelve-month results are compelling, with Win Rates of 82% and 92%, respectively, and Median Returns of +15.5% for six months and +36.1% for twelve months. For the sake of comparison, SMH performance for all trading days appears in the chart below.
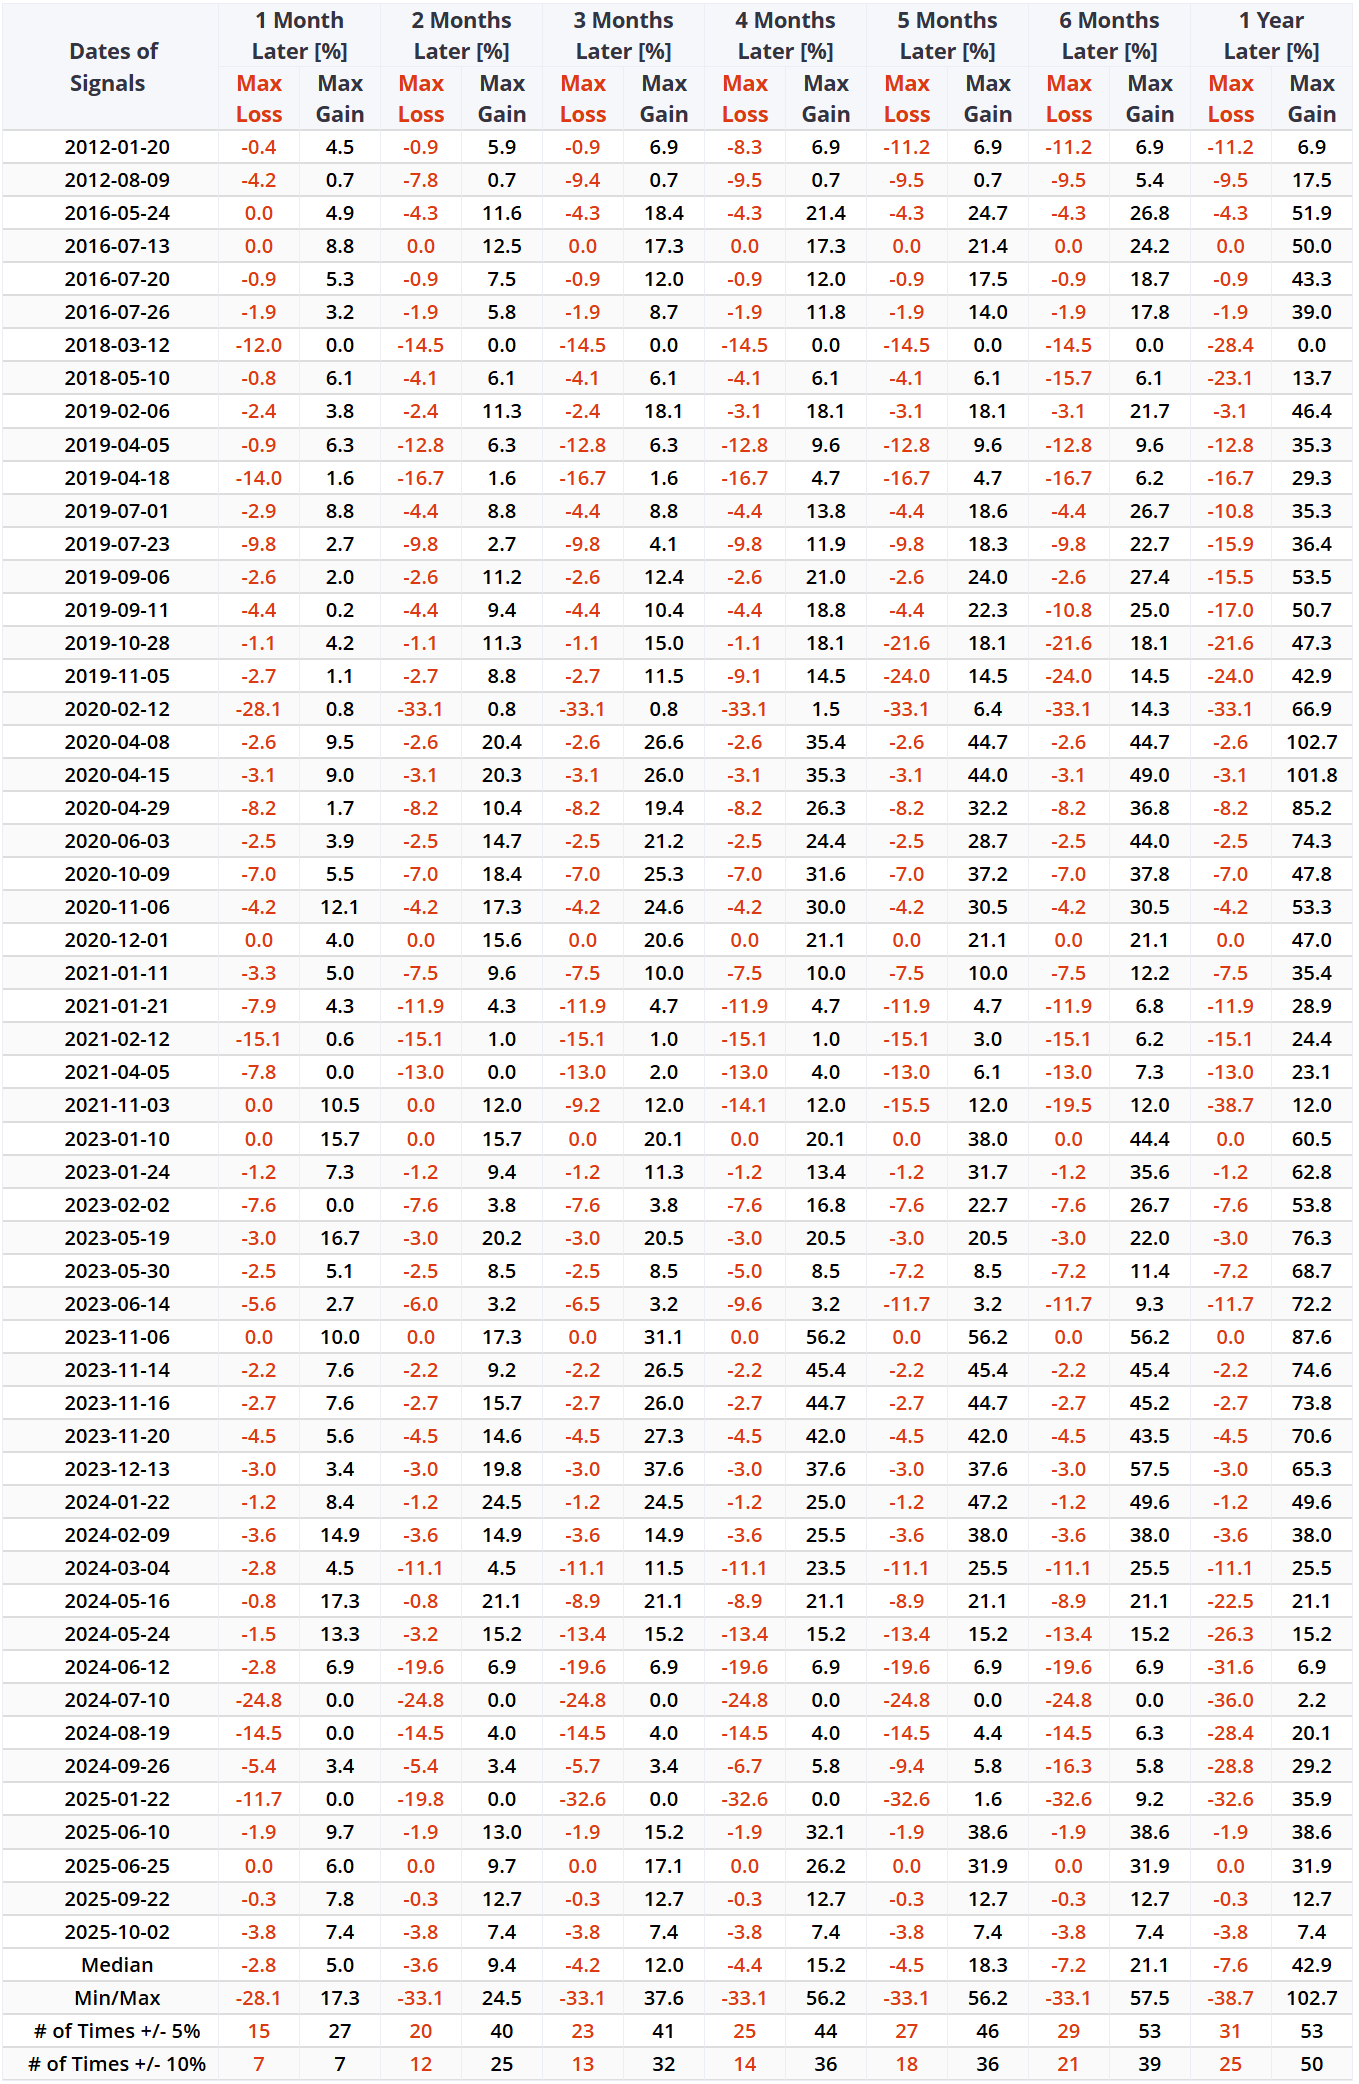
However, it must be emphasized that this is a volatile sector, and significant losses are absolutely a possibility. Note the recent cluster of signals in mid-2024 (e.g., June/July) which were followed by significant drawdowns, with max losses in the -28% to -36% range.
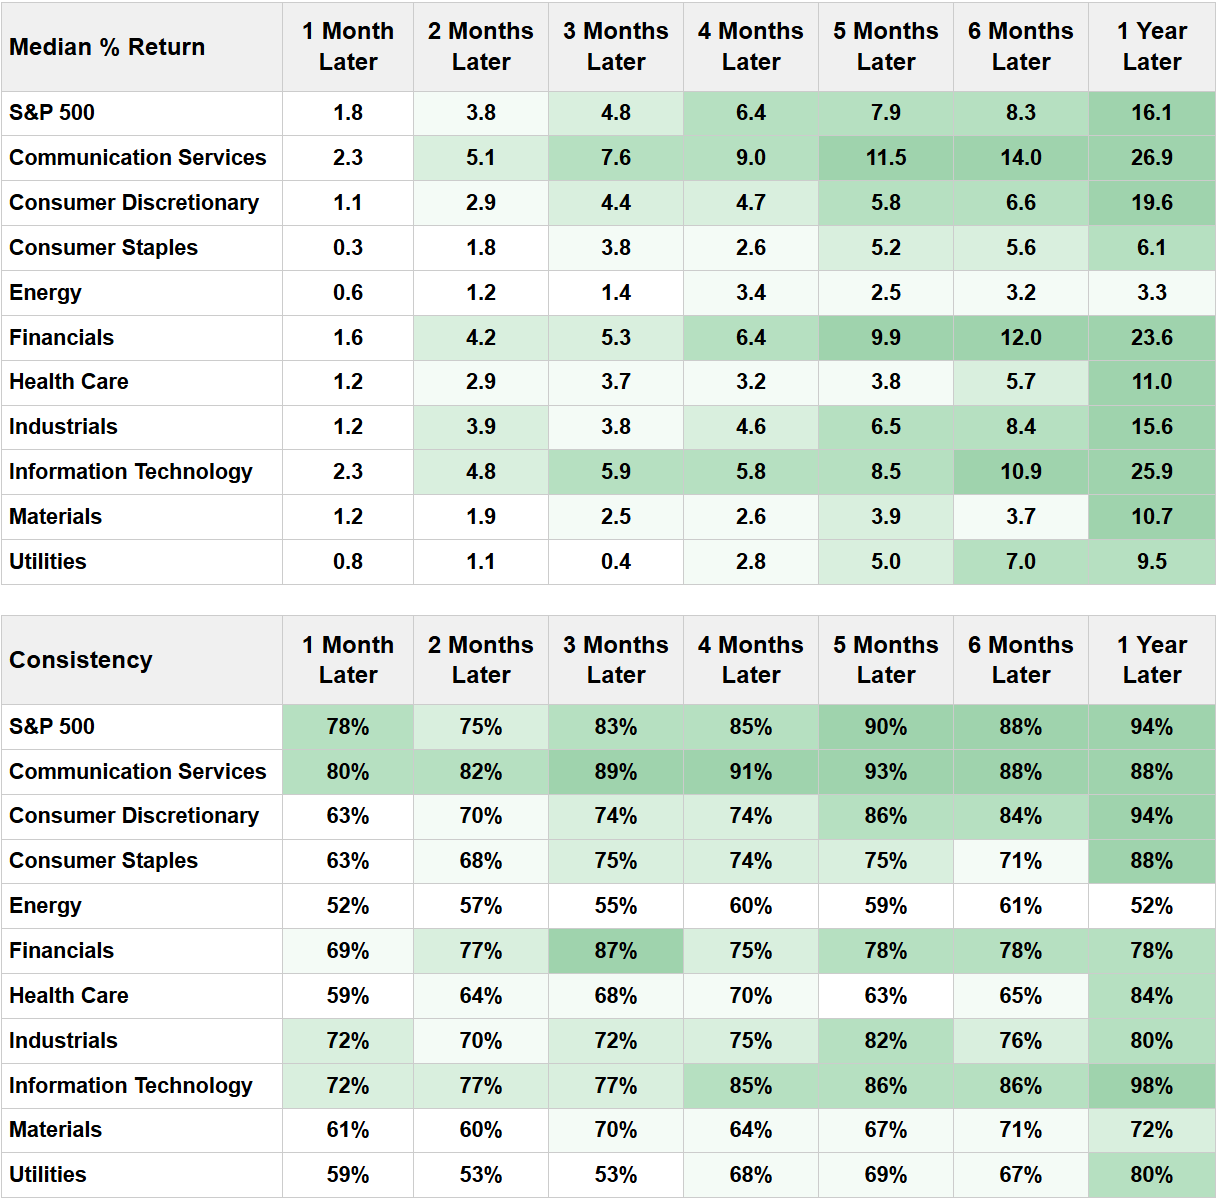
The Information Technology sector has shown a median return of +25.9%.
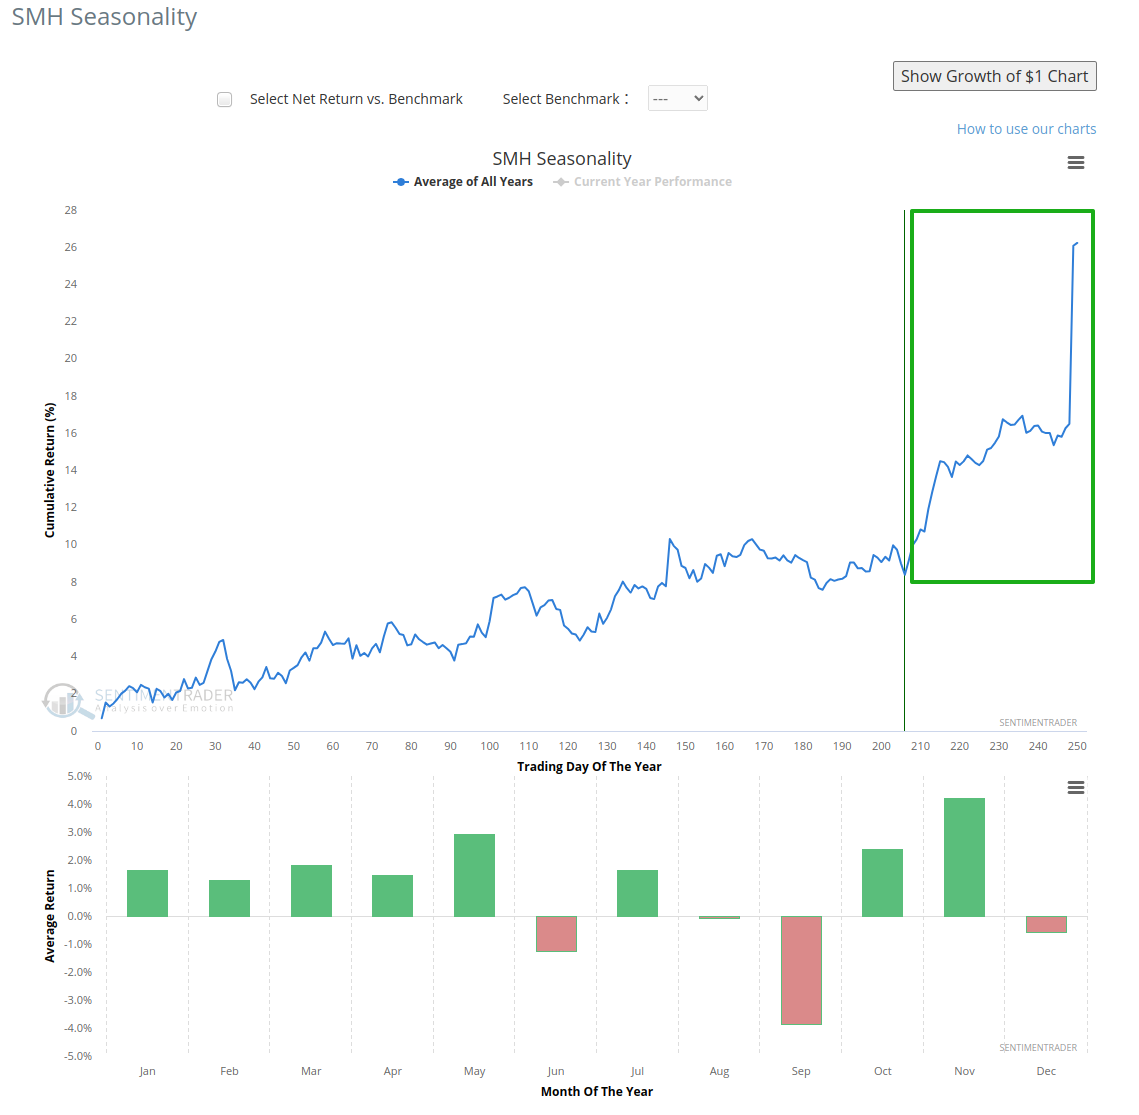
Seasonality suggests favoring the bullish case
Once again, I start with the standard caveat that seasonality is an average of historical annual performance and NOT a roadmap to what will happen during the current year. That said, the chart below shows that the annual seasonal trend for the VanEck Semiconductor ETF (ticker SMH) is entering a favorable period that extends from roughly Trading Day of Year (TDY) #206 through the end of the year. This is not meant to imply the semis are about to launch an immediate and sustained advance. This is intended to suggest that the seasonal tailwinds are now blowing in a positive direction.
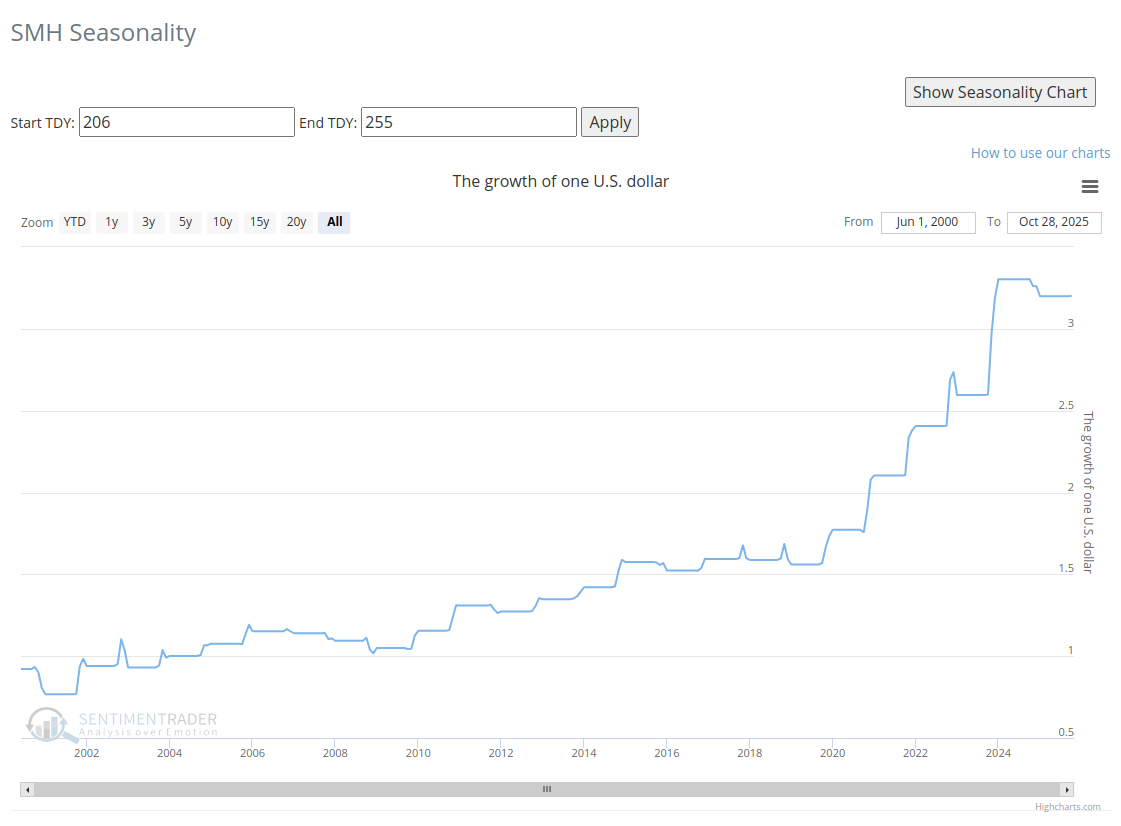
The chart below displays the hypothetical growth of $1 invested in SMH only during this favorable seasonal window (TDY 206-255).
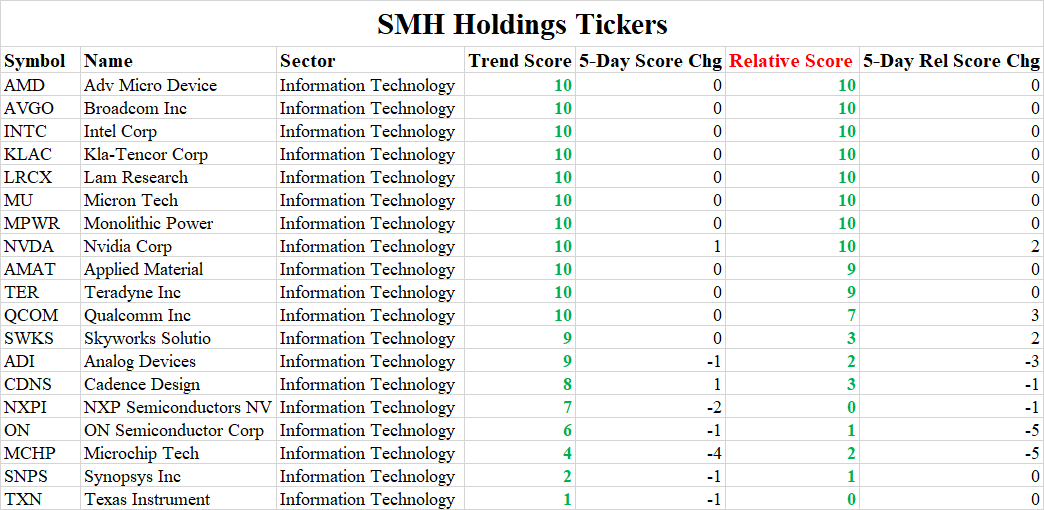
A Note on Intel (INTC)
While the overall sector and seasonal picture appears constructive, a look at the component level shows the importance of selectivity. The table below shows the Trend Scores for many of the largest holdings in the SMH.
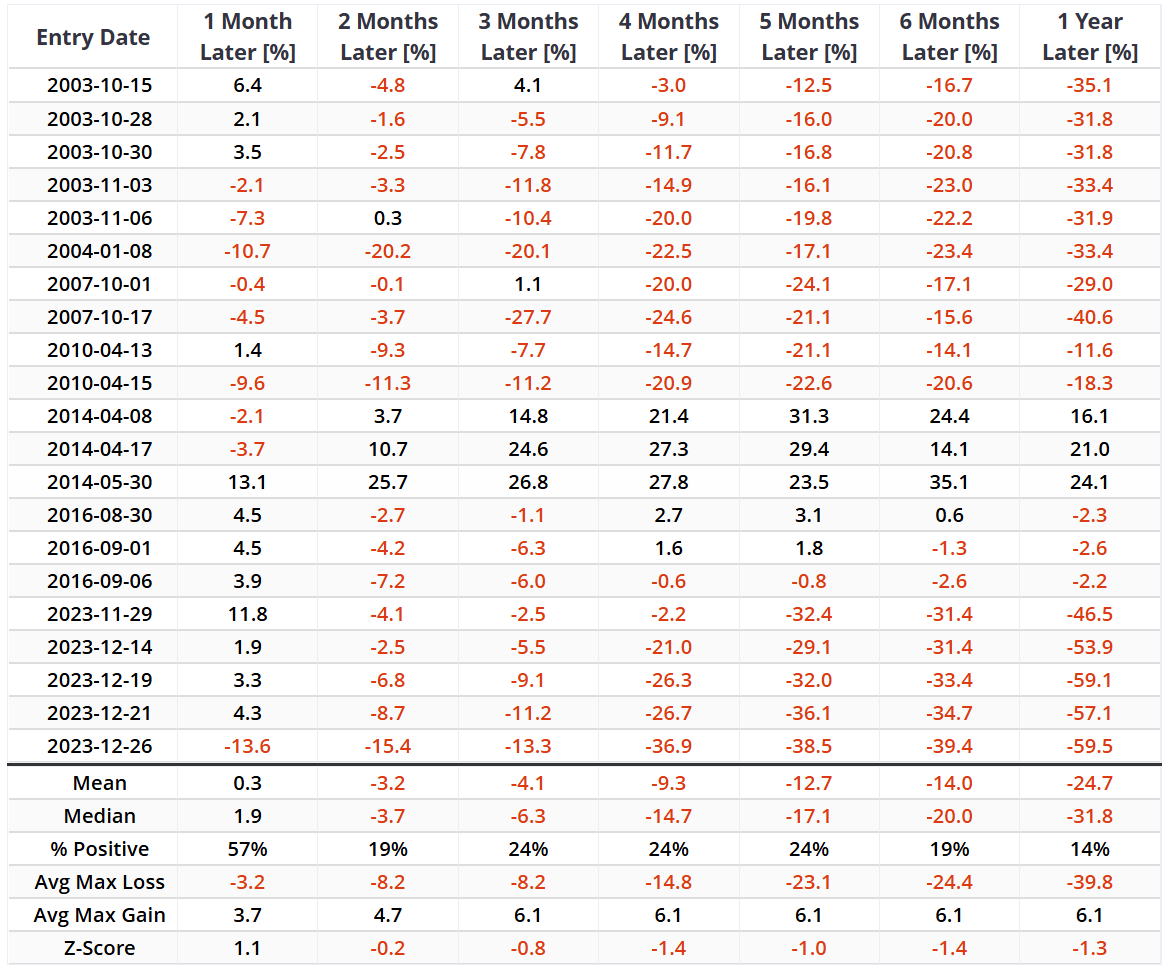
However, it's also worth noting an interesting, and somewhat conflicting, signal specifically for INTC. The stock recently surged, closing at an 18-month high but failing to eclipse its 24-month high.
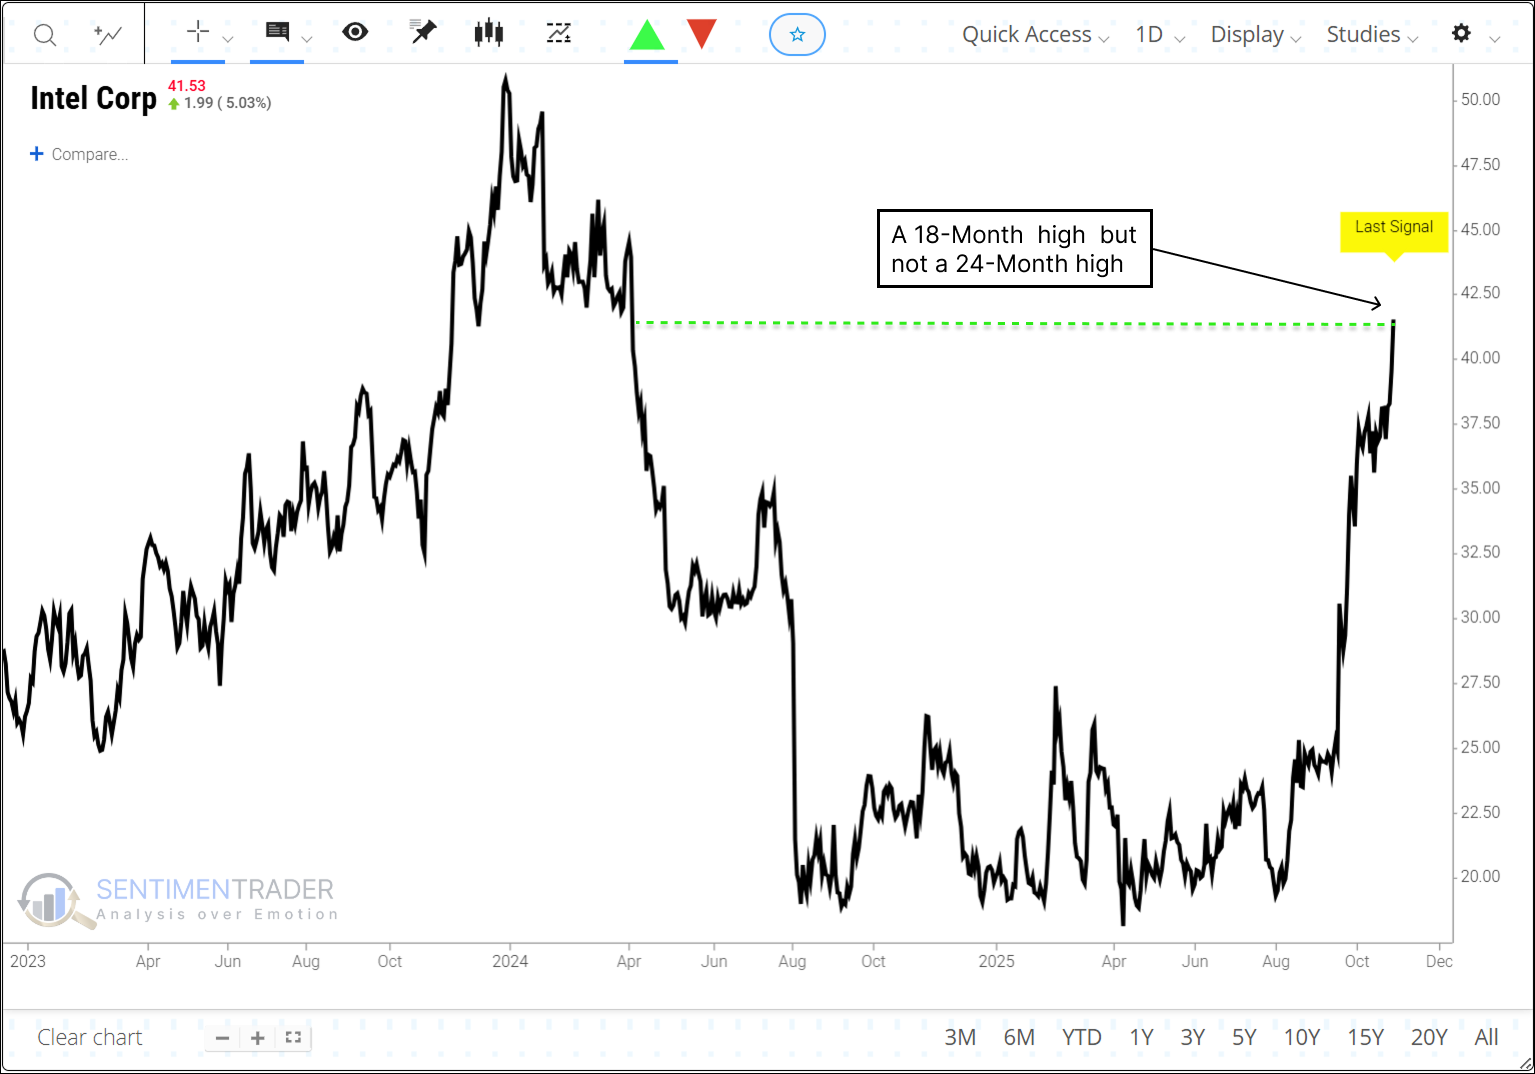
The performance table below shows that this breakout has historically led to poor returns, with a median loss of -20.0% six months later and -31.8% one year later.
What the research tells us…
Strong and counterintuitive sentiment signals converging with highly favorable seasonal tailwinds historically often herald significant gains for the SMH Index and broader market. This sector should always be viewed as a "high-risk, high-reward" domain. The pronounced mid-2024 correction-which saw declines exceeding -28% even after bullish signals emerged-serves as compelling evidence of extreme volatility.
Semiconductor stocks and the broader market indeed possess historical "potential" for another substantial rally in the coming months. SMH's current high P/E ratio and robust stock performance strongly reflect the market's optimistic outlook on future growth in the semiconductor industry, particularly in artificial intelligence (AI), advanced process technologies, and high-end chips. However, investors must carefully assess their risk tolerance and the sector's inherent volatility before entering positions.