
A potential short-term signal for long-term bonds

Key points
- In a recent piece, I laid out the contrarian bearish case for long-term treasury bonds; The items discussed remain in force
- That said, long-term treasuries have continued to trend higher since bottoming in late 2023
- A simple signal model recently generated a favorable signal that may be interest to short-term traders
Long-term treasuries continue to creep higher
In this piece, dated 2024-09-04, I detailed the bearish case for long-term treasury bonds. The items detailed in that piece remain in force. In sum, the items discussed primarily involved long-term cycles that are presently unfavorable. That said, countertrend rallies can and do (and recently have) occur.
The chart below displays the price action for the iShares 20+ Year Treasury Bond ETF (ticker TLT). TLT bottomed in October 2023 and has since advanced 22% in price. Also, note that the high so far this week is a new 52-week high.
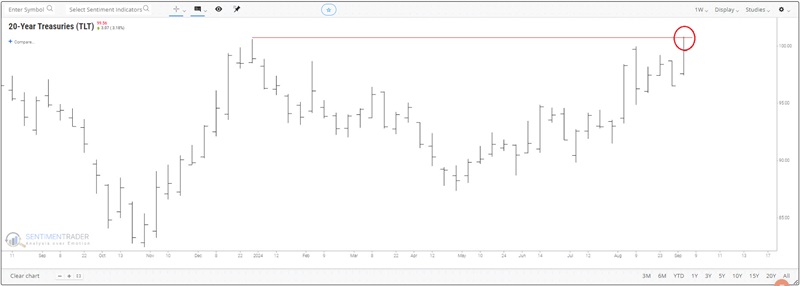
The big question is, "Will the rising price trend continue?" We cannot (nor can anyone else) answer that question definitively. The information in the linked article suggests avoiding significant long-term investment in long-dated treasury bonds (the gist of the argument is that we are in a long-term rising rate environment). However, countertrend rallies can and will occur. A simple signal model is flashing a favorable signal for traders of long-term treasuries. To reiterate, we are discussing a "short-term trading opportunity" and not loading up on long-dated treasuries for a long-term commitment.
A potential trading signal
For this, we will use weekly data for ticker TLT. A simple favorable trigger occurs when:
- For the first time in at least 13 weeks, TLT makes a high during the current week, which is the highest high in one year
- When this occurs, but TLT at the close of trading that week
- Hold for 13 weeks
For this test, no stop-loss is used (although traders must consider risk management steps in their real-world trading).
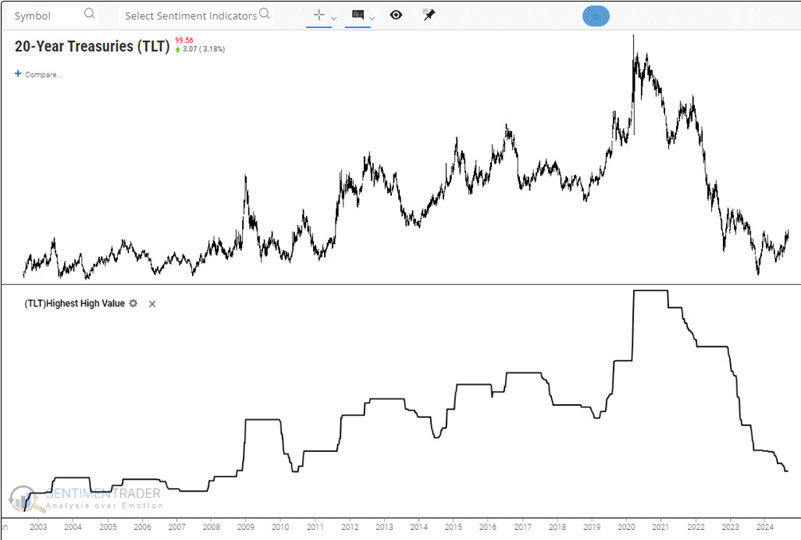
The chart below displays a weekly chart for TLT at the top and the 52-week high at the bottom. We are looking for those times when the 52-week high value ticks higher for the first time in at least 13 weeks. A new signal will occur at the end of this week on 2024-09-13.
We do not specifically recommend using this model as a mechanical trading system. That said, let's consider the historical hypothetical results from doing so.
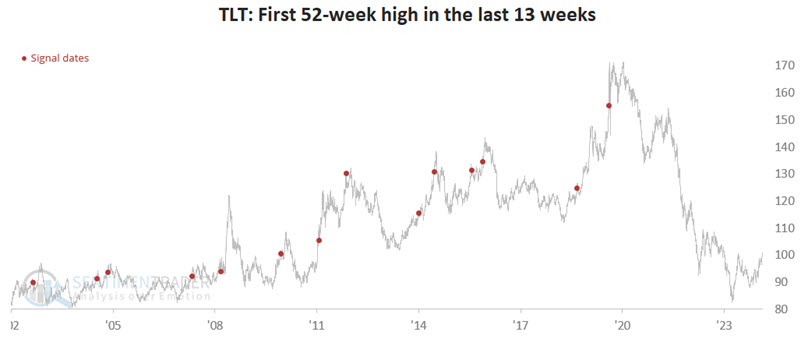
The chart below highlights signals using this simple method. A new red dot will occur on 2024-09-13.
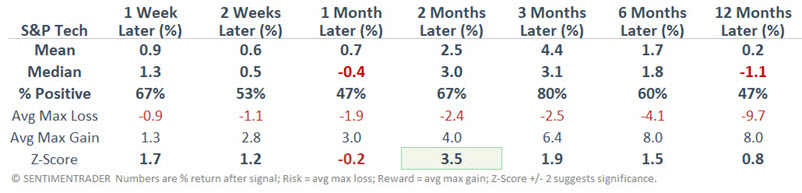
The table below displays TLT performance following previous signal dates.
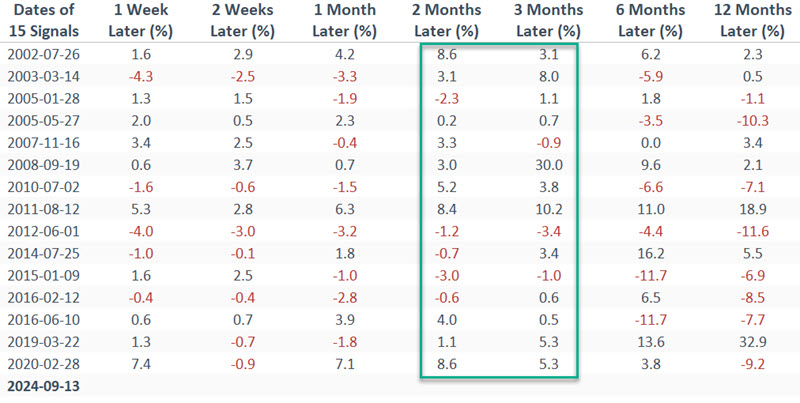
The table below summarizes TLT performance following previous signal dates. The two to three month timeframe appears to be the "sweet spot" regarding performance.
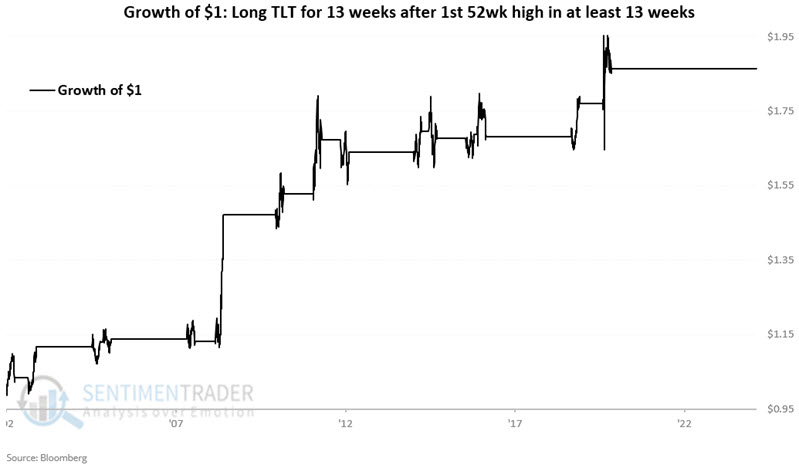
The chart below displays the hypothetical growth of $1 invested in TLT (using price-only data) for 13 weeks following previous signal dates.
What the research tells us…
So, is this a "world-beater, you can't lose, with profits beyond the dreams of avarice" strategy? Hardly. Our purpose here is not necessarily to convince you to buy and hold TLT for the next several months. The only real purpose is to highlight the potential for continuing the recent advance in TLT. The latest signal suggests that short-term traders of TLT shares, TLT options, or possibly even 30-year bond futures look for opportunities to play the long side of treasuries over the next two to three months. As always, no signal/system/strategy ever relieves a trader of the obligation to intelligently allocate capital and ruthlessly manage risk.