
A potential short-term edge for stock index traders

Key points
- Over any seven-day trading period, the stock market has shown a slight favorable trend
- This edge increases during a particular seven-day period starting near the end of May
- The edge is slightly greater during presidential election years
The end of May/early June edge
Let's look at the period encompassing May's last four trading days and June's first three trading days. In any given year, this period may start before or after Memorial Day (which might make part of it a holiday period). For 2024, this period extends from the close on 2024-05-24 through the close on 2024-06-05. Is the stock market sure to advance during this period? Of course not. But there does appear to be a historical edge that alert short-term traders may be able to exploit.
Setting the baseline
Let's first set the baseline since we are looking at a seven-trading day period. The chart below displays the rolling seven-day percentage gain or loss for the S&P 500 Index (price only) starting in 1920.
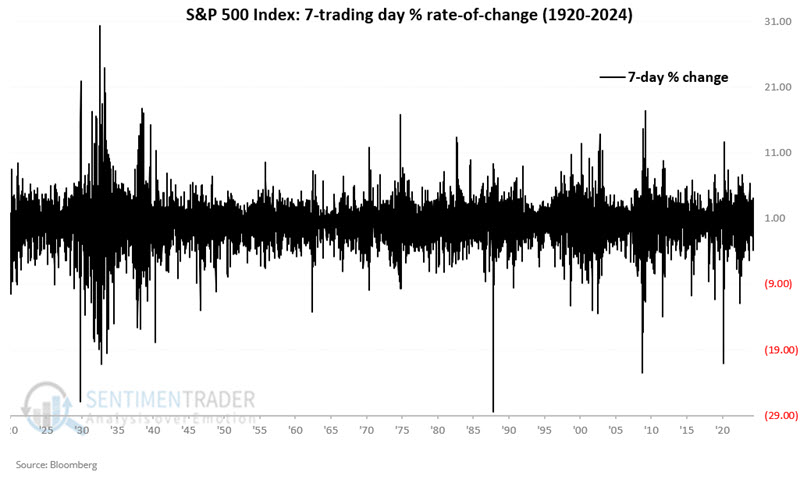
The table below summarizes S&P 500 performance for ALL seven-day trading periods in roughly the last 104 years.
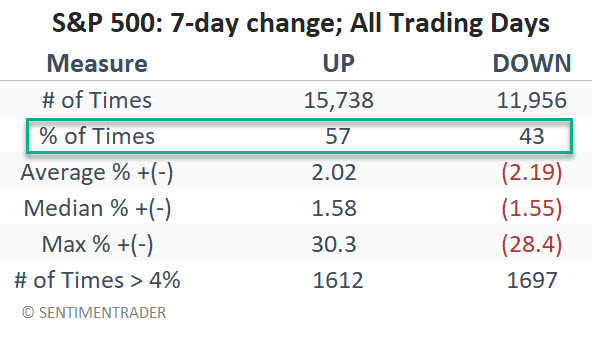
As you can see, results can vary widely. The key takeaway is that (as one might guess) there is a slight bias to the upside, with the S&P 500 Index showing a 7-day gain 57% of the time and a 7-day decline only 43% of the time.
A closer look at the end of May/early June period
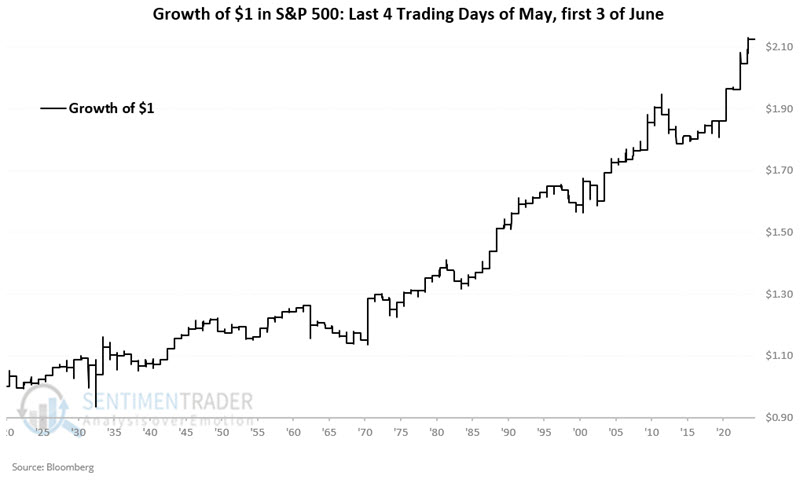
The chart below displays the hypothetical growth of $1 invested in the S&P 500 Index (using price-only data) only during the last four trading days of May and the first three trading days of June, every year starting in 1920.
The table below summarizes performance results for this period.
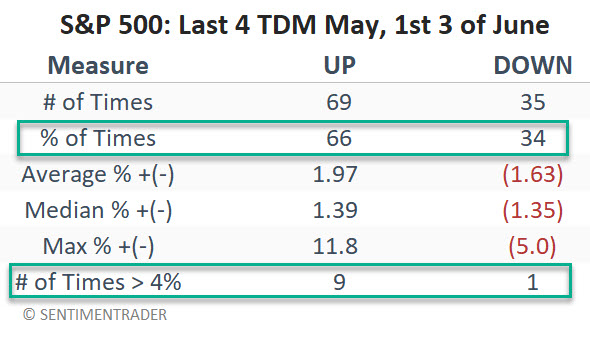
The two key things to note are:
- The increase in the Win Rate (66%) versus the baseline (57%)
- Gains and losses over 4% skew to the positive side 9-to-1
For all trading days, the number of 4% movers skews slightly in favor of losing periods (1,612 seven-day gains of 4%+ versus 1,697 seven-day loss of -4% or more, or 0.95 to 1).
The end of May/early June period during election years
Let's consider only the late May/early June period during the U.S. Presidential Election years.
The chart below displays the hypothetical growth of $1 invested in the S&P 500 Index (using price-only data) only during the last four trading days of May and the first three trading days of June, every presidential election year starting in 1920.
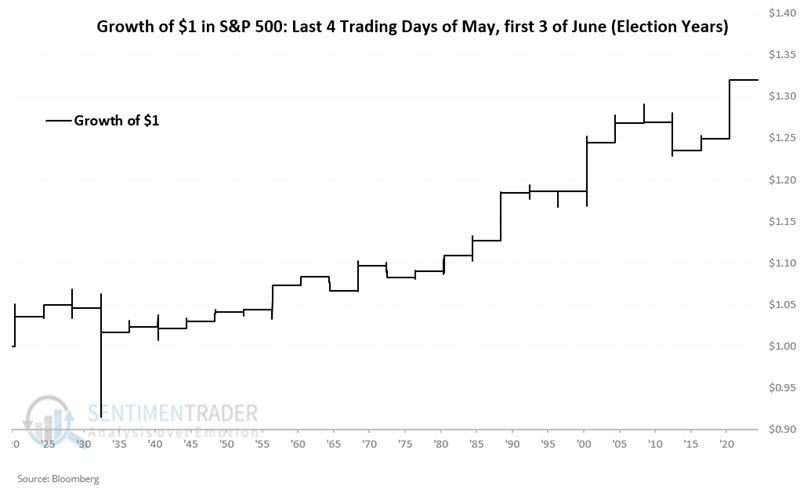
The table below summarizes performance results for this period only during presidential election years.
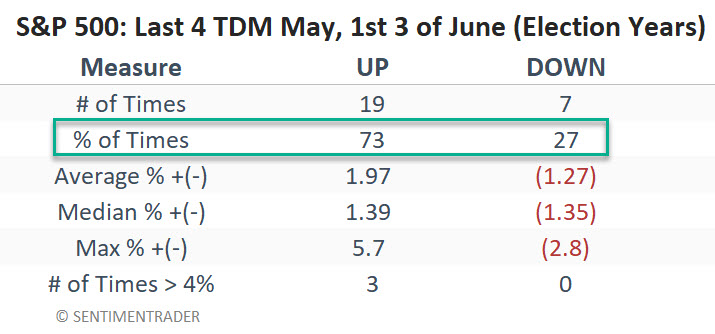
The key things to note are the Win Rate of 73% and no losses over -4%. A 73% Win Rate is no "sure thing." But compared to a 57% Win Rate for All Days, it equates to a slight edge. Likewise, while historical results are always a threat to be broken - regarding downside risk during this late May/early June period - the worst losses were only -2.8% in 1932, -2.7% in 2012, and -1.5% in 1964.
What the research tells us…
It is rarely wise to rely solely on seasonal trends to trade. The primary benefit of seasonal trends is to point out potential periods when a trader might enjoy a slight "edge." The most favorable time to consider any seasonal trend is when the underlying security (in this case, the S&P 500 Index) is already trending in the expected direction (i.e., when seasonality and price action align). Does the start of the late May/early June period, combined with recent bullishness for the S&P 500 Index, guarantee an advance in the period just ahead? Nothing is ever guaranteed in the markets. Nevertheless, history does suggest a slight edge for bullish traders, and the historical presidential election year performance suggests a natural stop-loss point for aggressive traders if the S&P drops more than -2.8% (a reasonable risk for many traders).