
A Potential Opportunity in Utilities

Key Points:
- Like most sectors, Utilities have shown weakness in recent weakness - but not as much as most other sectors
- Despite this weakness, the combination of oversold conditions and a favorable seasonal period may provide an opportunity to play the long side in the months ahead
- The State Street Utilities Select Sector SPDR ETF (XLU) allows traders to play the utility sector
Utilities have sold off… but not as much as most sectors
In the chart below, we see the price action for the State Street Utilities Select Sector SPDR ETF (XLU).
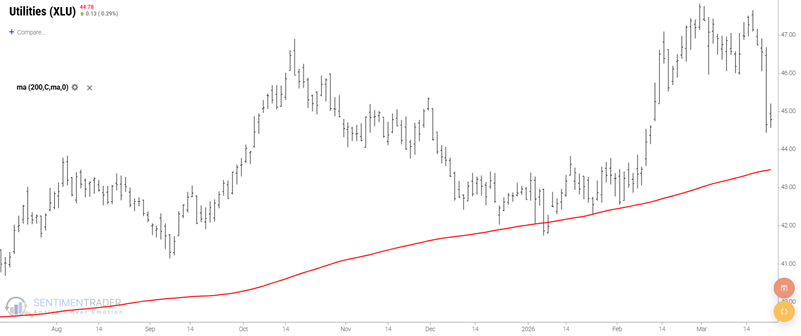
The bad news is that the sector has sold off in recent weeks. The good news is that it is still holding well above its 200-day moving average and is only slightly more than 6% off its February high. In other words, it is acting like the defensive sector it is purported to be. Is that a good enough reason to hold utilities? By itself, possibly not. But there are two other factors that might make utilities an interesting play in the months ahead.
XLU Bollinger Bands flashed a favorable signal
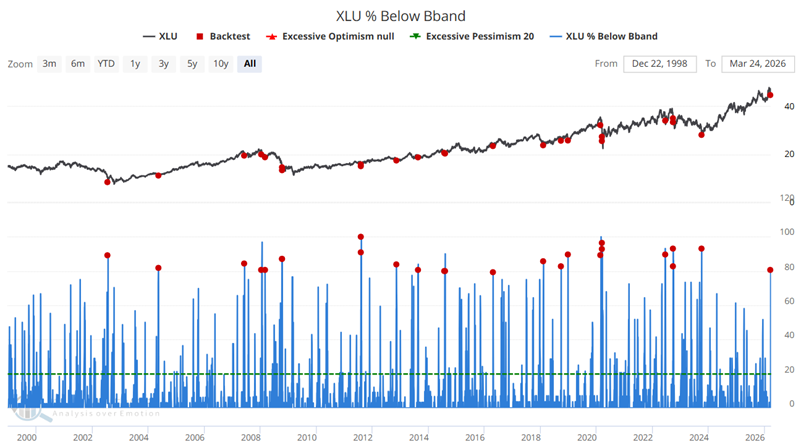
Our XLU % below BBand indicator shows the percentage of S&P 500 Utility Sector Index stocks that are currently below their respective Bollinger Bands. In theory, a stock closing below its BBand can be deemed "oversold." This does not automatically equate to a "buy" signal, as any given stock can always get more oversold. However, when the vast majority of stocks in a given index are oversold, it often signals a relatively low-risk point.
The chart below highlights all dates when our XLU % Below BB indicator crossed above 79%. In other words, it signals when roughly 4 out of every 5 stocks in the index are oversold.
The table below summarizes subsequent XLU performance. The historical results for two and three months after a signal are notable.

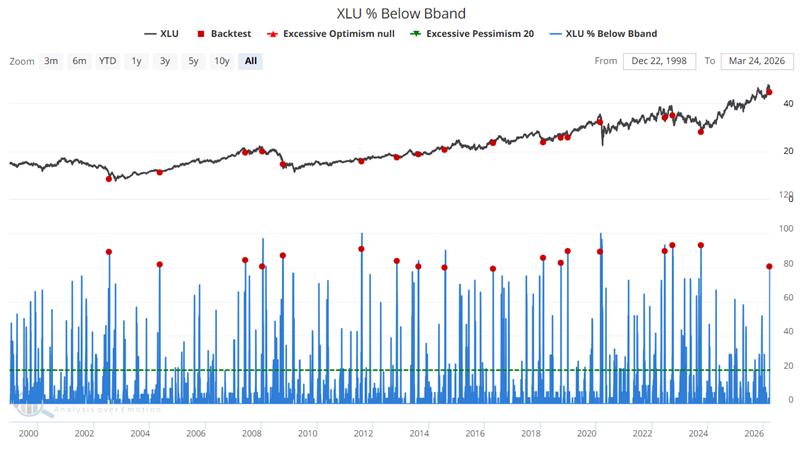
Now, let's remove some of the overlapping signals that appear in the test above. The chart below highlights all dates when an XLU % Below BB signal occurred for the first time in three months.
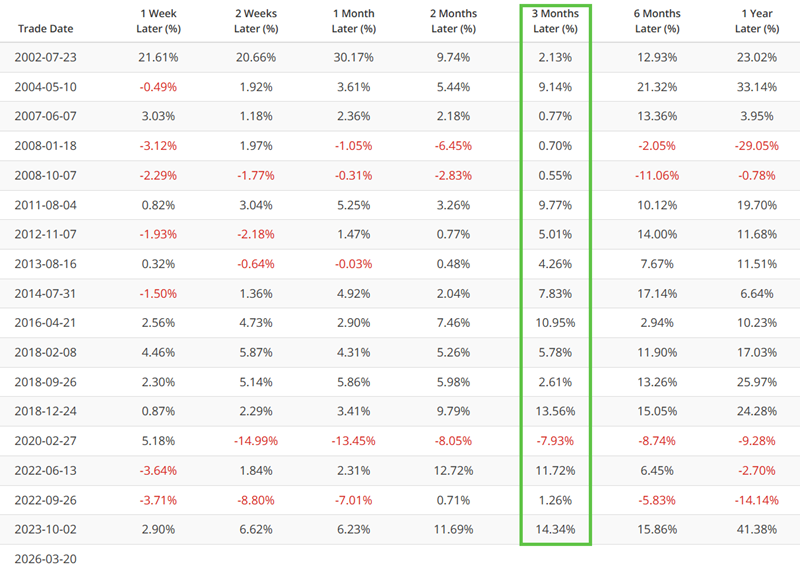
The table below summarizes subsequent XLU performance. The key thing to note is the 3-month Win Rate of 94%.

The table below shows signal-by-signal results for XLU following the signal highlighted above.
Seasonality is entering a favorable period
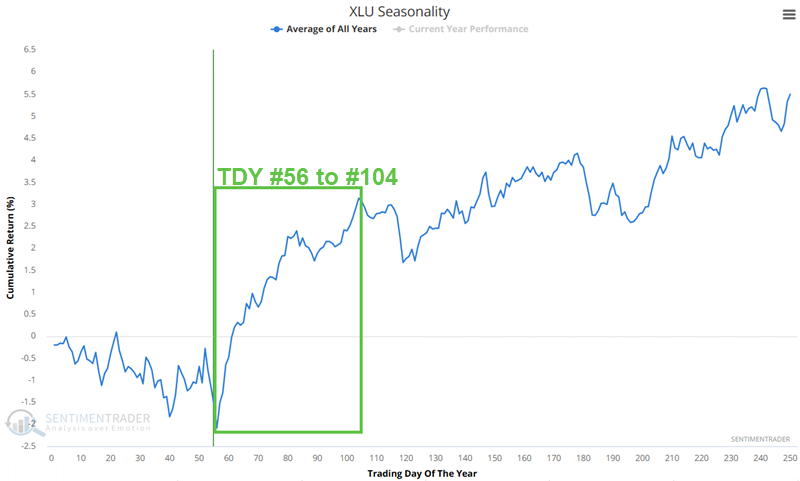
The chart below displays the Annual Seasonal Trend for ticker XLU. It also highlights the period extending from Trading Day of the Year (TDY) #56 through TDY #104. For 2026, this period extends from the close on March 24th through June 2nd. This appears to dovetail nicely with the "potentially favorable next three months" signal from the Bollinger Bands indicator above.
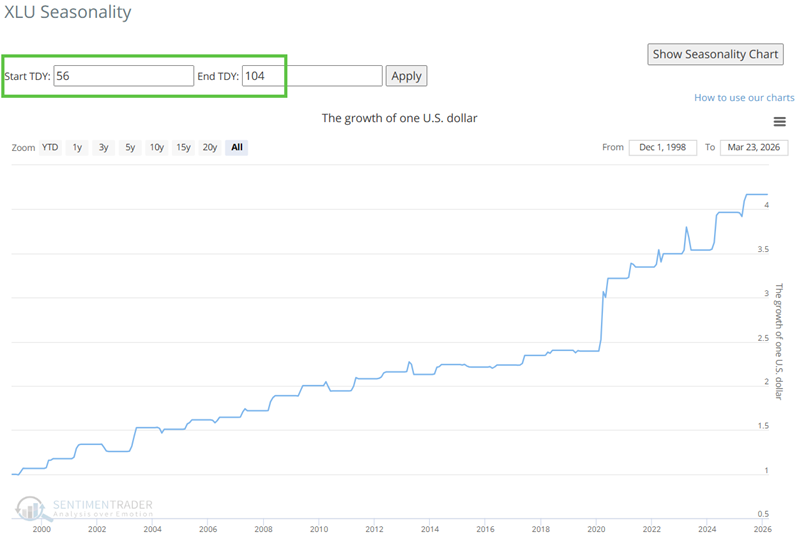
The chart below displays the hypothetical growth of $1 invested in XLU only from TDY #56 through #104 each year since XLU started trading.
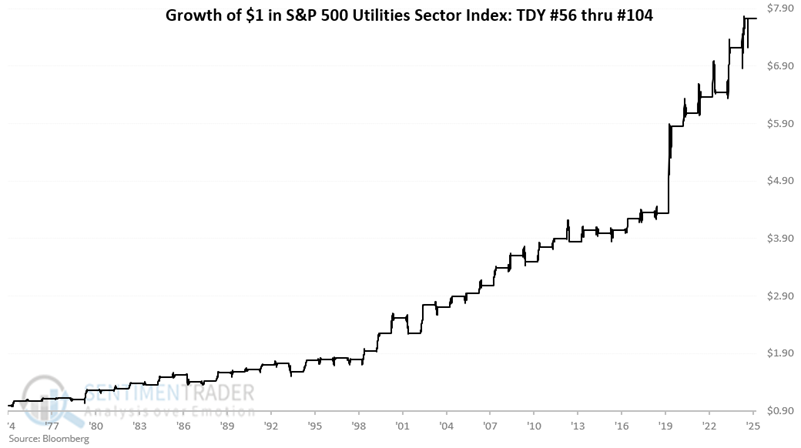
To expand the test, let's look at the S&P 500 Utility Sector Index performance during this seasonal period over the last 51 years.
The chart below shows the hypothetical growth of $1 invested in the index from TDY #56 through #104 each year, starting in 1975.
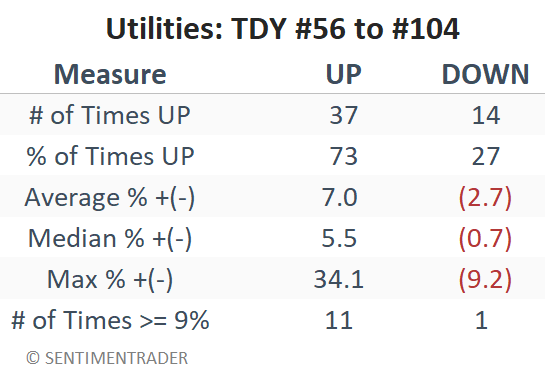
The table below summarizes the S&P 500 Utility Sector Index performance during this favorable seasonal period since 1975.
What the research tells us…
So, is it time to load up on utility stocks for the next several months? That's for each trader to decide. The potential setup for positive results is clear from the data presented above. Unfortunately, no setup ever "guarantees" anything. For any trader considering the long side of the utility sector, the key decisions are a) "How much to commit?", and b) "If and when to cut a loss?" Even during favorable periods, there can be significant downside volatility along the way. Sizing a position small enough to ride out any declines (rather than taking a large position and bailing out if a sizeable intratrade drawdown occurs might be the wiser course of action in this case.