
A potential opportunity in semiconductors

Key points
- Semiconductor stocks are struggling to maintain leadership status (down -10% while the S&P 500 makes a new high)
- Seasonality and an odd sentiment signal presently suggest the potential for another meaningful run higher for semis
- However, careful consideration of risk tolerance and capital allocation is essential
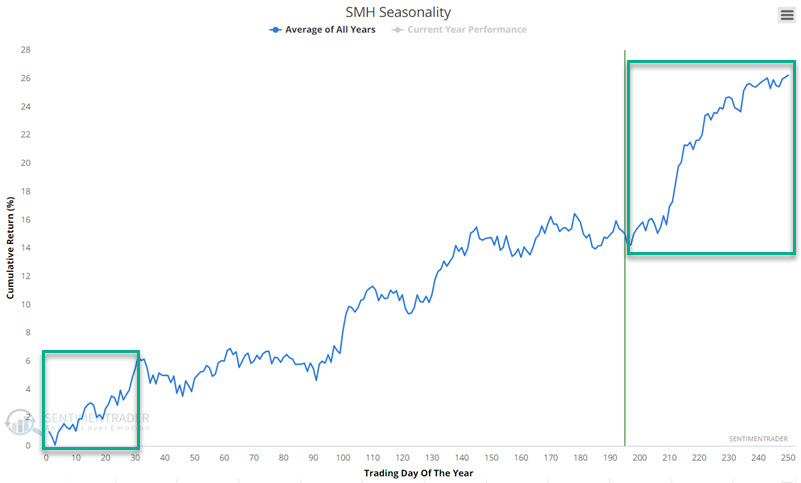
Seasonality suggests favoring the bullish case
Once again, I start with the standard caveat that seasonality is an average of historical annual performance and NOT a roadmap to what will happen during the current year. The chart below shows that the annual seasonal trend for the VanEck Semiconductor ETF (ticker SMH) is entering a favorable period that extends from Trading Day of Year (TDY) #196 through TDY #31 of the following year. This period begins again at the close on 2024-10-10. This is not meant to imply the semis are about to launch an immediate and sustained advance. This is intended to suggest that aggressive traders and investors look for opportunities to play the long side of this volatile sector.
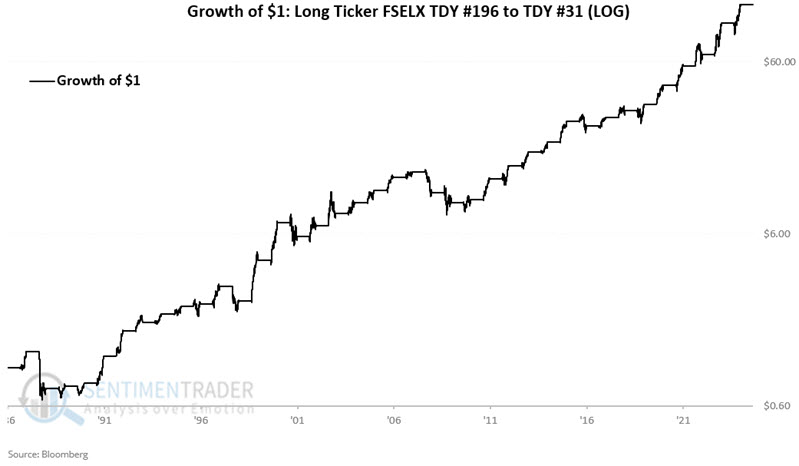
Ticker SMH started trading in 2000. To create a more extended test, we will use the Fidelity Select Electronics fund (ticker FSLEX) - which trades with a 0.95 correlation to ticker SMH - as a proxy for this sector. FSELX began trading in 1986.
The chart below displays the hypothetical growth of $1 invested in FSELX starting in October 1986. Hypothetically, $1 invested in this manner starting in 1986 is worth $129 now.
The table below summarizes FSELX's performance during this period since 1986.
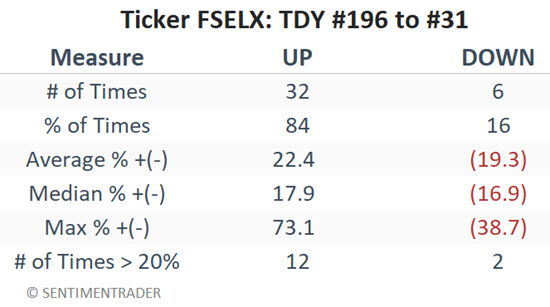
Overall, the numbers are compelling. An 84% Win Rate and 31% of all years (12 out of 38) witnessed an advance of +20% or more - while only two years saw a decline of more than -20%, suggesting that there is an "edge." However, it must be emphasized that this is a volatile sector, and significant losses are absolutely a possibility in any given year. FSELX suffered a loss of -38.7% during the 1987-1988 period (with a maximum drawdown of -47.6%) and a loss of -24.6% during 2007-2008 (with a maximum drawdown of -45.3%). So do not underestimate the potential risks.
SMH Optix gives a counterintuitive signal
Typically, high Optix readings suggest too much bullishness on the part of traders. However, for SMH we have come across a counterintuitive usage. The chart below highlights all dates when:
- The 3-day average of SMH Optix crossed above 80%
- While SMH was above its 200-day moving average
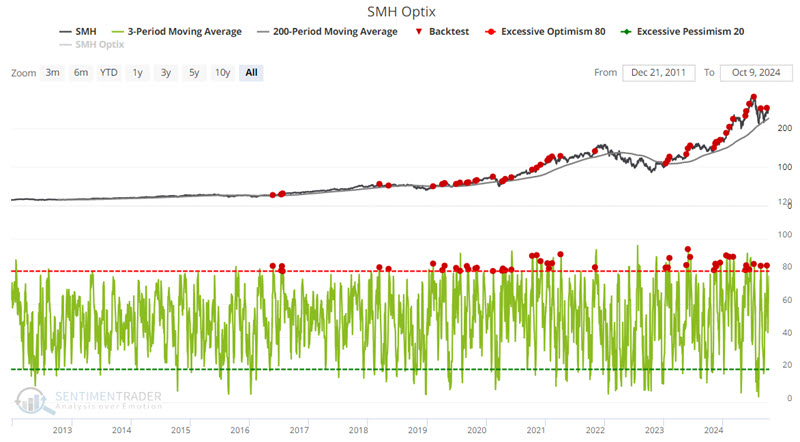
The table below summarizes subsequent SMH performance.
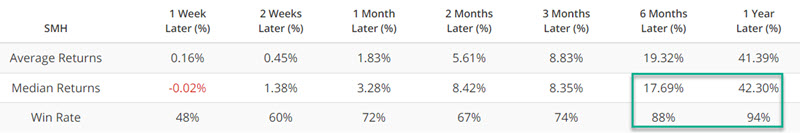
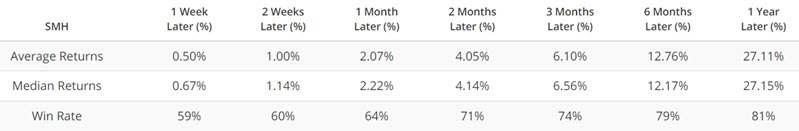
The six- and twelve-month results are extremely compelling, with Win Rates of 88% and 94%, respectively, and Median Returns of 17.69% for six months and 42.30% for twelve months. For the sake of comparison, SMH performance for all trading days appears in the chart below.
What the research tells us…
The above information implies that the semiconductor sector is about to take off and race sharply higher. However, there is no guarantee of that. Several concerns need to be addressed before committing actual capital. The semiconductor sector should always be approached as a "high risk, high potential reward" arena. The massive drawdowns and losses incurred in the 1986-1987 and 2007-2008 seasonal periods detailed above are proof positive of this. Likewise, the semiconductor sector is presently fighting to maintain its leadership status. While some major indexes are touching new all-time highs, SMH is still about 10% off its July 2024 peak.
Bottom line: There is "potential" for another big runup in semiconductor stocks in the months ahead. However, investors should carefully consider their own risk tolerance before considering taking the plunge. Once that decision is made, the next question for everyone to answer is how much capital to allocate.