
A Potential Opportunity in Healthcare

Key points:
- After thirteen years of steady gains, the Healthcare sector has essentially traded sideways over the past four years
- Regarding the short-term, trader sentiment recently fell to a low enough level to flash a favorable contrarian signal, and seasonality is entering the most favorable time of the year for the Healthcare sector
- Additionally, corporate insiders have spent much of the last year heavily buying their own shares
- This combination of factors suggests the potential for strength in the very near-term, and better days ahead for the sector overall
Healthcare has been a laggard for years
For many years, the Healthcare sector was a source of steady growth and consistent price appreciation. But the bloom came off that rose in recent years. In the weekly price chart below for the State Street Health Care Select Sector SPDR ETF (XLV), we see a long, consistent rise from 2009 to 2022. We also see the choppy sideways action that has been the norm in the four years since then.
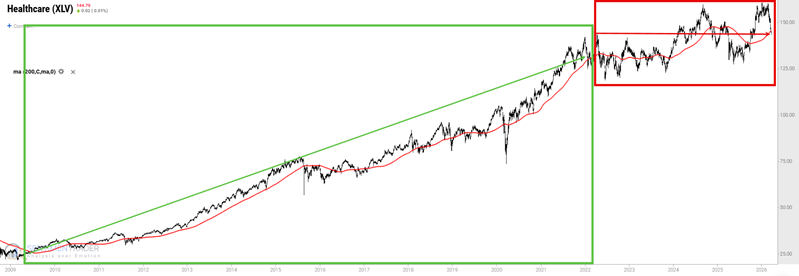
Ticker XLV is essentially unchanged from its April 2022 level. So, is this sector doomed to continue to languish? Or is there a potential for better days ahead? A variety of factors and data points suggest the latter.
Pessimism hits a significant level
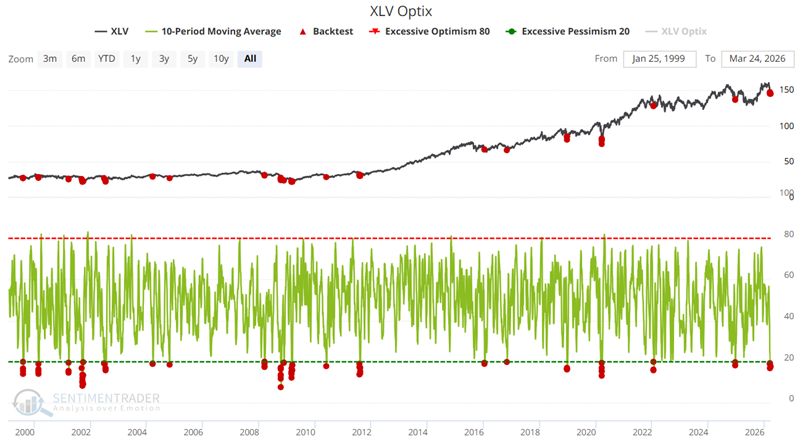
Our XLV Optix indicator measures trader sentiment for a given index, sector, or commodity. Low readings suggest a lack of bullishness, which is generally interpreted in a contrarian manner. The chart below highlights all dates when the 10-day average for XLV Optix was below 20, including all overlapping signals.
The table below summarizes subsequent XLV performance.

Note the 89% Win Rate and 6.18% median gain for 1 month after all signals. This suggests a potential trading opportunity. Let's test the following setup:
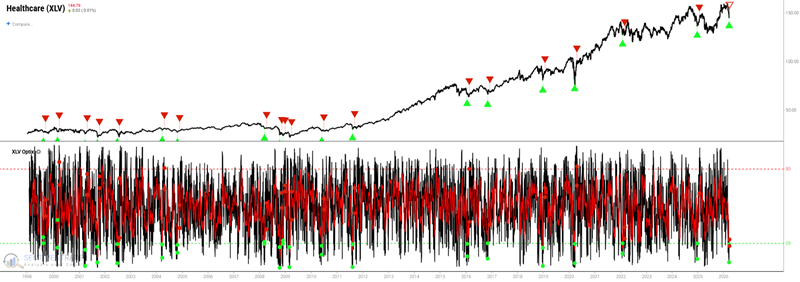
- If the 10-day average of XLV Optix drops below 20, buy and hold XLV for 21 trading days.
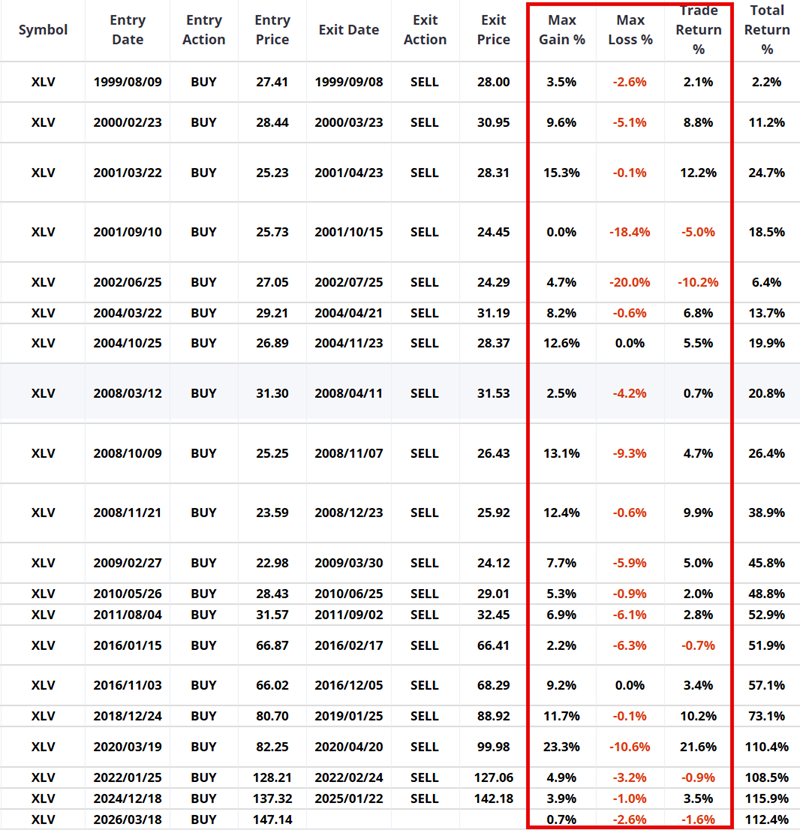
Note that this will eliminate several duplicate signals from the original test (since no new signals are acted upon until the original signal has run its course of 21 trading days). The chart below displays the entry and exit dates for all signals in this test. The most recent signal occurred on March 18th.
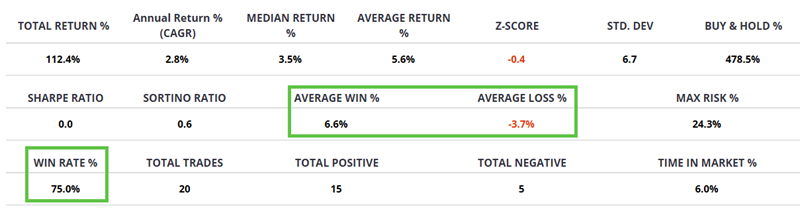
The table below summarizes results using a 21-day holding period. The Win Rate is 75%, and the Average Win outpaces the Average Loss 6.6% to 3.7% (or 1.78-to-1).
The table below shows the hypothetical trade-by-trade results. It is helpful to peruse the Max Loss % column to see what kind of decline a trader would have had to sit through to generate the ending Trade Result %.
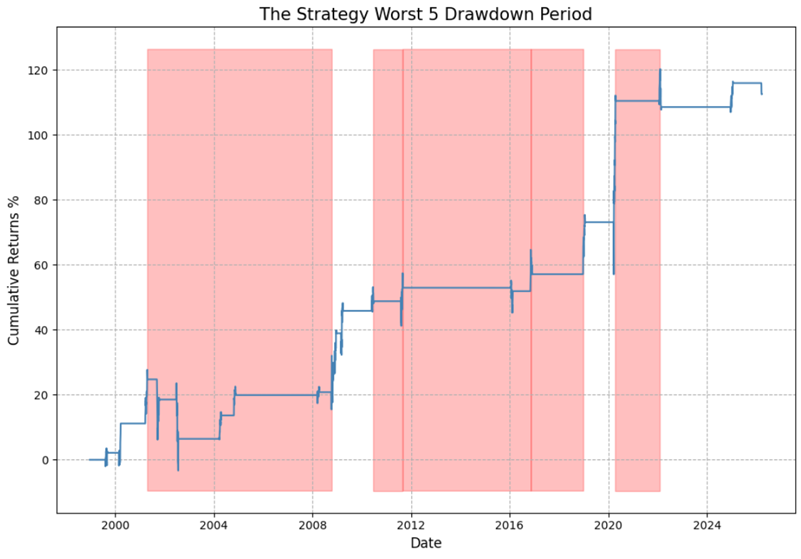
To get a visual sense of the trade-off between reward and risk, the chart below shows the hypothetical cumulative returns from holding XLV during the periods listed in the table above. As with most any systematic approach, there is some volatility along the way. Still, the "Lower-left-to-upper-right" nature of the equity curve suggests a potential opportunity for short-term traders.
The 21-trading-day holding period for the signal generated on March 18th runs through the close on April 17th.
Seasonality could lend a favorable tailwind
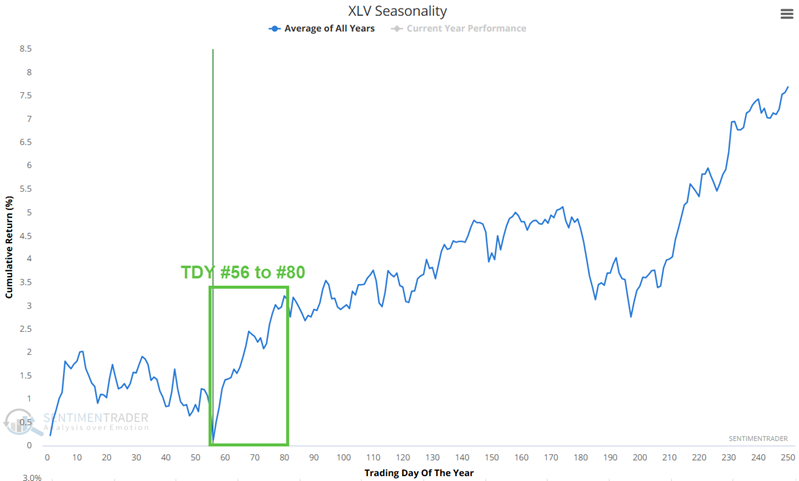
The Healthcare sector is entering a typically favorable seasonal period. The chart below shows the Annual Seasonal Trend for XLV. The period highlighted extends from Trading Day of Year (TDY) #56 through TDY #80. For 2026, this extends from the close on March 24th through April 28th.
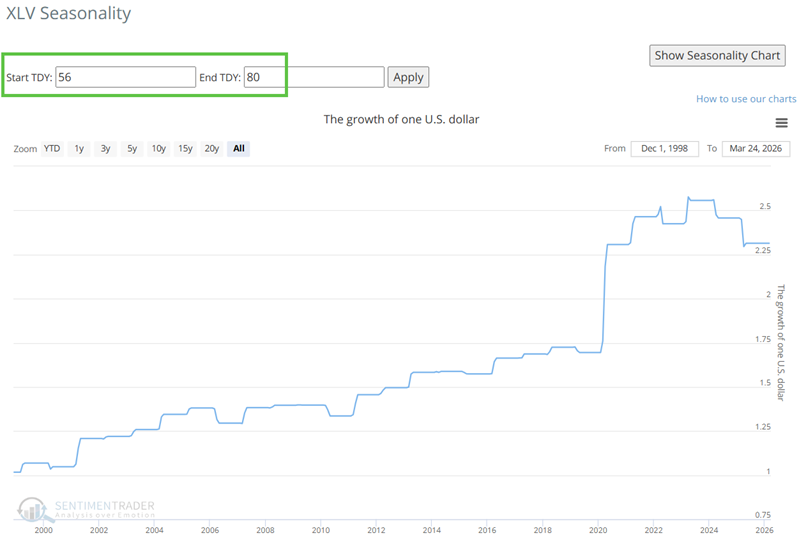
The chart below displays the hypothetical growth of $1 invested in XLV only during this period every year since XLV started trading in 1999.
Insider buying has been notable
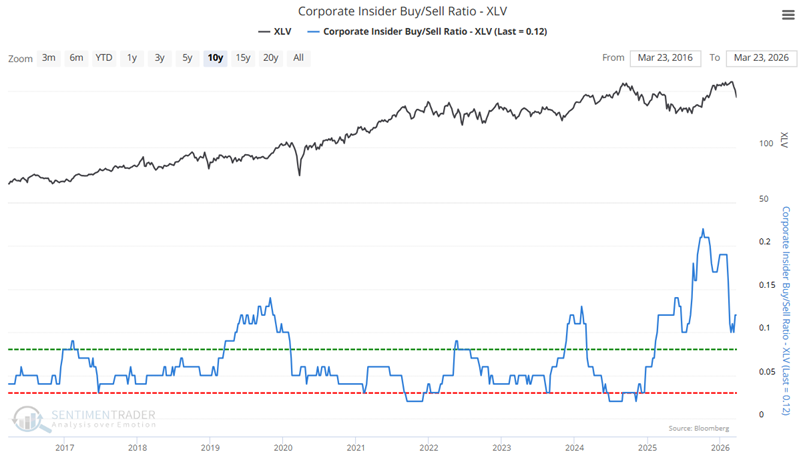
Corporate insiders typically have the best insight into their company's fundamentals and the industry as a whole. In light of this, recent insider activity in the Healthcare sector can be construed favorably.
The chart below shows our Corporate Insider Buy/Sell Ratio - XLV. Note the heavy buying that has taken place in the last year, despite the lack of significant upside price action. This suggests that insiders are looking ahead and, despite the lack of near-term gains, continue to add to their positions.
Let's apply a longer-term approach to analyzing Healthcare insider buying. The chart below highlights all weeks when the 10-week average for this indicator was above 0.12.
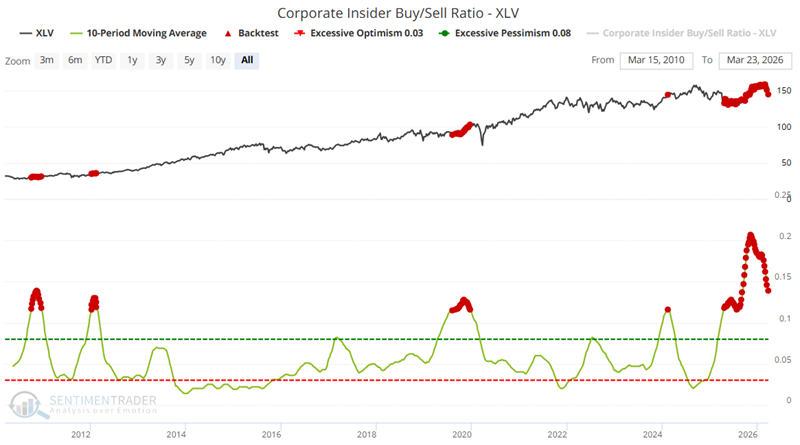
The table below summarizes subsequent XLV performance.

The key thing to note in the table above is the above-average Win Rates across timeframes. Once again, while no single indicator signal guarantees future performance, the historical results suggest good reliability.
What the research tells us…
With positive sentiment, seasonality, and insider activity, the Healthcare sector presently enjoys a very favorable setup. Now, whether that setup actually translates into a profitable trade over the next month and beyond remains to be seen. The sentiment and seasonality factors suggest the potential for a successful short-term trade, while the heavy, extended buying by corporate insiders suggests the potential for a longer-term opportunity. Regardless, as traders and investors, our job is to spot opportunities and decide whether to play them. Once the decision is made to jump in, each trader is responsible for deciding a) what to buy (or sell short), b) how much to buy (or sell short), and c) how to manage risk. The information above equates to "spotting an opportunity." What to do with it from there, if anything, is up to you.