Products
SentimenTrader Trading Tools
‍
Backtest Engine
My Trading Toolkit
Correlation Analysis
Seasonality
Market Prediction
Indicators & Data API
‍
Proprietary Indicators & Charts
Market Data API
Strategies & Scanner
‍
50+ Trading Strategies
Smart Stock Scanner
Smart Option Scanner
Research Reports
‍
Research Solutions
Reports Library
Free Resources
Simple Backtest Calculator
Simple Seasonality Calculator
The Kelly Criterion Calculator
Sentiment Geo Map
Public Research Reports
Education
Sentiment Indicators
Technical Indicators
Pricing
Company
About
In the News
Testimonials
Client Success Stories
Contact
Log inLoginSign up
< BACK TO ALL REPORTS

A Potential Bearish-to-Bullish Transition in Natural Gas

by Sentimentrader
2025-11-03
Natural Gas just flashed a 6-month high "base breakout" signal. History shows a 3-mo rally (68% win rate) that fades. Crucially, gas stocks show a bearish divergence. See the data on this volatile, seasonally-supported trade.

Key points:

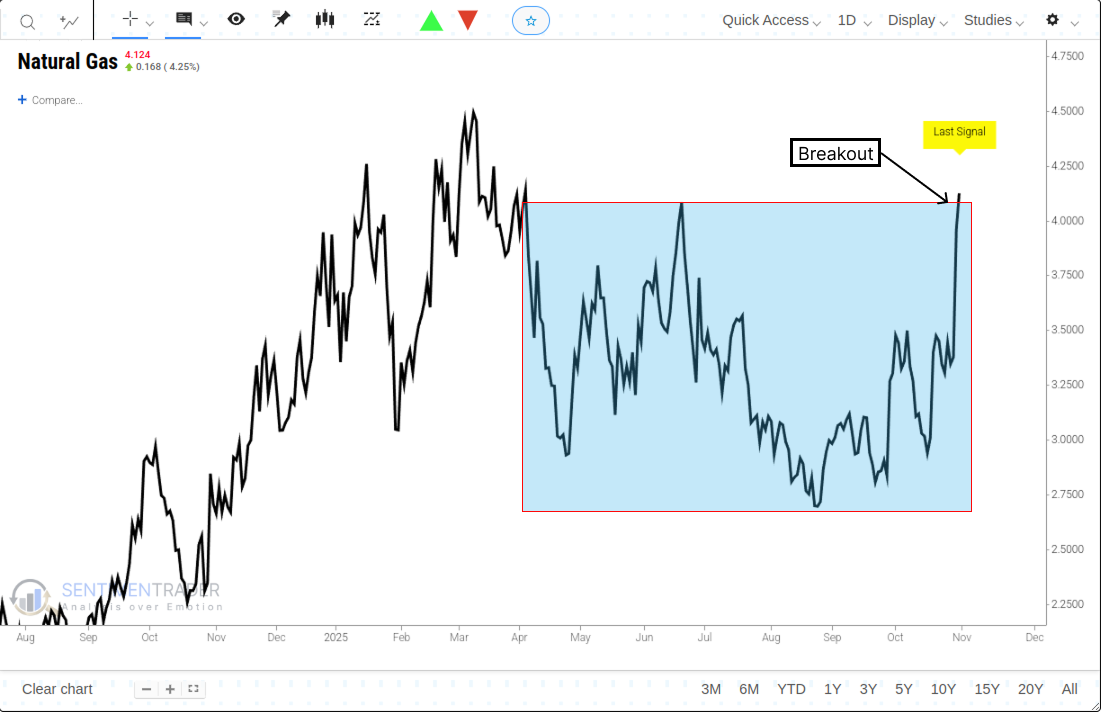
  • Natural gas futures closed at a 6-month high but not a 9-month high, completing a potential base breakout.
  • Historically, similar breakouts have preceded a gain 68% of the time over the subsequent three months, but the path has been volatile.
  • Despite the potential in the commodity, related natural gas stocks have shown a lackluster and divergent historical performance.

A potential bearish to bullish transition in natural gas  

Natural gas trading is often not for the faint-hearted. The commodity has spent most of the past several months in a wide, sideways pattern. Last Friday, a significant development occurred in this basing pattern. Natural gas futures surged, closing at a new 6-month high. However, this high was not simultaneously a new 9-month high. This specific type of breakout, which clears the recent range but not the longer-term highs, often signals that a bottoming process is completing and a new uptrend may be emerging.

Similar breakouts suggest a choppy path forward

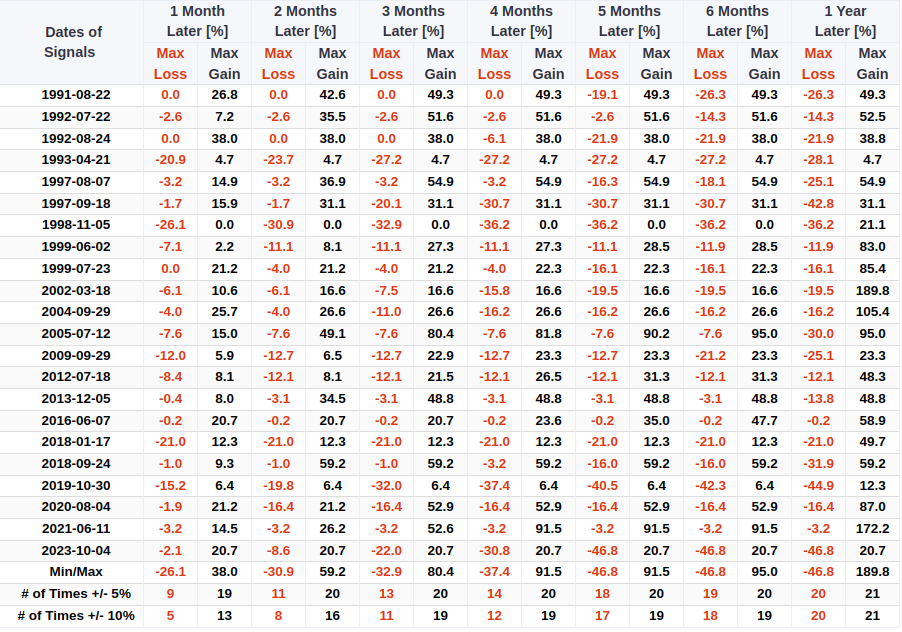
When natural gas completes a base breakout pattern after a 1-year low, the historical performance has been inconsistent and highly volatile. The commodity showed a positive median return and a 68% win rate over the subsequent one and three-month periods, suggesting some potential for a short-term follow-through. For related backtest, click here.

However, that momentum has historically faded. The win rate drops significantly to 50% at the four-month mark and hits a low of just 36% at the six-month mark. 

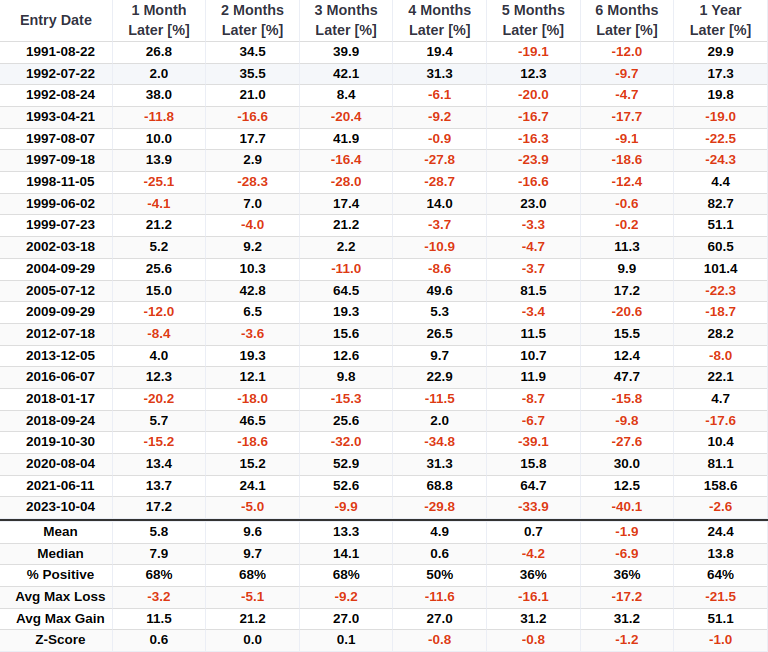
While the median maximum gain has often exceeded the median maximum loss, the drawdowns have been severe. In multiple instances, the maximum loss over the following year exceeded -40%. 
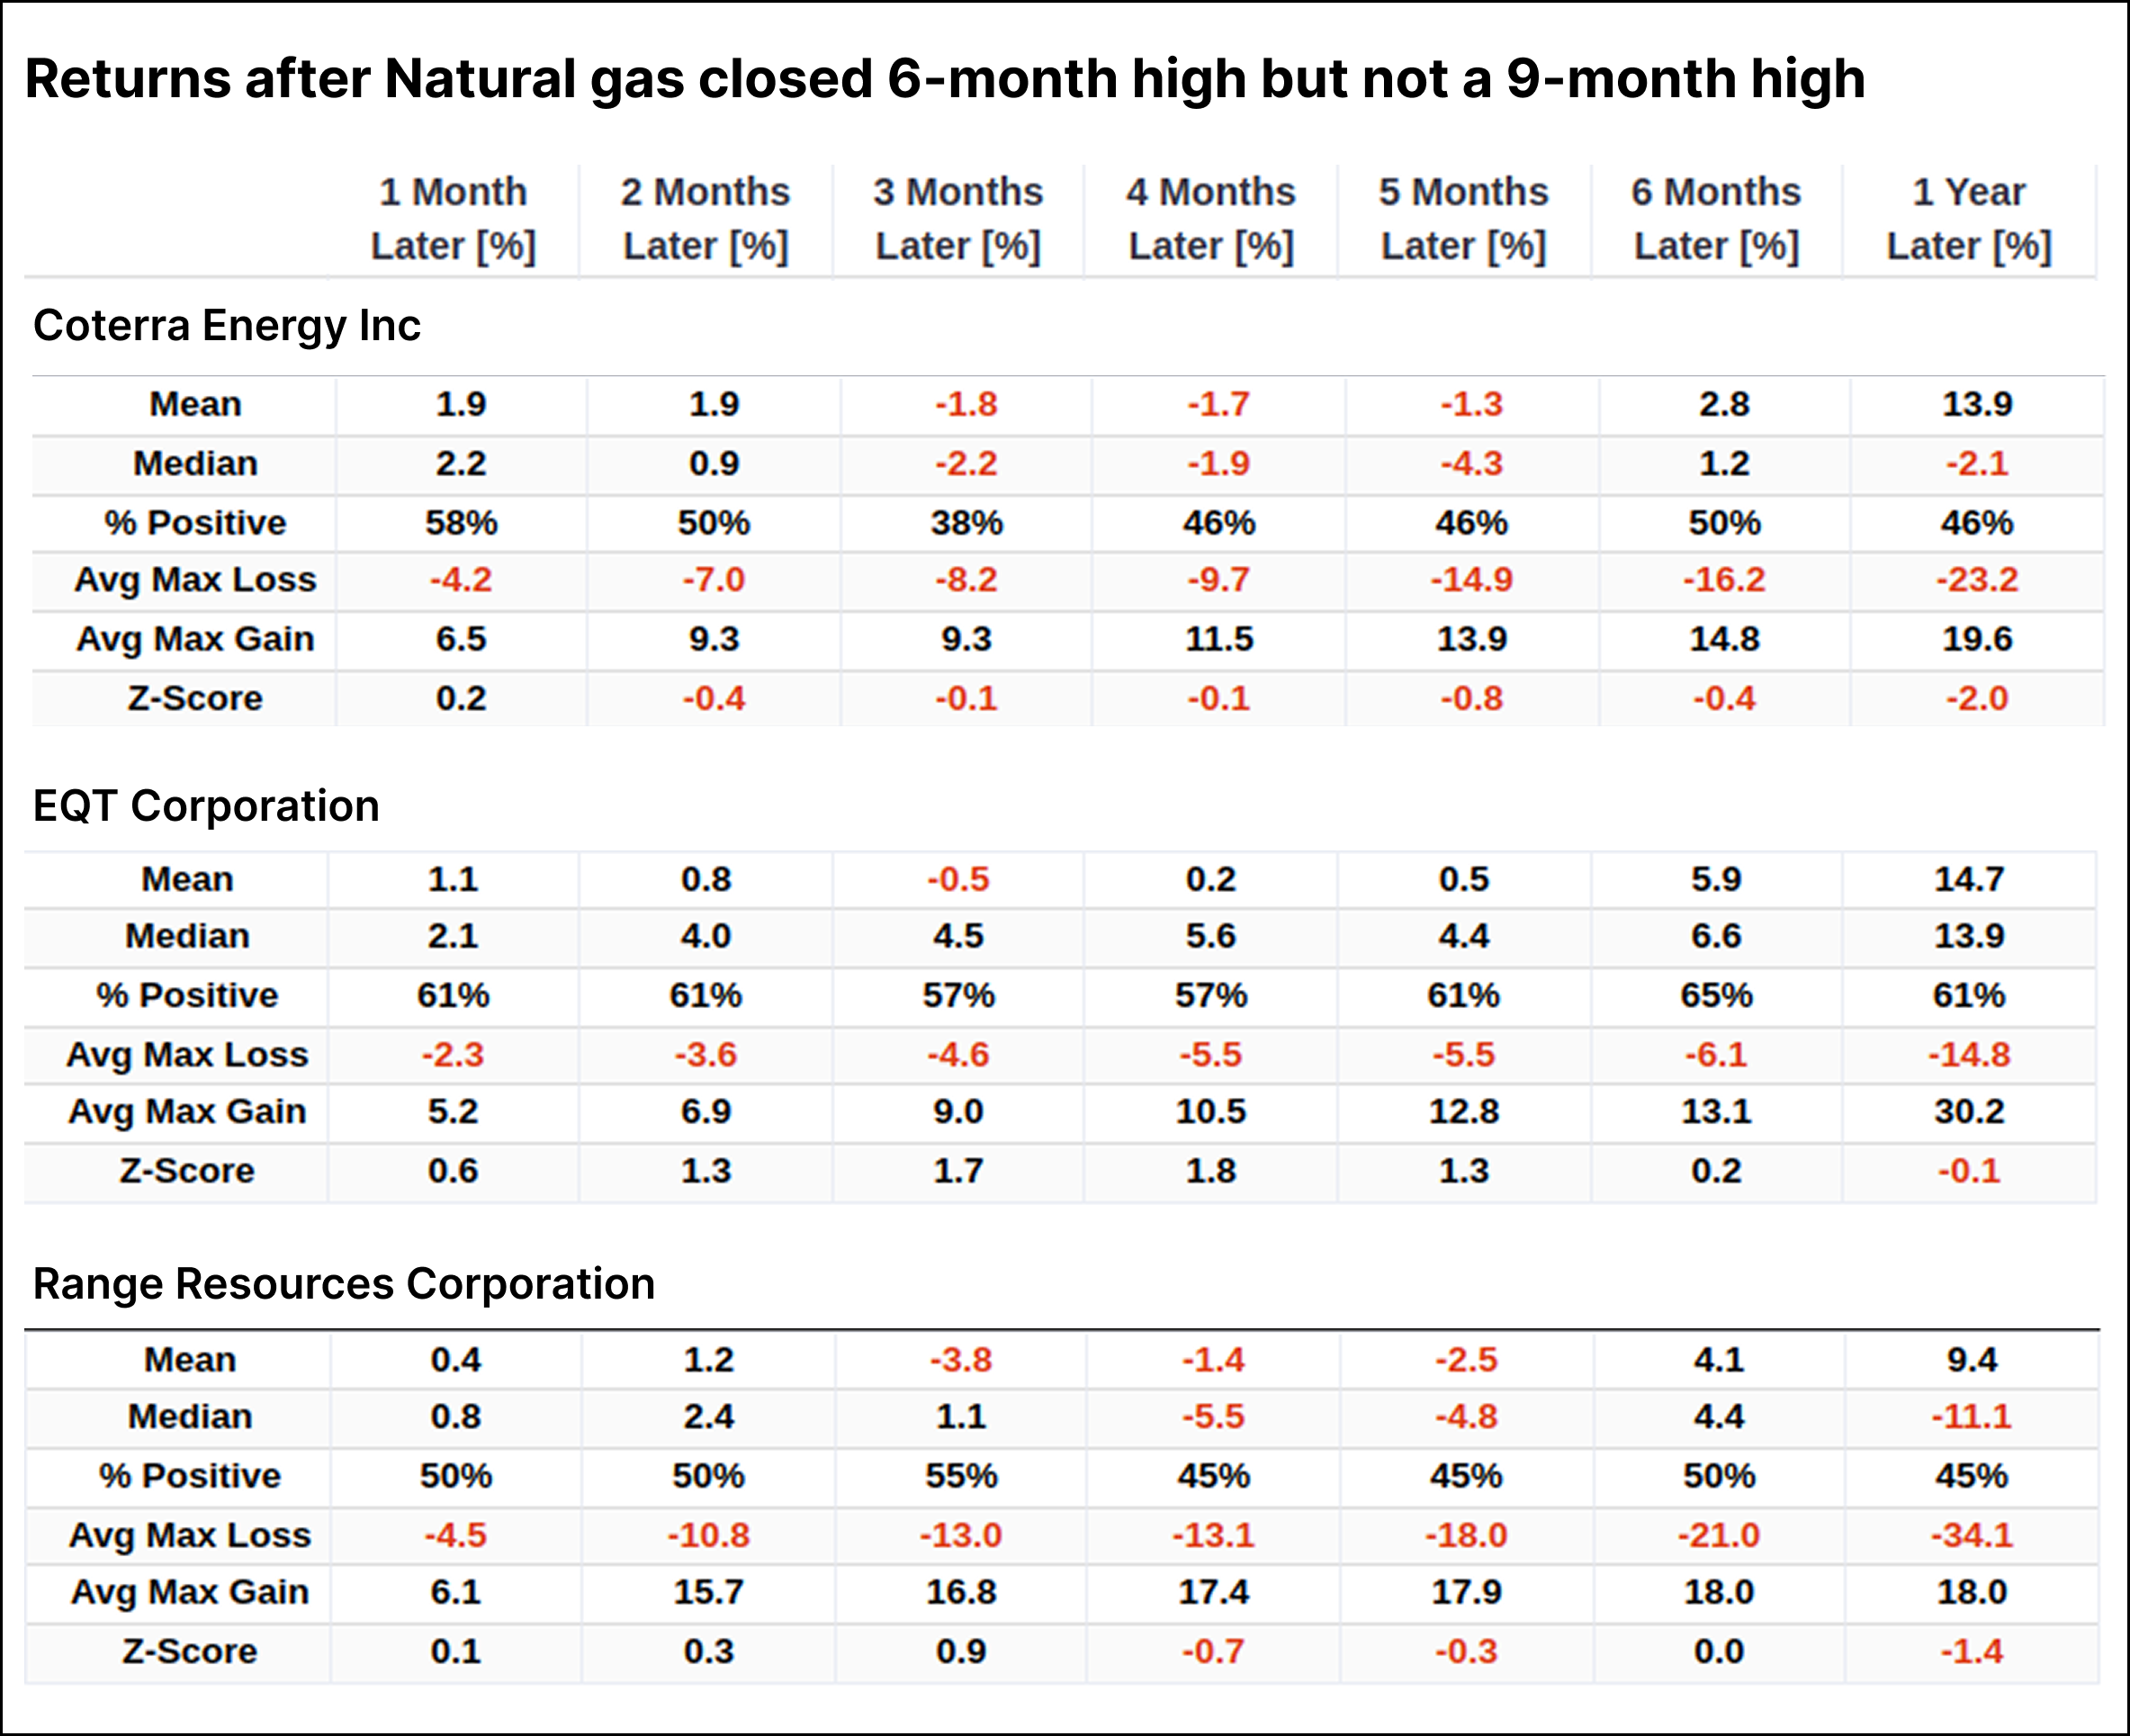
Natural gas stocks

Surprisingly, the returns and win rates of various natural gas stocks appeared lackluster, showing a clear divergence from the commodity's performance. Unlike the commodity, which showed a strong 68% win rate over the next three months, the stocks' performance was mixed to poor. Therefore, it might be wiser to consider an allocation to the physical commodity itself, a task made accessible through an ETF like UNG.
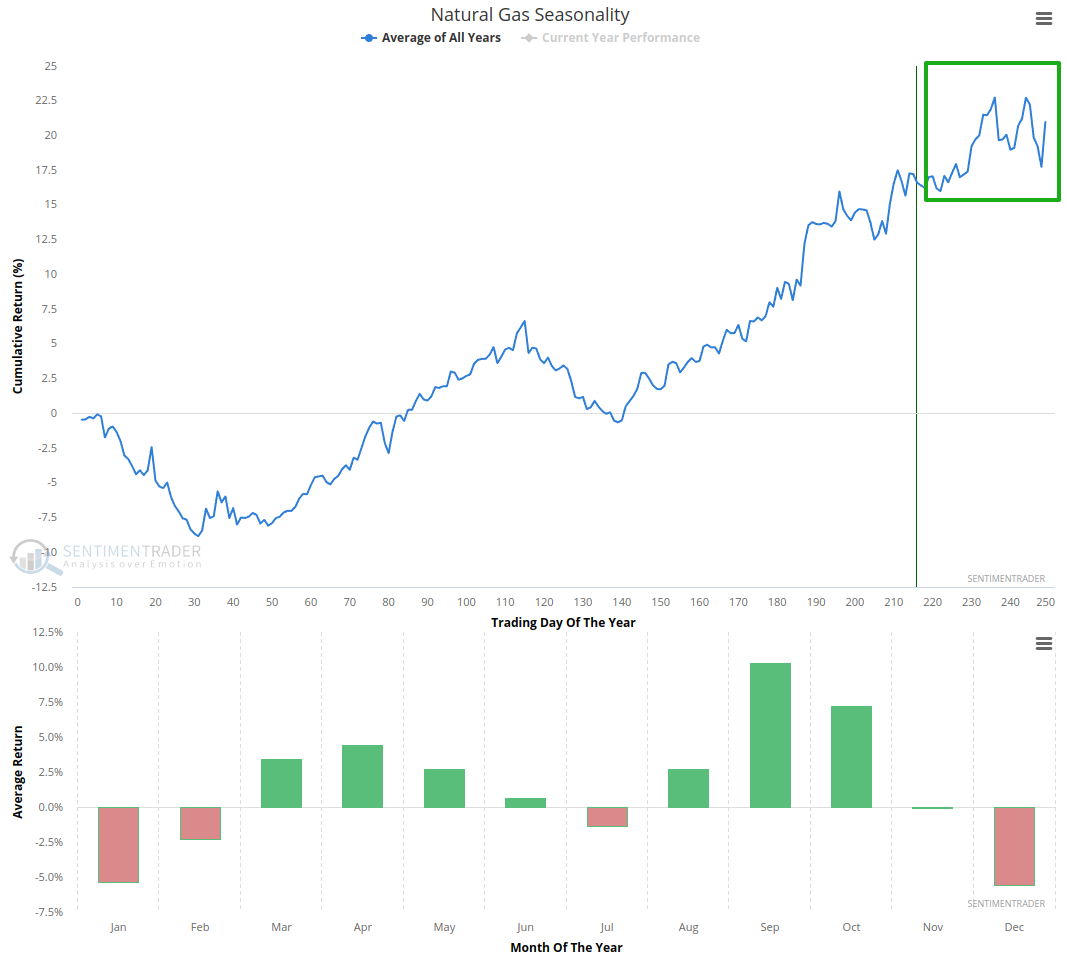
Seasonality

If history rhymes, seasonality should provide a tailwind for the next several weeks. 

What the research tells us...

Natural gas trading is not for the faint-hearted. A significant development occurred just last week when it soared to a new six-month high, hinting at the possibility of a transition to an uptrend. Even with this confluence of signals, the historical path has been volatile, with weak performance at the 6-month mark. Furthermore, natural gas stocks have historically remained on the sidelines, failing to participate with the same strength as the commodity itself. 

PRODUCTS
SentimenTrader
Trading Tools
Indicators & Data API
‍
Strategies & Scanner
‍
Research Reports
FREE
RESOUrCES
Simple Backtest
Calculator
Simple Seasonality
Calculator
The Kelly Criterion
Calculator
Sentiment Geo Map
‍
Public Research Reports
‍
Education
Sentiment Indicators
‍
Technical Indicators
‍
Pricing
Bundle pricing
‍
FAQ
‍
Announcements
‍
COMPANY
‍
About
‍
In the News
‍
Testimonials
‍
Client Success Stories
CONTACT
‍
General Inquiries
‍
Media Inquiries
‍
Financial Professionals Inquiries
‍
© 2026 Sundial Capital Research Inc. All rights reserved.
Setsail Marketing
TermsPrivacyAffiliate Program
Risk Disclosure: The information and tools provided are for research and analytical purposes only and are not intended as investment advice. Market analysis involves uncertainty, and outcomes may differ from expectations. Users should conduct their own due diligence and consider their individual circumstances before making any financial decisions. Past performance is not necessarily indicative of future results.

Hypothetical Performance Disclosure: Hypothetical performance results have many inherent limitations, some of which are described below. No representation is being made that any account will or is likely to achieve profits or losses similar to those shown; in fact, there are frequently sharp differences between hypothetical performance results and the actual results subsequently achieved by any particular trading program. One of the limitations of hypothetical performance results is that they are generally prepared with the benefit of hindsight. In addition, hypothetical trading does not involve financial risk, and no hypothetical trading record can completely account for the impact of financial risk of actual trading. for example, the ability to withstand losses or to adhere to a particular trading program in spite of trading losses are material points which can also adversely affect actual trading results. There are numerous other factors related to the markets in general or to the implementation of any specific trading program which cannot be fully accounted for in the preparation of hypothetical performance results and all which can adversely affect trading results.

Testimonial Disclosure: Testimonials appearing on this website may not be representative of other clients or customers and is not a guarantee of future performance or success.