
A positive for Technology (and the difference between indicators and trading systems)

Key points
- There is a natural urge to try to turn a single indicator into a standalone trading system
- This is typically a mistake, as doing so leaves out crucial elements such as positing sizing and risk management
- This piece looks at an example with a "100% Win Rate" AND a potentially fatal flaw
Strength tends to beget strength in the Tech sector
For our test:
- We will use the FAMA French Technology Index from 1950 to 1991 and then the S&P 500 Technology sector index after that
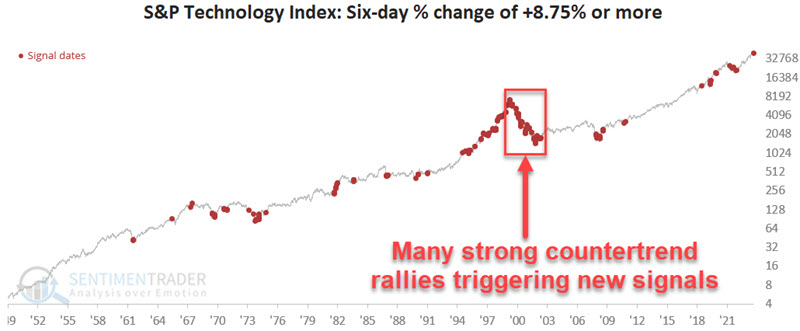
- Our "entry trigger" will be a six-day percentage gain for the index of +8.75% or more
- After any entry trigger signal, we will assume that we hold a position in the technology index for 252 trading days
- If a new entry trigger signal occurs while a previous signal is still active, we will extend the holding period for another 252 trading days
This version of the "strategy" includes no other exit or stop-loss mechanism.
First, the good news
The table below displays the hypothetical percentage return generated by the technology sector index for each holding period generated by using the trading rules above. Note that a new entry signal occurred on 2024-08-15.
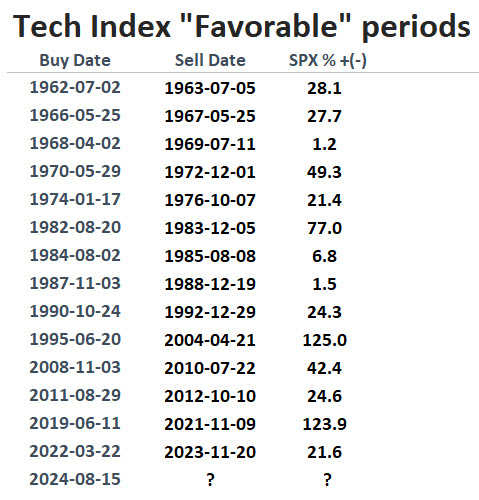
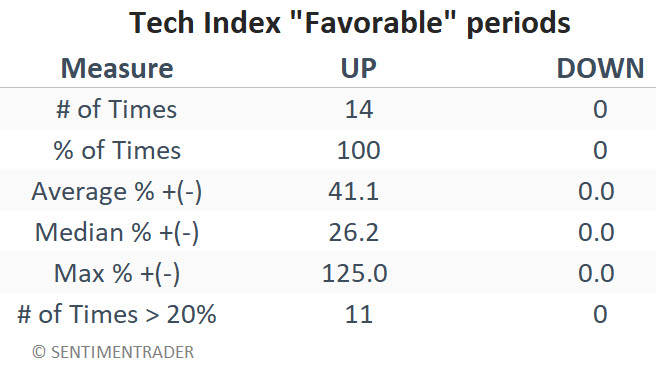
As you can see in the table above, 100% of "holding periods" showed a gain for the technology index. So, it is reasonable to assume that there is some value in the simple "six-day gain of +8.75% or more" signal. The table below summarizes the results.
Now for the bad news
Despite the 100% Win Rate shown above, a closer look reveals that this strategy is a good example of one that contains a potential flaw (i.e., no risk management) that would - and probably should - preclude most investors from using this as a standalone trading system.
The chart below displays the day-to-day equity curve (i.e., the hypothetical growth of $1 invested in the technology index only during the periods indicated in the first table above). Notice anything?
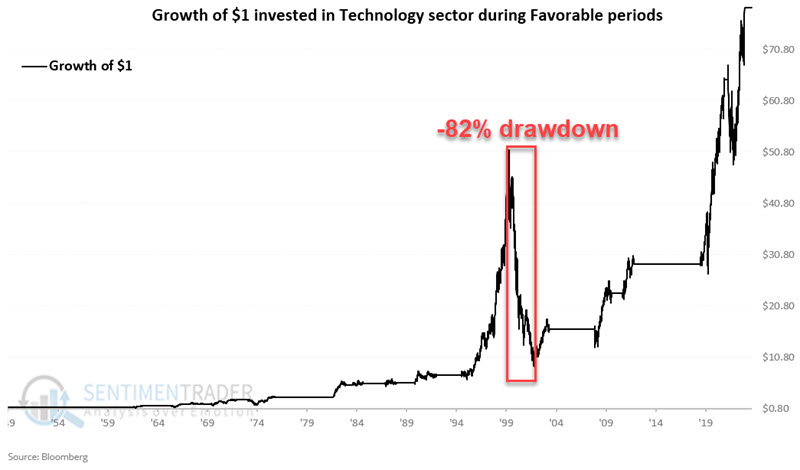
Chances are you are not so much impressed by the equity curve's overall "lower left to upper right" nature as you are horrified by the catastrophic plunge that occurred during the 2000-2002 period. During this time, the tech sector kept experiencing the occasional "entry trigger" in the midst of the devastating decline following the bursting of the tech "bubble" in 2000.
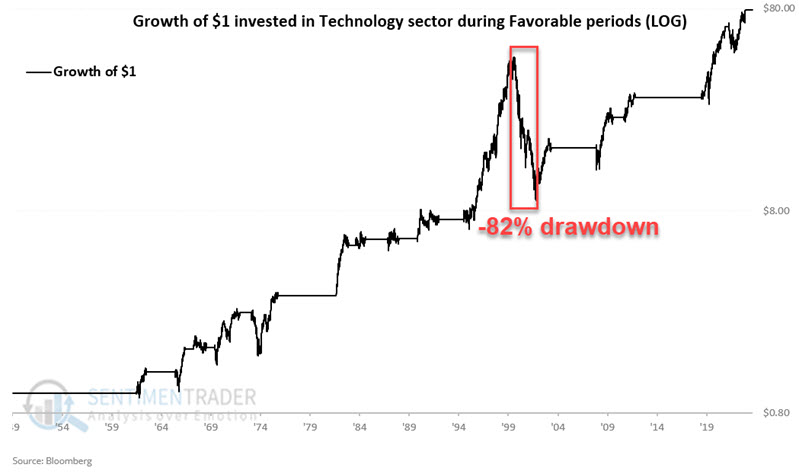
We can gloss this over to some extent by looking at the same results on a logarithmic basis in the chart below. But an 82% is still an 82% drawdown.
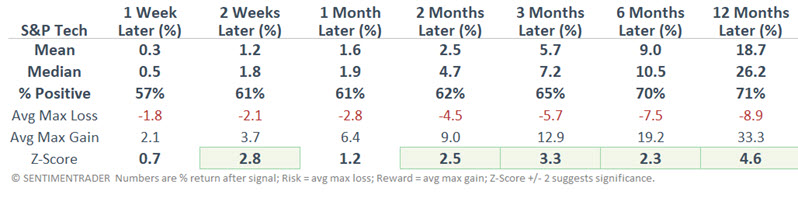
The chart and table below display results following every "+8.75% in six-day" signal generated by the technology index since 1950.
Reassessing the big picture
The table below displays the same results as the first table in this piece. However, it adds two columns. After the first three columns show the start and end dates of all favorable periods (which extend from the first entry trigger signal through 252 trading days after the most recent entry trigger signal) and the net percentage return, the following two columns show:
- Max. Drawdown from entry price: This shows the largest drawdown from the technology index closing price on the date of the entry trigger, i.e., the largest open loss an investor would have had to sit through)
- Max. Drawdown from any peak: This shows the largest drawdown from any peak achieved during the entire holding period
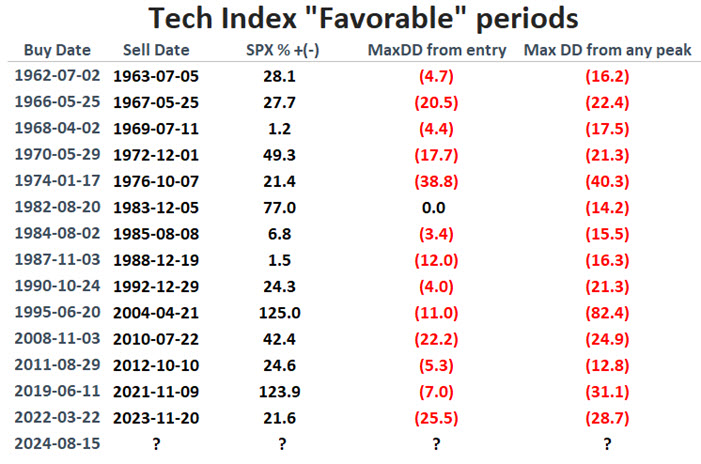
Note that on four occasions, an investor who bought on the signal date would have had to ride out a decline of -20% or more before realizing the ultimate gain. However, the real "800 lb. gorilla in the room" is the -82.4% decline experienced during the 2000-2002 period.
From the 1995-06-20 signal through 2000-03-27, the technology index gained a whopping +605%. By the time the tech plunge's nadir occurred on 2002-10-09, the open gain was a mere +24%. By the time the actual holding period ended, the gain was back up to +125%.
Could an investor have held on throughout that -82% decline? Or maybe a better question is, "Should" an investor have held on throughout that decline? Unfortunately, that is a question each investor must answer for themselves.
What the research tells us…
As of the close on 2024-08-15, the S&P 500 Technology Index generated an "entry trigger" signal by generating a six-day gain over +8.75%. Based on the first table in this piece, one could pound the table and argue that there is a 100% probability of higher prices for the tech sector between now and 252 trading days after the latest signal (remembering that there could be more signals that extend this holding period). Unfortunately, this is a flawed approach. The table above shows "all" entry signals found the tech sector higher 252 days later only 71% of the time. The overly optimistic take completely ignores the 82% drawdown accrued during the deflating of the tech bubble.
The good news is that the latest signal strongly suggests that the tech sector could continue to advance in the year ahead. The bad news is there are no guarantees that it will be a smooth ride. Remember, indicator signals are almost invariably best used as "weight of the evidence" and not as standalone trading systems.