
A persistent decline in US earnings revisions

Key points:
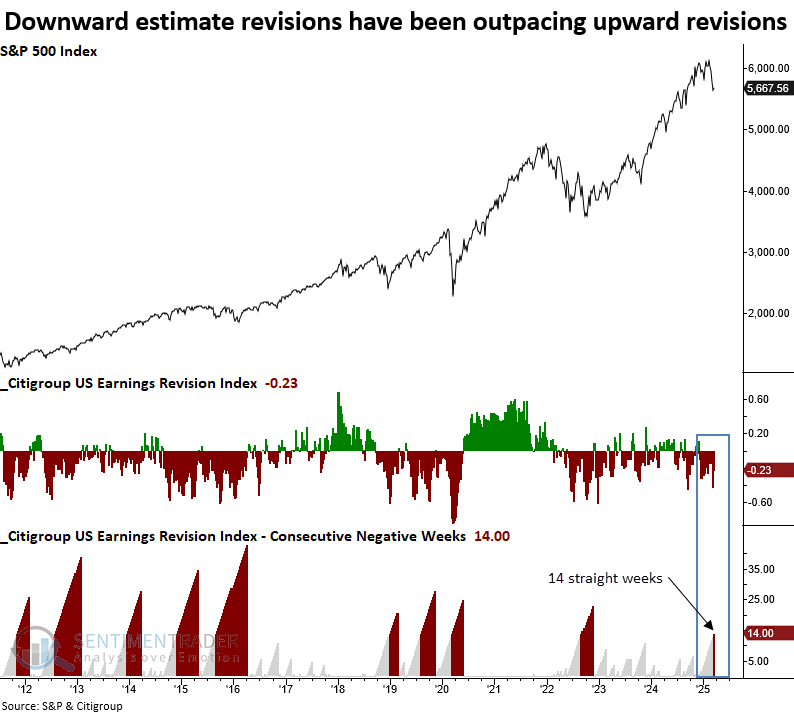
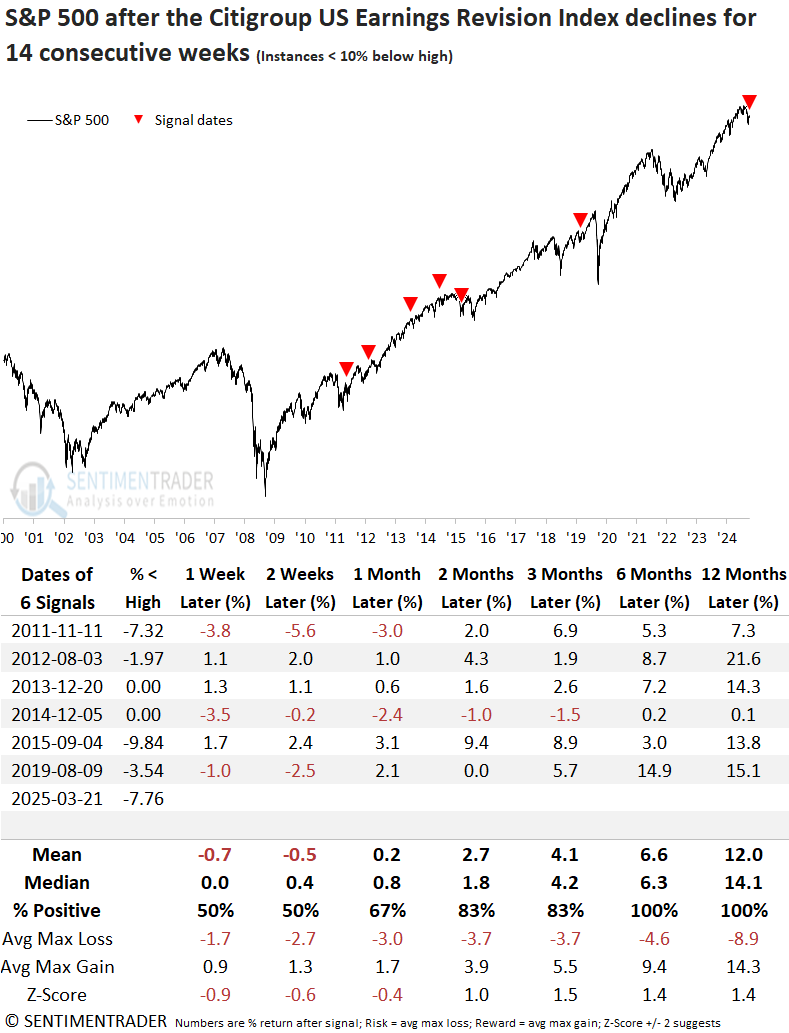
- The Citigroup US Earnings Revision Index has fallen for 14 consecutive weeks
- Similar streaks preceded an unfavorable outlook for the S&P 500 over the subsequent month
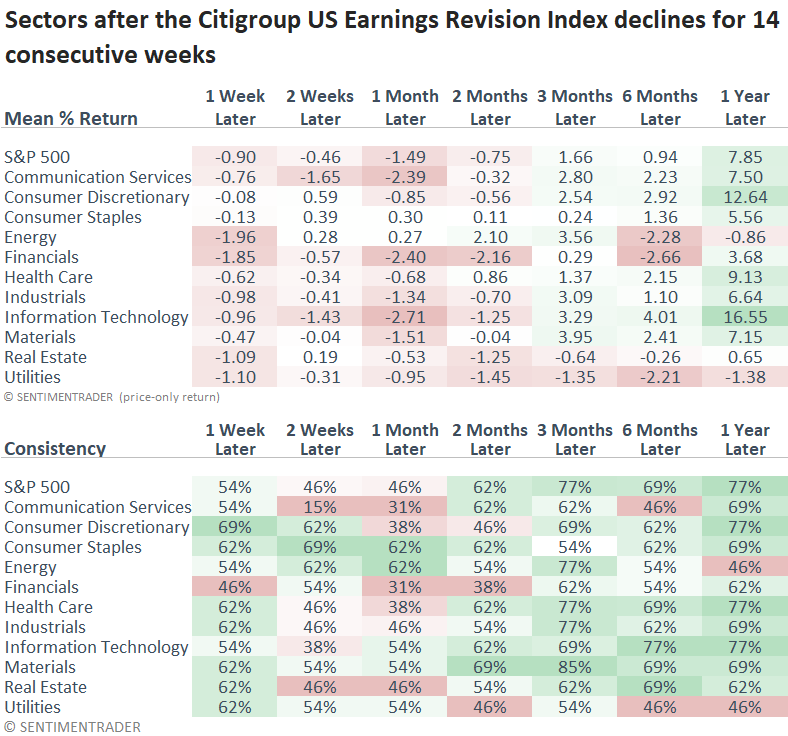
- Cyclical sectors typically suffered, whereas defensive groups outperformed the broad market
Have analysts become too bearish on the outlook for earnings?
Wall Street analysts have been busy revising earnings estimates downward. Over the last 14 weeks, the Citigroup US Earnings Revision Index, which measures the net number of upward revisions minus downward revisions, has fallen every week, the longest streak since the depths of the 2022 bear market.
Although the revisions index generally has a negative bias, streaks of this magnitude typically occur during periods of stock market stress, hinting at some broad market headwind. The latest downswing may be driven by uncertainty surrounding tariffs and their economic impact, though I suspect multiple factors are at play.
The critical question surrounding analysts' estimate revisions is whether they genuinely reflect economic shifts or merely echo prevailing sentiment. When analysts turn overly pessimistic, could it serve as a contrarian buy signal?
Comparable estimate revision streaks saw stocks struggle in the near term
Whenever the Citiroup Estimate Revisions Index declined for 14 consecutive weeks, the S&P 500 struggled over the subsequent month, displaying unfavorable returns and consistency. At some point over this same time frame, the large-cap index declined in 9 out of 13 cases.
However, if we're in a growth scare correction and not a bear market, once analysts engaged in sustained estimate reductions, stocks were more likely to approach the latter stages of a drawdown, leading to improved returns and consistency over extended timeframes.
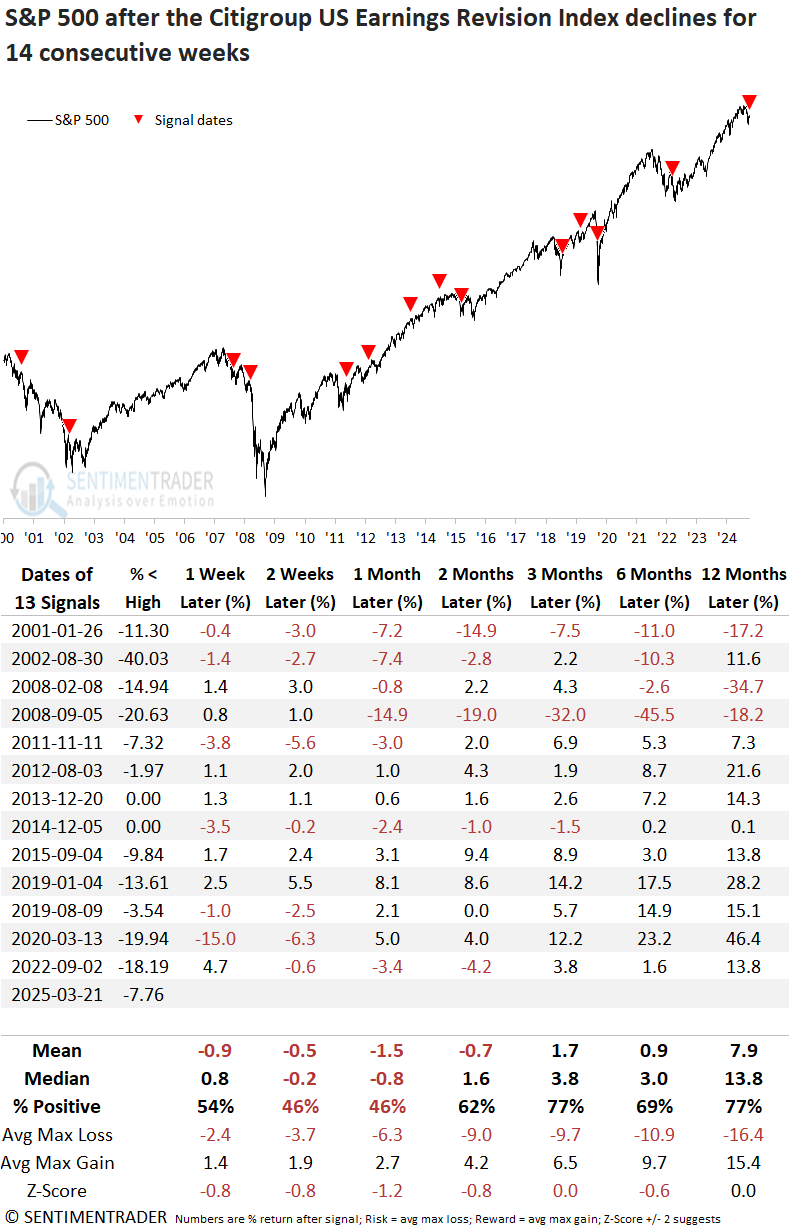
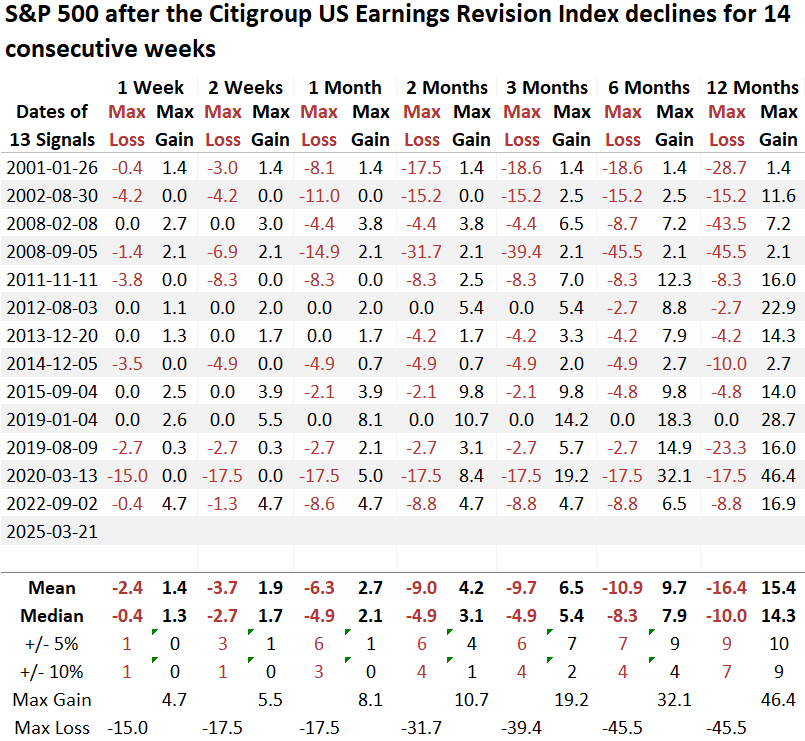
Across all time horizons, the average max loss was more significant than the maximum gain. In four of seven time frames, the median loss surpassed the median gain, signaling a poor risk/reward profile.
Financials and technology struggled with weak returns and win rates in the initial month, while defensive sectors like staples and health care outperformed the S&P 500. By the six- and twelve-month marks, consumer discretionary and technology had emerged as the top-performing sectors.
Context similar to now
Although the sample size is smaller, isolating instances when the S&P 500 was less than 10% below its high, like now, shows a significantly improved medium- and long-term outlook, with the index rising 100% of the time over the following six and twelve months.
Still, equities could see choppy conditions in the near term, a common characteristic of markets consolidating near lows.
What the research tells us...
Earnings projections for U.S. stocks have been trending downward as analysts continue to revise their estimates. Consequently, the Citigroup revisions index has declined for 14 consecutive weeks-a scenario that has occurred 13 other times in history. While earnings revisions are generally biased to the downside, the persistence of these downward revisions of late suggests that macroeconomic factors may be amplifying analysts' negative bias beyond the usual estimate revision cycle. Similar streaks in the revisions index have often coincided with substantial market declines. Regardless of how the current pullback unfolds, the near-term risk outweighs the reward. If the pessimistic outlook on earnings turns out to be an overreaction within the context of a growth scare correction, investors would be wise to add equity exposure if and when price action turns favorable. For now, patience is critical.