
A Period of Typical Seasonal Weakness Nears

Key points:
- Seasonality is generally best used as an "alert of possibilities" rather than as a specific market timing signal
- That said, certain tendencies that span across a variety of sectors and indexes can serve as valuable clues
- A period of typical weakness for a variety of indexes and sectors is almost upon us
Seasonality as a Trading Tool
For my own purpose, I typically use seasonality as a tool to tell me, "When to look where." In other words, I look at seasonal tendencies to highlight potential opportunities rather than trigger specific trades. In most cases, I like to see price action in line with a given seasonal tendency before entering a position. However, there are certain times when a wide array of markets and/or sectors show the same tendency. These can be good times for traders to look for countertrend opportunities, and for longer-term investors to consider hedging their portfolio, whether by raising cash or hedging - possibly via the use of options.
The late February to mid-to-late March period has a history of market weakness. We highlight some specific indices and sectors below.
Market #1: S&P 500 Index (SPY)
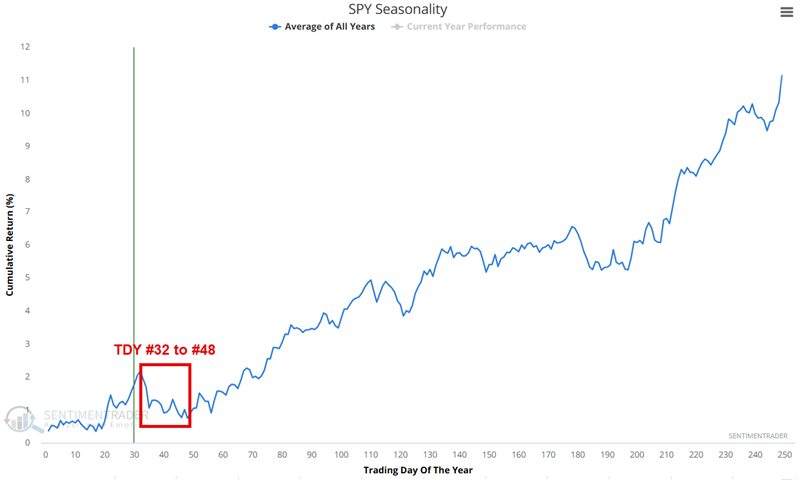
The chart below shows the Annual Seasonal Trend for the State Street SPDR S&P 500 ETF (SPY). An unfavorable period extends from the close on Trading Day of the Year (TDY) #32 through TDY #48. For 2026, this period runs from the close on February 18th through March 12th.
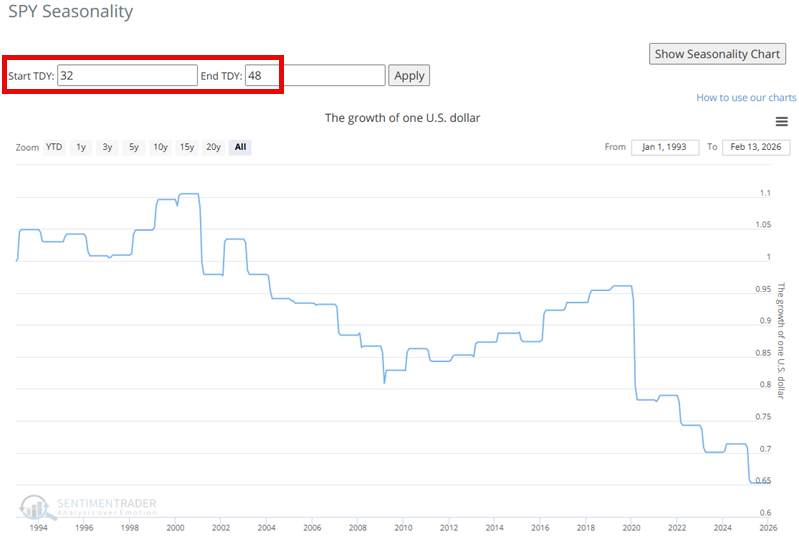
The chart below displays the hypothetical growth of $1 invested in SPY only during this period since 1994. The cumulative loss equals -35%.
Market #2: Russell 2000 Small-Caps (IWM)
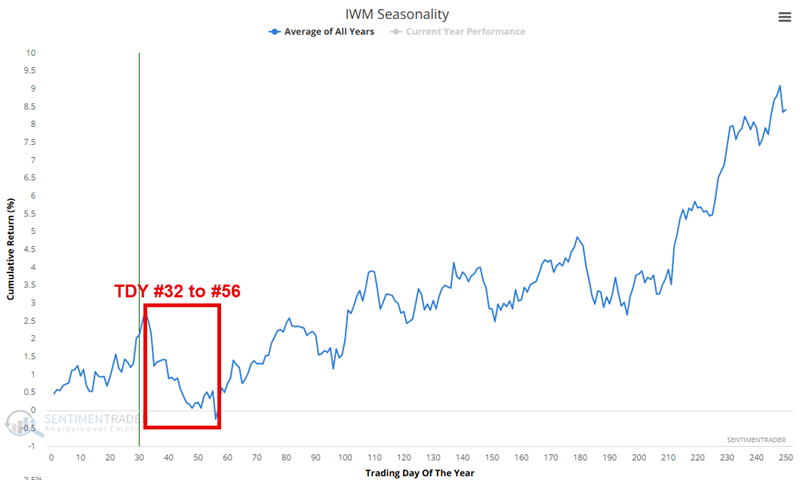
The chart below shows the Annual Seasonal Trend for the iShares Russell 2000 ETF (IWM). An unfavorable period extends from the close on Trading Day of the Year (TDY) #32 through TDY #56. For 2026, this period runs from the close on February 18th through March 24th.
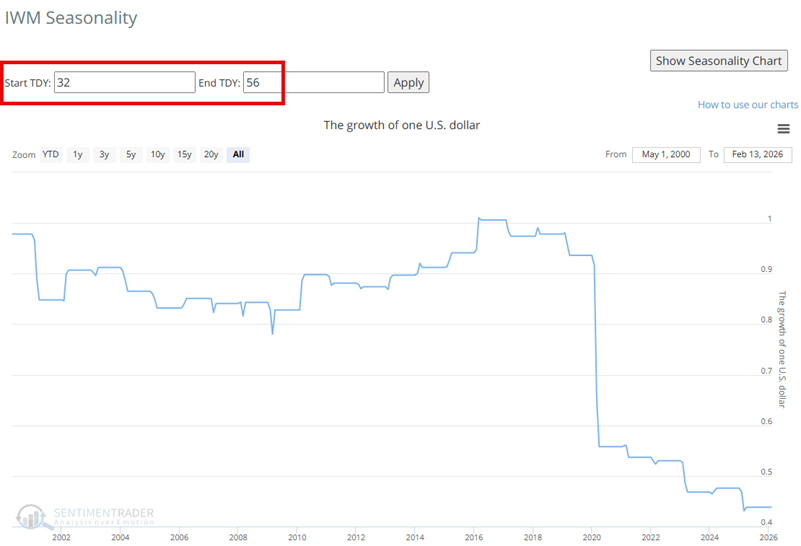
The chart below displays the hypothetical growth of $1 invested in IWM only during this period since 2001. The cumulative loss equals -56%.
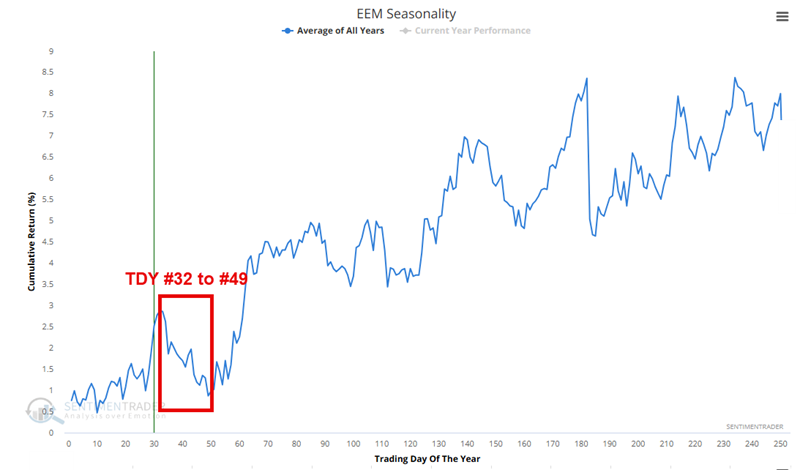
Market #3: Emerging Markets (EEM)
The chart below shows the Annual Seasonal Trend for the iShares MSCI Emerging Markets ETF (EEM). An unfavorable period extends from the close on Trading Day of the Year (TDY) #32 through TDY #49. For 2026, this period runs from the close on February 18th through March 13th.
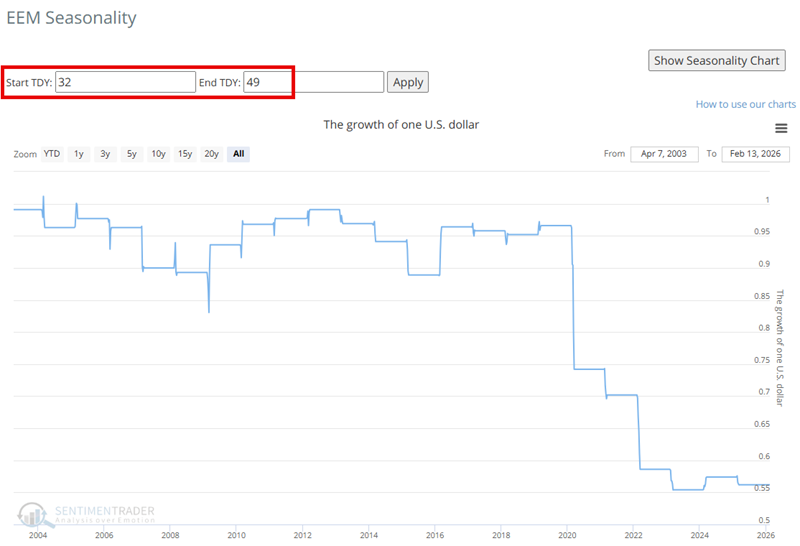
The chart below displays the hypothetical growth of $1 invested in EEM only during this period since 2004. The cumulative loss equals -44%.
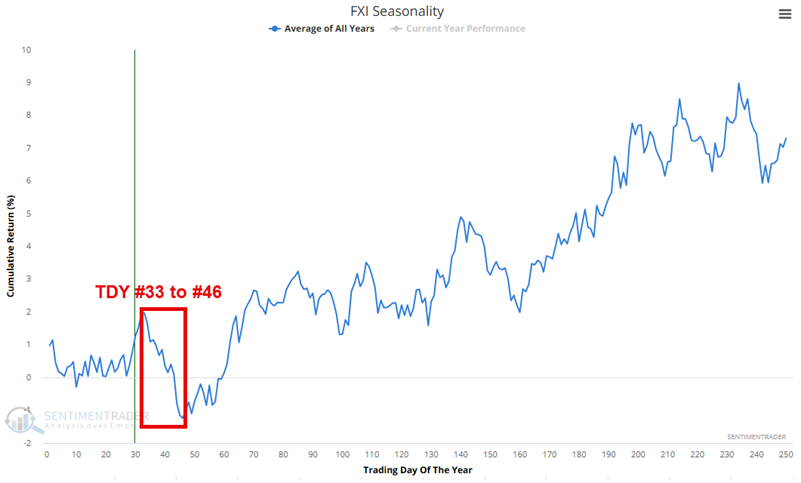
Market #4: China (FXI)
The chart below shows the Annual Seasonal Trend for the iShares China Large-Cap ETF (FXI). An unfavorable period extends from the close on Trading Day of the Year (TDY) #33 through TDY #46. For 2026, this period runs from the close on February 19th through March 10th.
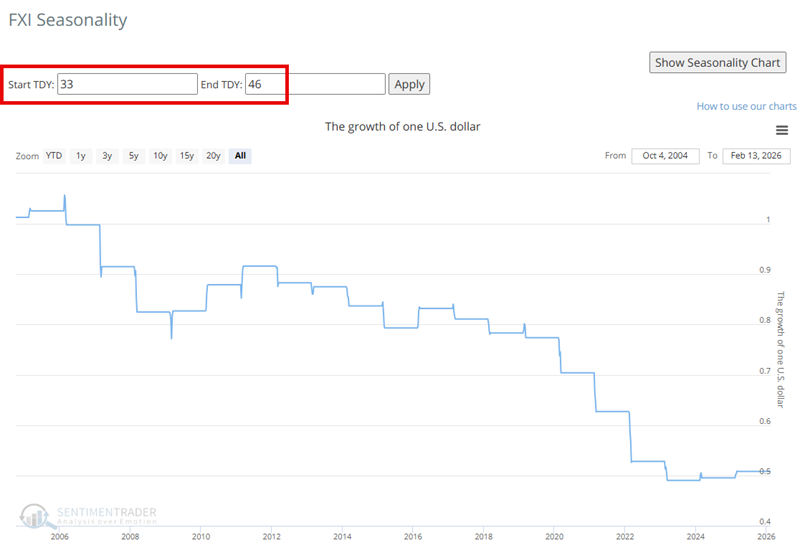
The chart below displays the hypothetical growth of $1 invested in FXI only during this period since 2005. The cumulative loss equals -49%.
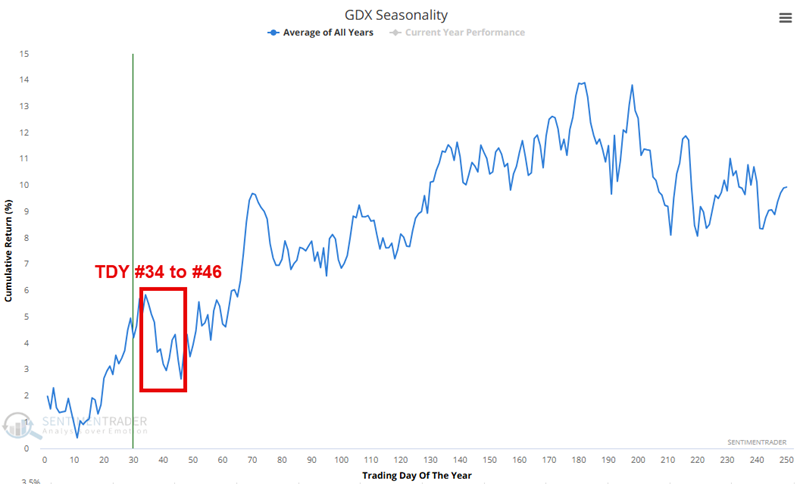
Market #5: Gold Miners (GDX)
The chart below shows the Annual Seasonal Trend for the VanEck Gold Miners ETF (GDX). An unfavorable period extends from the close on Trading Day of the Year (TDY) #34 through TDY #46. For 2026, this period runs from the close on February 20th through March 10th.
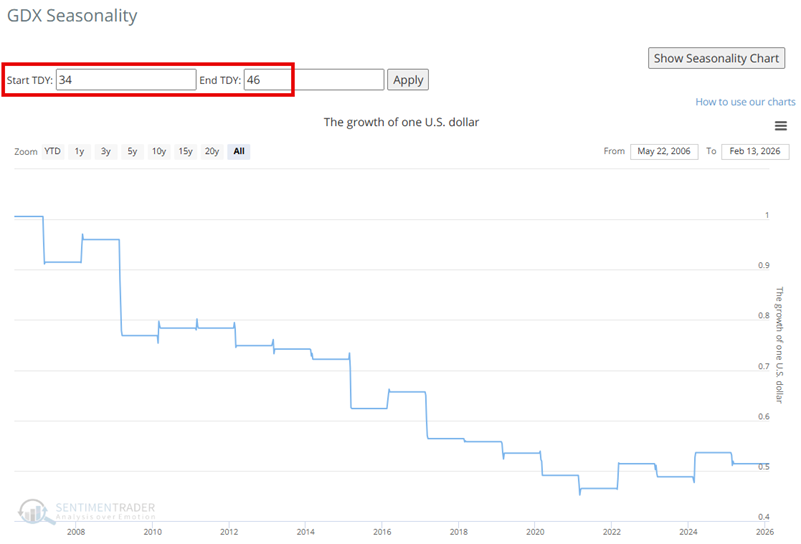
The chart below displays the hypothetical growth of $1 invested in GDX only during this period since 2007. The cumulative loss equals -48%.
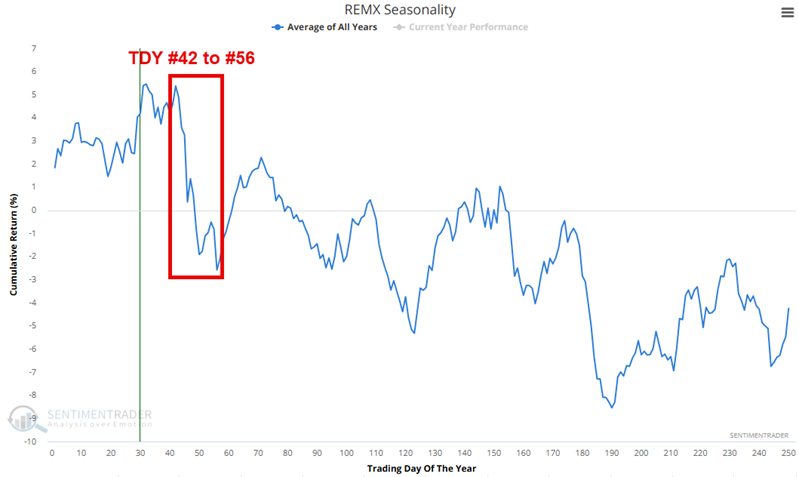
Market #6: Strategic Metals (REMX)
The chart below shows the Annual Seasonal Trend for the VanEck Rare Earth and Strategic Metals ETF (REMX). An unfavorable period extends from the close on Trading Day of the Year (TDY) #42 through TDY #56. For 2026, this period runs from the close on March 4th through March 24th.
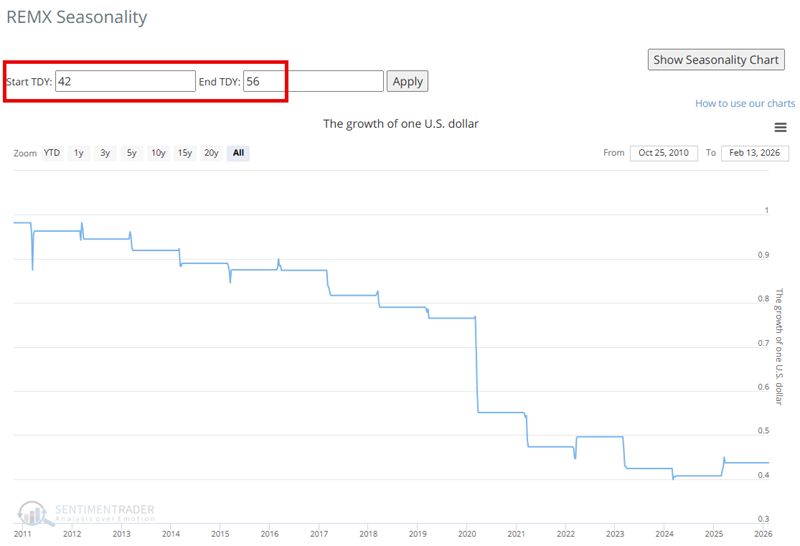
The chart below displays the hypothetical growth of $1 invested in REMX only during this period since 2011. The cumulative loss equals -56%.
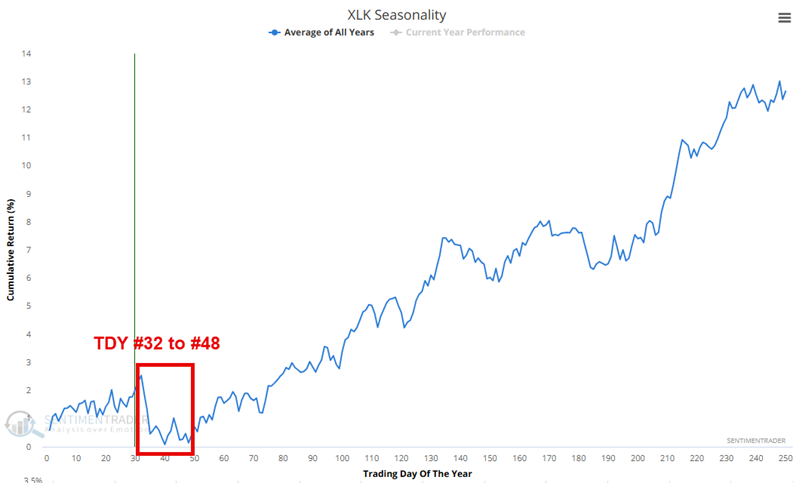
Market #7: Technology Sector (XLK)
The chart below shows the Annual Seasonal Trend for the State Street Technology Select Sector SPDR ETF (XLK). An unfavorable period extends from the close on Trading Day of the Year (TDY) #32 through TDY #48. For 2026, this period runs from the close on February 18th through March 12th.
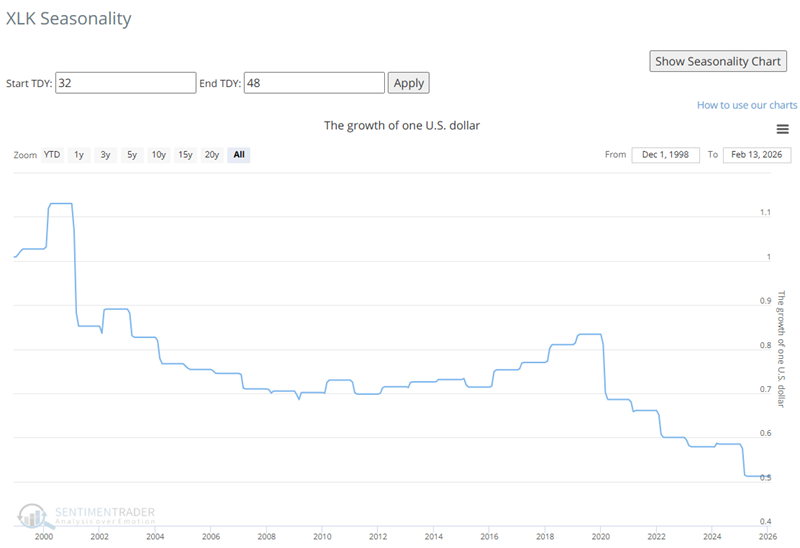
The chart below displays the hypothetical growth of $1 invested in XLK only during this period since 1999. The cumulative loss equals -35%.
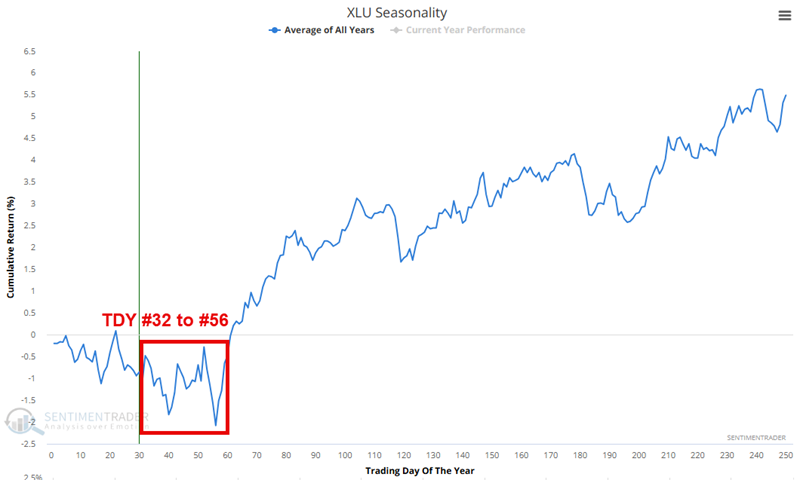
Market #8: Utilities Sector (XLU)
The chart below shows the Annual Seasonal Trend for the State Street Utilities Select Sector SPDR ETF (XLU). An unfavorable period extends from the close on Trading Day of the Year (TDY) #32 through TDY #56. For 2026, this period runs from the close on February 18th through March 24th.
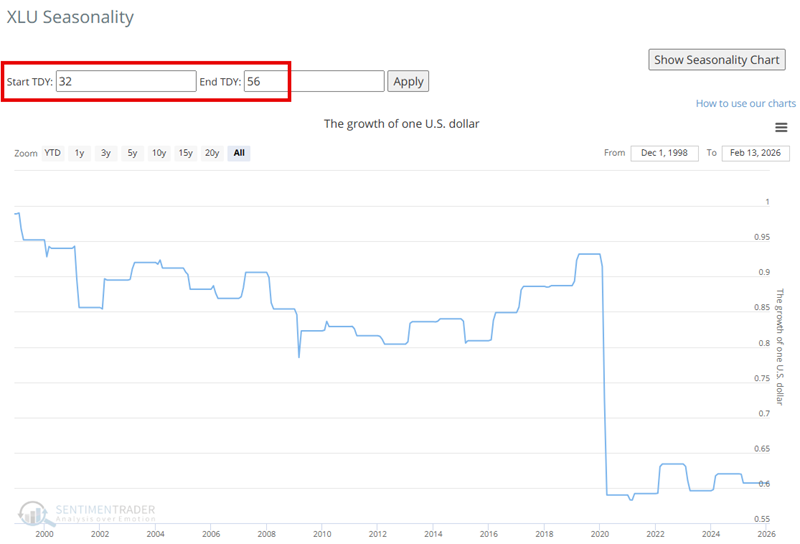
The chart below displays the hypothetical growth of $1 invested in XLU only during this period since 1999. The cumulative loss equals -39%.
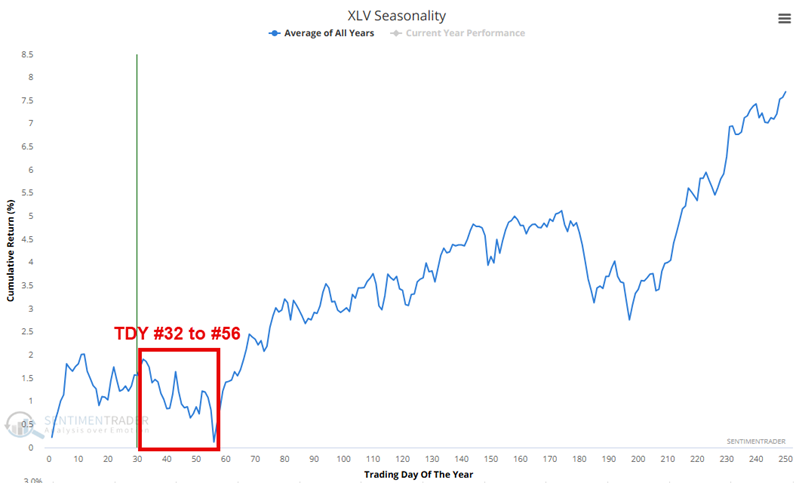
Market #9: Healthcare Sector (SPY)
The chart below shows the Annual Seasonal Trend for the State Street Health Care Select Sector SPDR ETF (XLV). An unfavorable period extends from the close on Trading Day of the Year (TDY) #32 through TDY #56. For 2026, this period runs from the close on February 18th through March 24th.
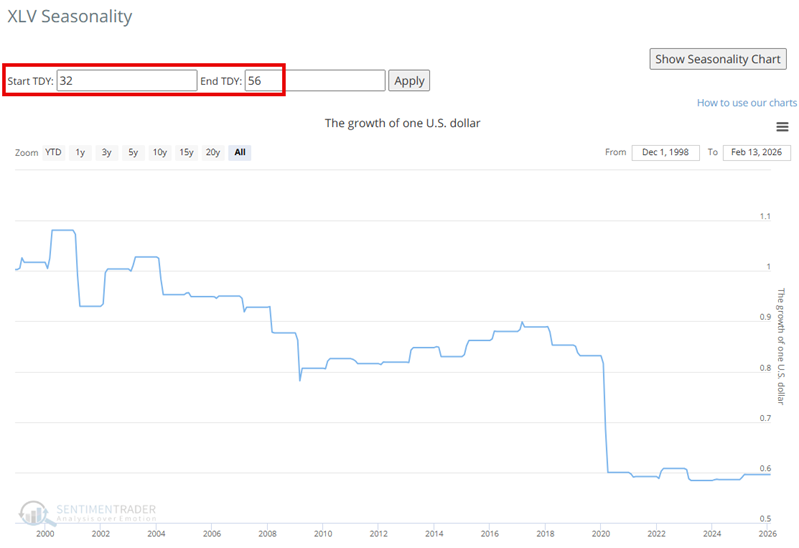
The chart below displays the hypothetical growth of $1 invested in XLV only during this period since 1999. The cumulative loss equals -40%.
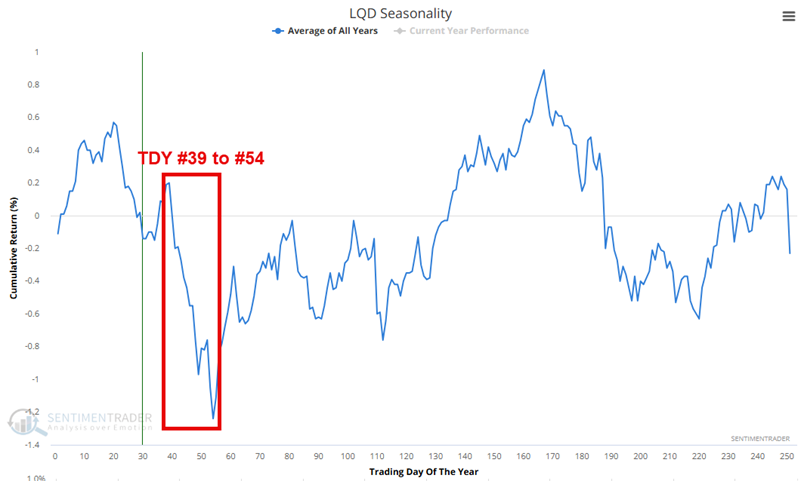
Market #10: Corporate Bonds (LQD)
The chart below shows the Annual Seasonal Trend for the iShares iBoxx $ Investment Grade Corporate Bond ETF (LQD). An unfavorable period extends from the close on Trading Day of the Year (TDY) #39 through TDY #54. For 2026, this period runs from the close on February 27th through March 20th.
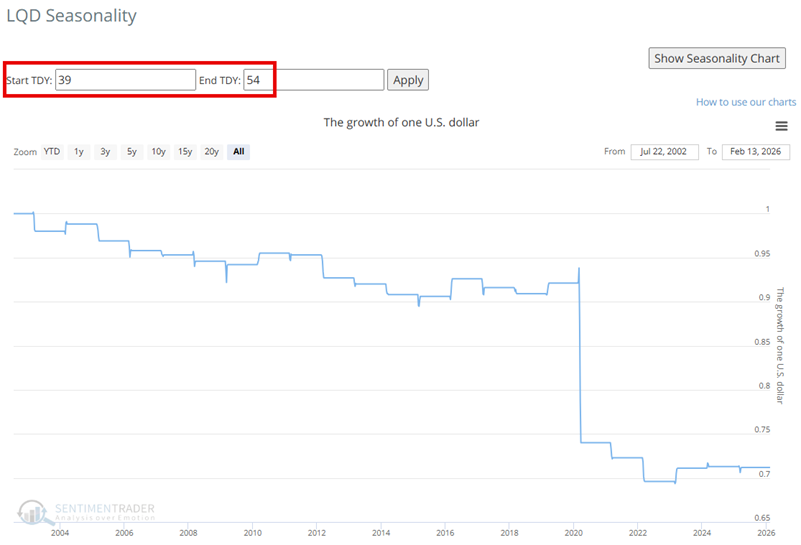
The chart below displays the hypothetical growth of $1 invested in LQD only during this period since 2003. The cumulative loss equals -29%.
What the research tells us…
The table below summarizes the information above.
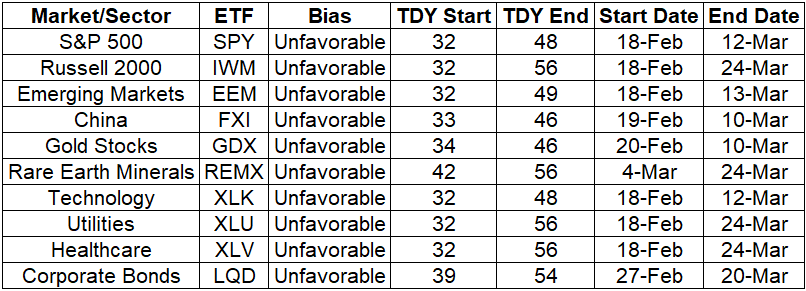
Remember that the dates listed in the table above should not be considered "automatic" buy or sell dates, but rather periods when investors should be prepared for weakness, and traders might consider playing the short side (either selling short shares or trading options).
As always, seasonality is ultimately a look back at what has happened in the past, not a roadmap for what will happen in the future. As a result, traders must remember that even the most historically persistent seasonal trend can fail the next time around. With those thoughts in mind, longer-term investors must carefully consider whether they wish to hold a long position in the sectors and markets highlighted above. Historical probabilities suggest diminished short-term expectations. Likewise, shorter-term traders must decide if they are willing to assume the risk of a counter-trend position, as most of the underlying markets/sectors highlighted above are presently in established uptrends. In any event, regardless of the setup that triggers any trade, a trader is never relieved of their responsibility to a) intelligently allocate capital (i.e., never "bet the ranch"), and b) ruthlessly manage risk.