Products
SentimenTrader Trading Tools
‍
Backtest Engine
My Trading Toolkit
Correlation Analysis
Seasonality
Market Prediction
Indicators & Data API
‍
Proprietary Indicators & Charts
Market Data API
Strategies & Scanner
‍
50+ Trading Strategies
Smart Stock Scanner
Smart Option Scanner
Research Reports
‍
Research Solutions
Reports Library
Free Resources
Simple Backtest Calculator
Simple Seasonality Calculator
The Kelly Criterion Calculator
Sentiment Geo Map
Public Research Reports
Education
Sentiment Indicators
Technical Indicators
Pricing
Company
About
In the News
Testimonials
Client Success Stories
Contact
Log inLoginSign up
< BACK TO ALL REPORTS

A Period of Interest for Short-Term Stock Index Traders

Jay Kaeppel
2025-11-20
Short-term traders should note that the S&P 500 has shown a tendency to rally during the late November into early December period. We take a closer look at the historical record herein.

Key points

  • The fourth quarter tends to be favorable for the stock market
  • Specific periods within the fourth quarter have shown to be pretty consistent
  • One such period includes the late November/early December period

Defining the period

The period we will consider here encompasses the following:

  • The last six trading days of November
  • The first three trading days of December

For 2025, this period extends from the close on November 19th through December 3rd.

Measuring historical results

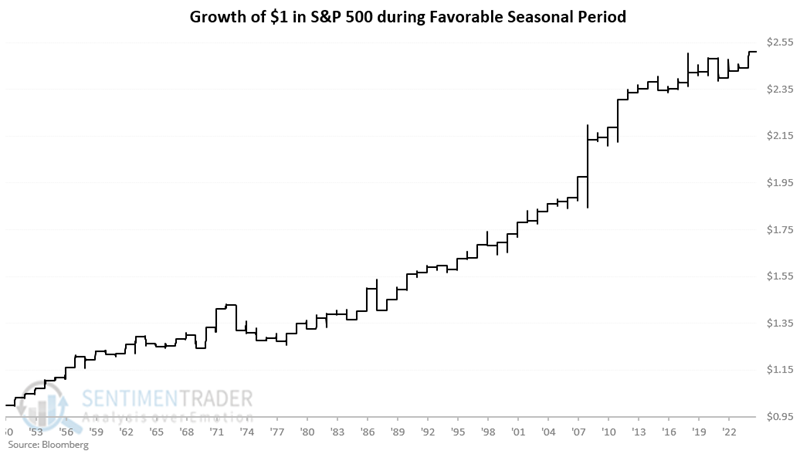
The chart below displays the hypothetical growth of $1 invested in the S&P 500 Index only during this nine-trading-day period every year starting in 1951.

The table below displays year-by-year results.

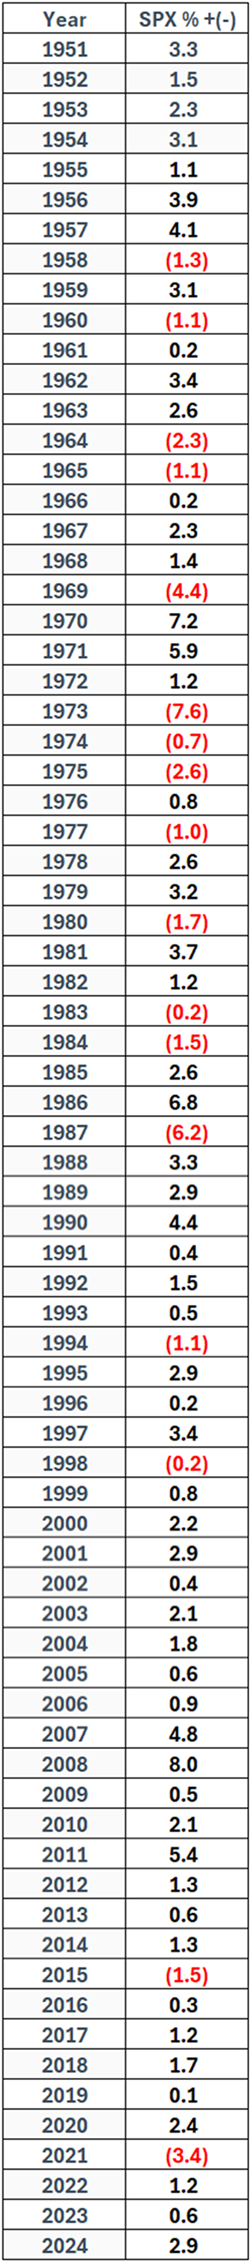
24 of the last 26 years - and 33 of the last 37 - have seen the S&P 500 gain ground during this nine-day period. The table below summarizes S&P 500 performance during this nine-trading-day period.

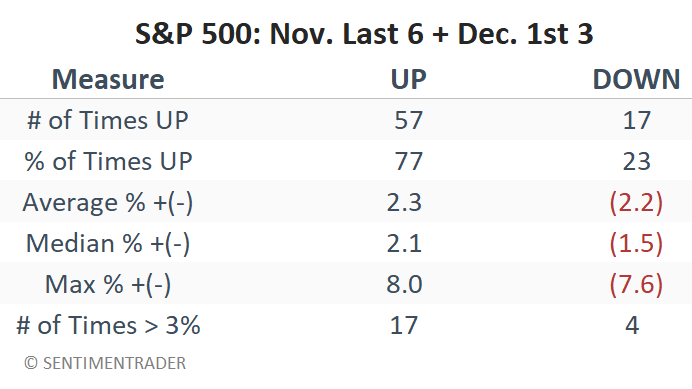
Note that the worst loss (so far) for this period was -7.6% in 1973 - presumably a manageable amount for most traders. Also note that periods with movements of 3% or more, skewed to the positive side, by a factor of 17-to-4.

What the research tells us…

Favorable odds do not guarantee success; they merely highlight a potential edge. The good news in this instance is that the S&P 500 has historically performed well during the late November to early December period. The bad news is that there is no guarantee that things will follow suit in 2025. Is there anything "sure thing" about this period? Absolutely not. Are there any number of reasons that the stock market might decline over the next nine trading days? Of course. Still, the numbers are what they are, and they suggest a long-term edge during a short-term trading period. As such, aggressive short-term traders might consider giving the bullish case the benefit of the doubt in the days ahead (with reasonable risk management measures in place). Investors with cash to invest may consider doing so sooner rather than later, while those looking to lighten their stock holdings might consider waiting a little longer.

PRODUCTS
SentimenTrader
Trading Tools
Indicators & Data API
‍
Strategies & Scanner
‍
Research Reports
FREE
RESOUrCES
Simple Backtest
Calculator
Simple Seasonality
Calculator
The Kelly Criterion
Calculator
Sentiment Geo Map
‍
Public Research Reports
‍
Education
Sentiment Indicators
‍
Technical Indicators
‍
Pricing
Bundle pricing
‍
FAQ
‍
Announcements
‍
COMPANY
‍
About
‍
In the News
‍
Testimonials
‍
Client Success Stories
CONTACT
‍
General Inquiries
‍
Media Inquiries
‍
Financial Professionals Inquiries
‍
© 2026 Sundial Capital Research Inc. All rights reserved.
Setsail Marketing
TermsPrivacyAffiliate Program
Risk Disclosure: The information and tools provided are for research and analytical purposes only and are not intended as investment advice. Market analysis involves uncertainty, and outcomes may differ from expectations. Users should conduct their own due diligence and consider their individual circumstances before making any financial decisions. Past performance is not necessarily indicative of future results.

Hypothetical Performance Disclosure: Hypothetical performance results have many inherent limitations, some of which are described below. No representation is being made that any account will or is likely to achieve profits or losses similar to those shown; in fact, there are frequently sharp differences between hypothetical performance results and the actual results subsequently achieved by any particular trading program. One of the limitations of hypothetical performance results is that they are generally prepared with the benefit of hindsight. In addition, hypothetical trading does not involve financial risk, and no hypothetical trading record can completely account for the impact of financial risk of actual trading. for example, the ability to withstand losses or to adhere to a particular trading program in spite of trading losses are material points which can also adversely affect actual trading results. There are numerous other factors related to the markets in general or to the implementation of any specific trading program which cannot be fully accounted for in the preparation of hypothetical performance results and all which can adversely affect trading results.

Testimonial Disclosure: Testimonials appearing on this website may not be representative of other clients or customers and is not a guarantee of future performance or success.