Products
SentimenTrader Trading Tools
‍
Backtest Engine
My Trading Toolkit
Correlation Analysis
Seasonality
Indicators & Data API
‍
Proprietary Indicators & Charts
Market Data API
Strategies & Scanner
‍
50+ Trading Strategies
Smart Stock Scanner
Research Reports
‍
Research Solutions
Reports Library
Free Resources
Simple Backtest Calculator
Simple Seasonality Calculator
The Kelly Criterion Calculator
Sentiment Geo Map
Public Research Reports
Pricing
Company
About
In the News
Testimonials
Client Success Stories
Contact
Log inLoginSign up
< BACK TO ALL REPORTS

A Perfect Technical Buy Signal

Jason Goepfert
2019-05-23
null

Earnings approach peak

Since last fall, earnings among S&P 500 companies have been in a pullback. A recent trend higher has nearly erased that and they’re closer to their peak than they’ve been in six months.

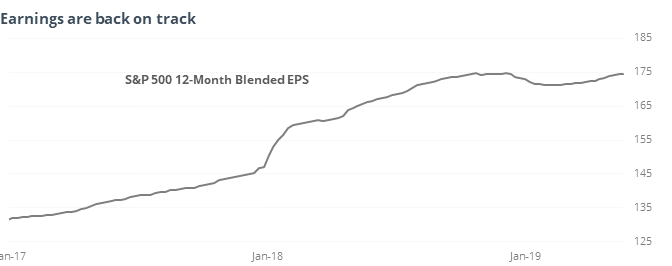
After other times earnings near their peak after several months, stocks performed well.

A technical buy signal

The MACD indicator isn’t as well-known as some, though it’s still popular among many technicians. On a weekly time frame, the indicator has cycled from persistent downside momentum to persistent upside momentum.

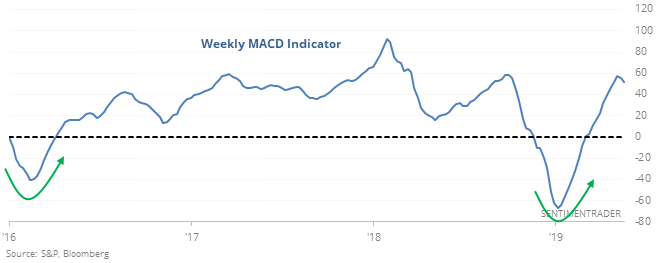
Every time it’s done that since 1950, stocks rose over the next 1-2 years. Prior to 1950, there were several losers out of the 7 signals, and while they may not be as comparable to more recent time periods, it’s a bit of a damper on what otherwise looks to be a decent sign.

More outflow

According to the ICI, investors have pulled more than $30 billion from domestic funds over the past four weeks. Excluding October 2008, the S&P was higher three months after all 14 of the other weeks.

Copper panned

Copper futures fell more than 1% to an 80-day low. Of the 216 other times it’s done so since 1988, it usually continued lower. Six months later it was higher 49% of the time with an average return of -0.3% But its impact on stocks was nil – the S&P was higher 70% of the time.

Few calls

On the ISE exchange, traders bought only 55 calls for every 100 puts. The Backtest Engine shows that when there were this few calls, three months later the S&P 500 gained after 39 of 43 days.

This post was an abridged version of our previous day's Daily Report. For full access, sign up for a 30-day free trial now.

PRODUCTS
SentimenTrader
Trading Tools
Indicators & Data API
‍
Strategies & Scanner
‍
Research Reports
FREE
RESOUrCES
Simple Backtest
Calculator
Simple Seasonality
Calculator
The Kelly Criterion
Calculator
Sentiment Geo Map
‍
Public Research Reports
‍
Pricing
Bundle pricing
‍
Announcements
‍
FAQ
COMPANY
‍
About
‍
In the News
‍
Testimonials
‍
Client Success Stories
CONTACT
‍
General Inquiries
‍
Media Inquiries
‍
Financial Professionals Inquiries
‍
© 2025 Sundial Capital Research Inc. All rights reserved.
Setsail Marketing
TermsPrivacyAffiliate Program
Risk Disclosure: Futures and forex trading contains substantial risk and is not for every investor. An investor could potentially lose all or more than the initial investment. Risk capital is money that can be lost without jeopardizing ones’ financial security or life style. Only risk capital should be used for trading and only those with sufficient risk capital should consider trading. Past performance is not necessarily indicative of future results.

Hypothetical Performance Disclosure: Hypothetical performance results have many inherent limitations, some of which are described below. No representation is being made that any account will or is likely to achieve profits or losses similar to those shown; in fact, there are frequently sharp differences between hypothetical performance results and the actual results subsequently achieved by any particular trading program. One of the limitations of hypothetical performance results is that they are generally prepared with the benefit of hindsight. In addition, hypothetical trading does not involve financial risk, and no hypothetical trading record can completely account for the impact of financial risk of actual trading. for example, the ability to withstand losses or to adhere to a particular trading program in spite of trading losses are material points which can also adversely affect actual trading results. There are numerous other factors related to the markets in general or to the implementation of any specific trading program which cannot be fully accounted for in the preparation of hypothetical performance results and all which can adversely affect trading results.

Testimonial Disclosure: Testimonials appearing on this website may not be representative of other clients or customers and is not a guarantee of future performance or success.