Products
SentimenTrader Trading Tools
‍
Backtest Engine
My Trading Toolkit
Correlation Analysis
Seasonality
Market Prediction
Indicators & Data API
‍
Proprietary Indicators & Charts
Market Data API
Strategies & Scanner
‍
50+ Trading Strategies
Smart Stock Scanner
Smart Option Scanner
Research Reports
‍
Research Solutions
Reports Library
Free Resources
Simple Backtest Calculator
Simple Seasonality Calculator
The Kelly Criterion Calculator
Sentiment Geo Map
Public Research Reports
Education
Sentiment Indicators
Technical Indicators
Pricing
Company
About
In the News
Testimonials
Client Success Stories
Contact
Log inLoginSign up
< BACK TO ALL REPORTS

A "perfect" sector trend signal just triggered

Dean Christians
2025-07-31
The number of S&P 500 sectors trading above their 200-day average has cycled from 0 to 10. Comparable trend shifts saw the S&P 500 rally 100% of the time over the next six months, with muted drawdowns.

Key points: 

  • All but one equal and cap-weighted S&P 500 sectors closed above their 200-day averages 
  • Similar conditions saw the S&P 500 rally 100% of the time over the subsequent six months
  • Cyclical sectors tended to outperform, led by discretionary, industrials, and technology

Additional confirmation of a supportive environment 

Stocks continue to see a broad and sustained shift toward bullish trend conditions.

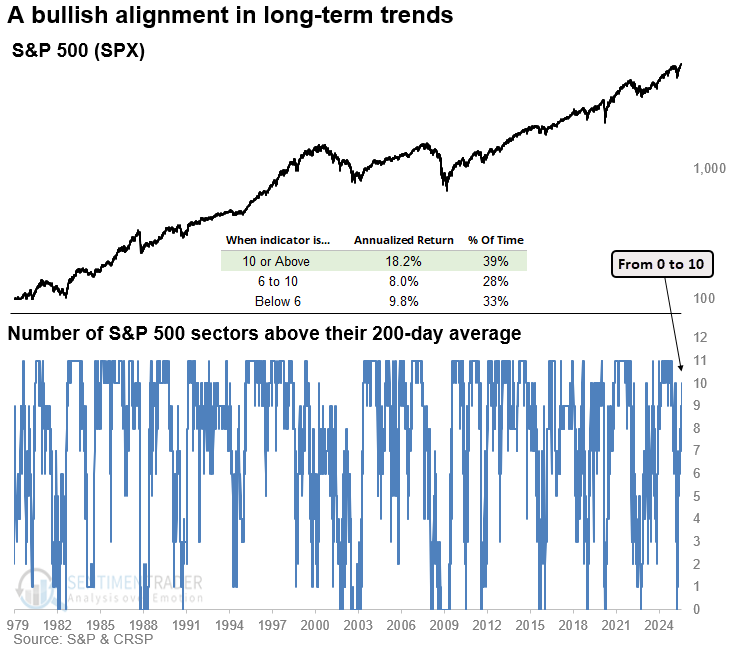
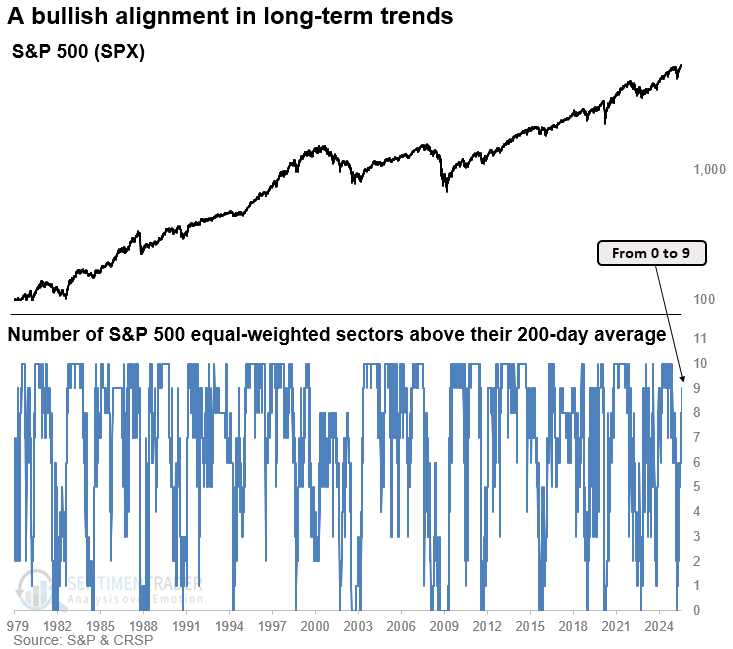
Every S&P 500 sector except health care has closed above its 200-day moving average. This kind of alignment is particularly encouraging after a period when none of the sectors were trading above their 200-day averages.

As shown in the chart below, the S&P 500 delivered an annualized return of 18.2% when at least 10 sectors traded above their 200-day average, significantly outperforming periods with fewer groups above that threshold. 

Outstanding returns

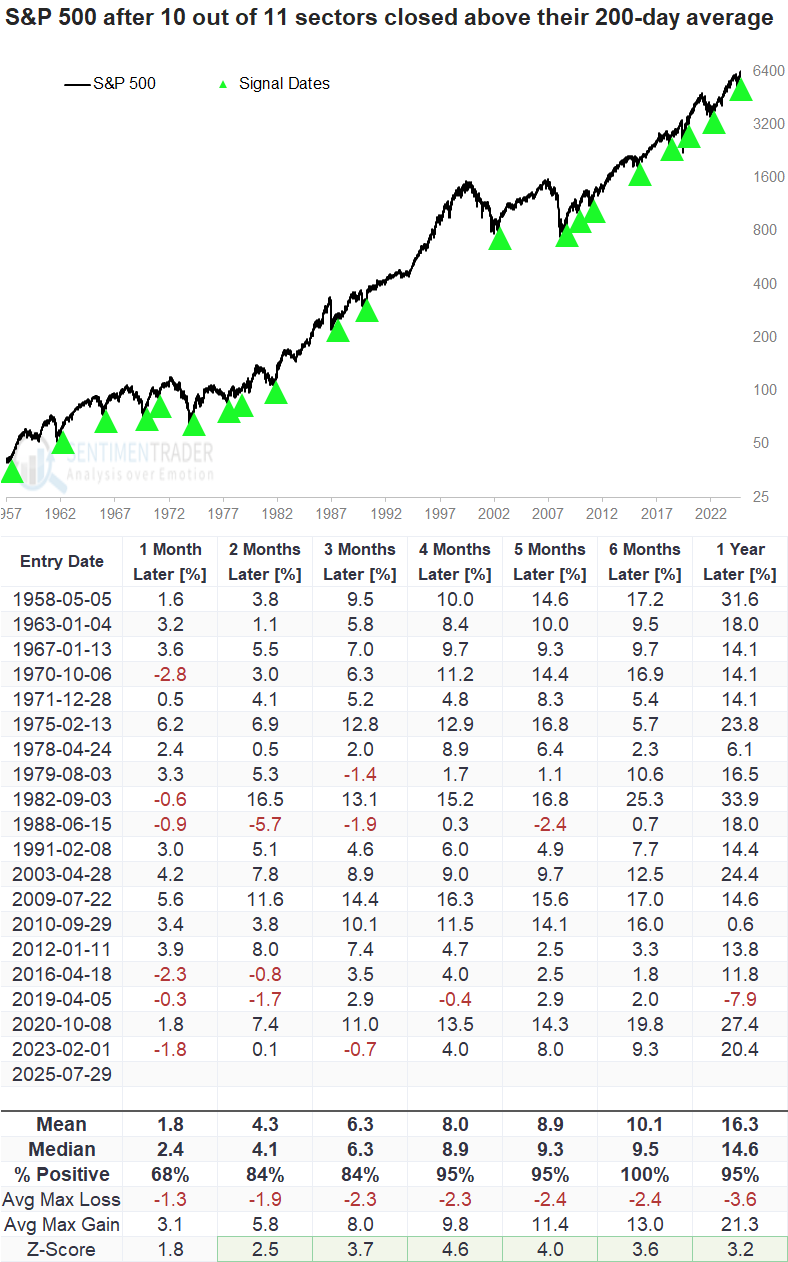
Whenever the number of S&P 500 sectors above their 200-day average rose from 0 to 10, the index delivered exceptional returns and consistency over the following year, with a flawless track record at the six-month mark.

It's worth noting that none of those prior instances occurred with the index having recorded an all-time high, although 1991, 2016, 2019, and 2020 were relatively close. 

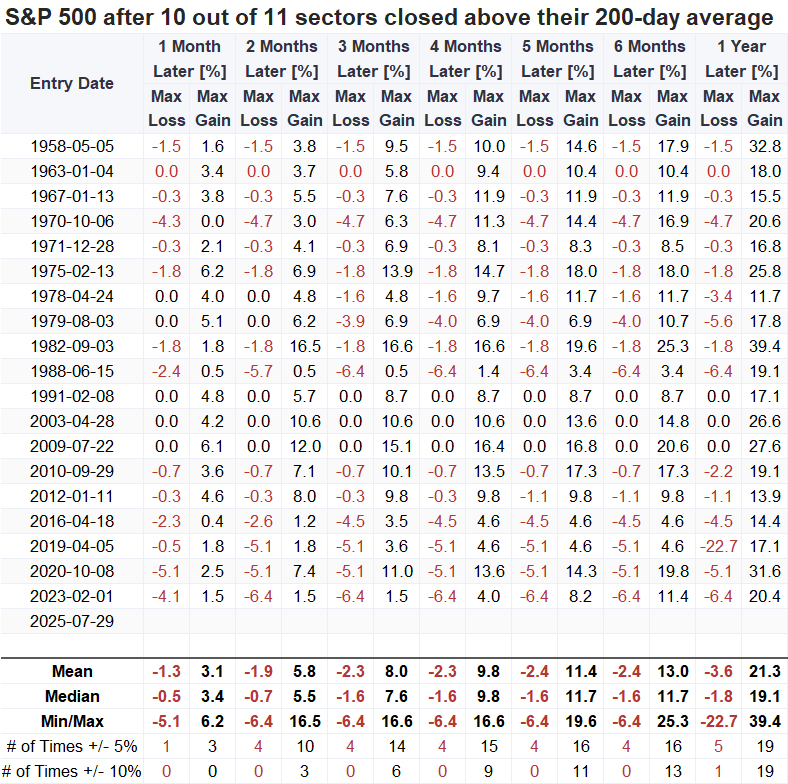
Within the following year, the S&P 500 saw only a single maximum loss of more than 10%, while nineteen signals produced double-digit gains. Remarkably, in 1991, 2003, and 2009, the index never declined during the entire twelve-month period. 

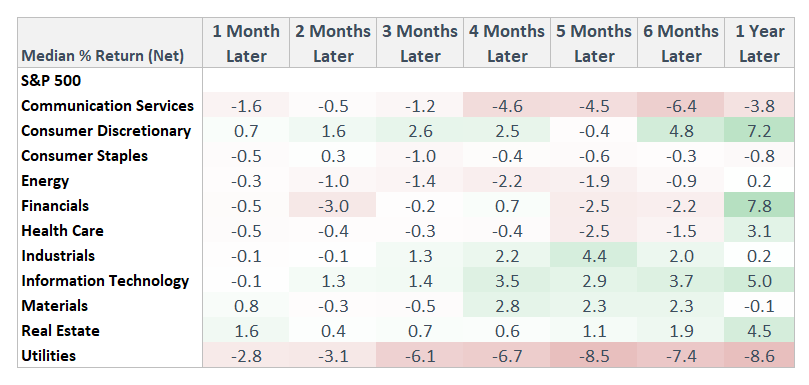
Given that most signals emerge after bear markets tied to recessions, it's no surprise that early-cycle offensive sectors tended to lead the market higher over the next year. 

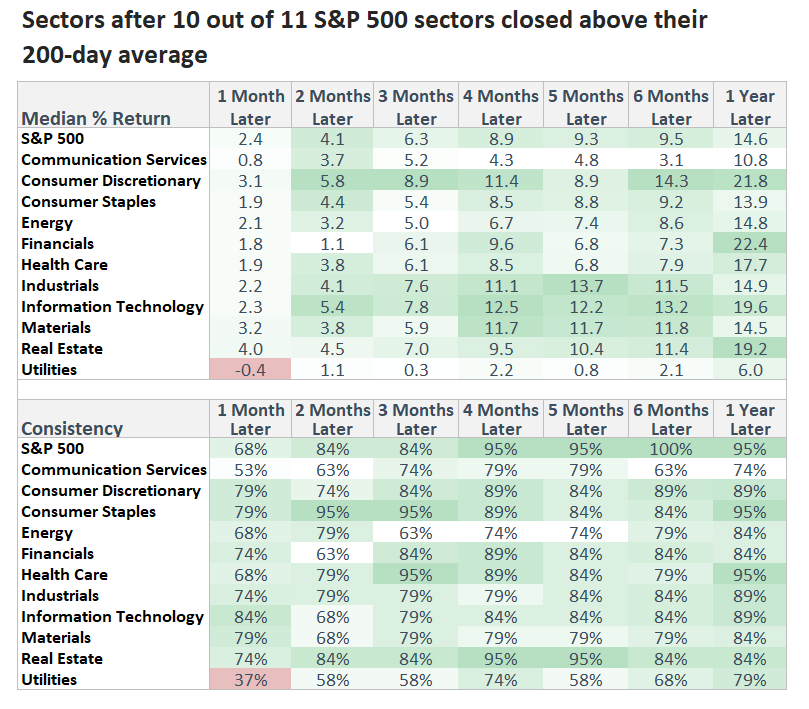
Measuring the net difference between a sector and the S&P 500 enhances the clarity of cyclical sector performance trends versus the broad index. With industrials and technology currently exhibiting relative strength, history suggests staying with these leaders. 

Bullish trends for equal-weighted sectors

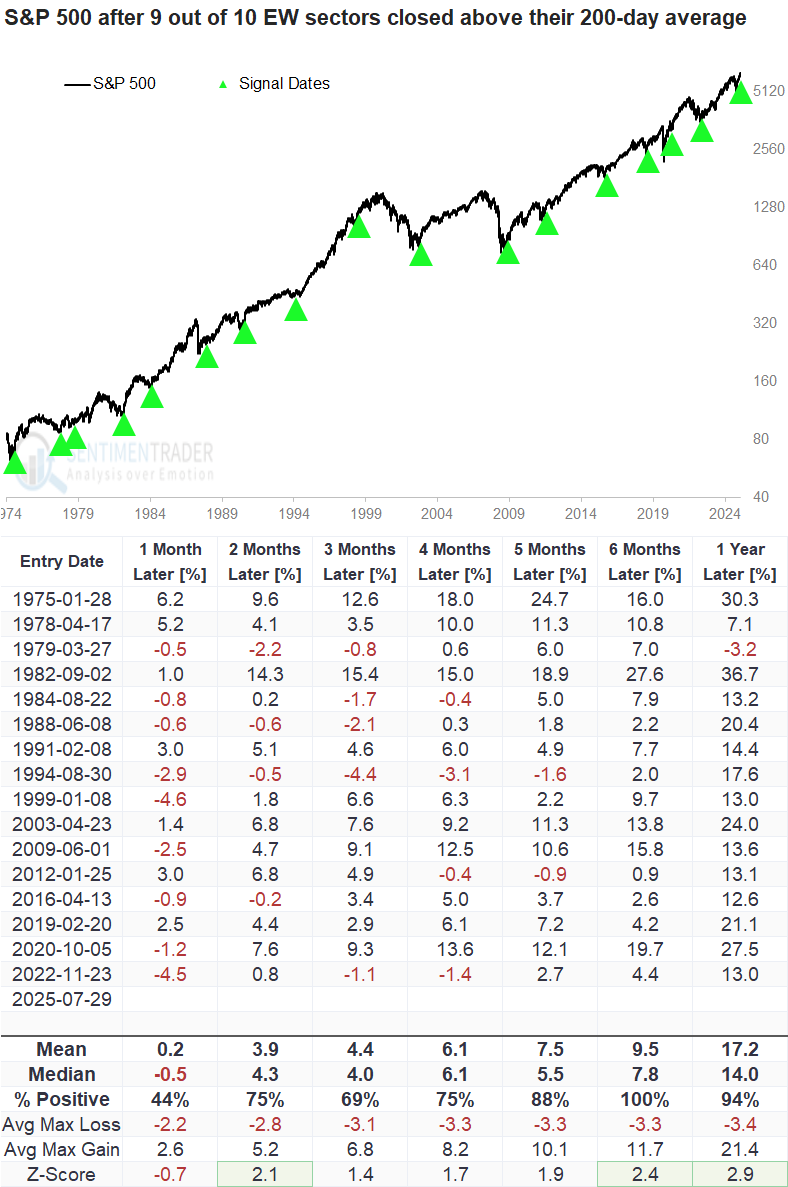
Among the equal-weighted sectors, with data available for all but real estate, 9 out of 10 closed above their 200-day moving average. That's an indication of broad strength, and when we've seen the sector count climb from 0 to 9 in the past, the S&P 500 has tended to shine. 

Over the next six months, the S&P 500 rallied without exception, echoing what we saw in the cap-weighted analysis. That said, the initial three months were not as impressive, especially at the one-month mark. 1999 was the last time a signal coincided with an all-time high.

What the research tells us...

The near-uniformity among equal and cap-weighted sectors trading above their 200-day moving averages is a strong sign of broad participation. Such synchronized trend conditions have historically aligned with sustained advances. The world's most benchmarked equity index rallied 100% of the time over the following six months with muted drawdowns. Cyclical sectors like consumer discretionary, industrial, and technology mostly outperformed the S&P 500.

PRODUCTS
SentimenTrader
Trading Tools
Indicators & Data API
‍
Strategies & Scanner
‍
Research Reports
FREE
RESOUrCES
Simple Backtest
Calculator
Simple Seasonality
Calculator
The Kelly Criterion
Calculator
Sentiment Geo Map
‍
Public Research Reports
‍
Education
Sentiment Indicators
‍
Technical Indicators
‍
Pricing
Bundle pricing
‍
FAQ
‍
Announcements
‍
COMPANY
‍
About
‍
In the News
‍
Testimonials
‍
Client Success Stories
CONTACT
‍
General Inquiries
‍
Media Inquiries
‍
Financial Professionals Inquiries
‍
© 2026 Sundial Capital Research Inc. All rights reserved.
Setsail Marketing
TermsPrivacyAffiliate Program
Risk Disclosure: The information and tools provided are for research and analytical purposes only and are not intended as investment advice. Market analysis involves uncertainty, and outcomes may differ from expectations. Users should conduct their own due diligence and consider their individual circumstances before making any financial decisions. Past performance is not necessarily indicative of future results.

Hypothetical Performance Disclosure: Hypothetical performance results have many inherent limitations, some of which are described below. No representation is being made that any account will or is likely to achieve profits or losses similar to those shown; in fact, there are frequently sharp differences between hypothetical performance results and the actual results subsequently achieved by any particular trading program. One of the limitations of hypothetical performance results is that they are generally prepared with the benefit of hindsight. In addition, hypothetical trading does not involve financial risk, and no hypothetical trading record can completely account for the impact of financial risk of actual trading. for example, the ability to withstand losses or to adhere to a particular trading program in spite of trading losses are material points which can also adversely affect actual trading results. There are numerous other factors related to the markets in general or to the implementation of any specific trading program which cannot be fully accounted for in the preparation of hypothetical performance results and all which can adversely affect trading results.

Testimonial Disclosure: Testimonials appearing on this website may not be representative of other clients or customers and is not a guarantee of future performance or success.