
A notable breakout in the 10-year yield

Key points:
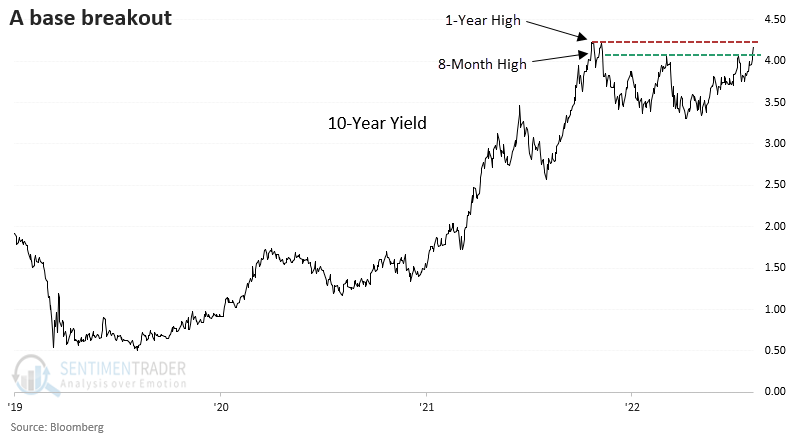
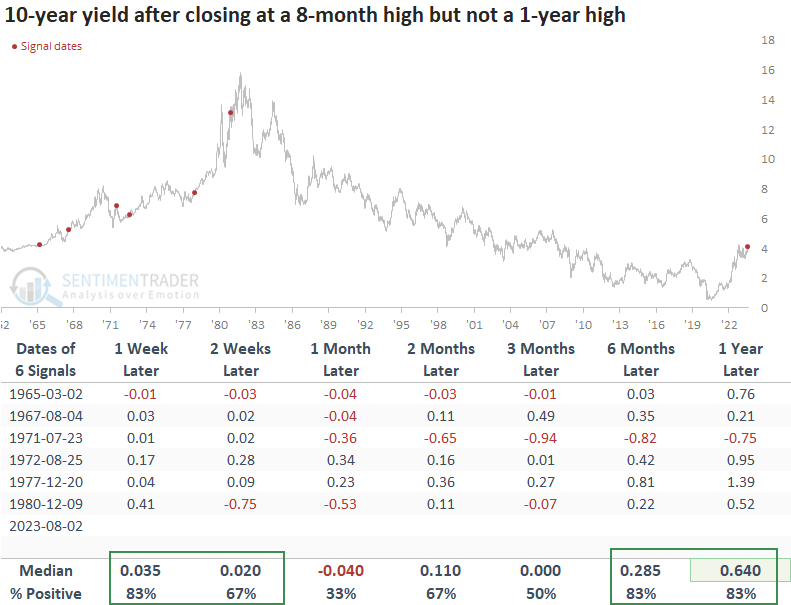
- The 10-year bond yield closed at an 8-month high but not a 1-year high
- Similar yield breakouts across different market regimes suggest near-term upside for the 10-year
- The S&P 500 tends to hit a soft patch over the next three months after similar yield conditions
What's the market message after a breakout in the 10-year yield?
Yields have been creeping higher of late, and as is typically the case, I see all kinds of narratives for why. Whether a spike in crude oil, a resilient economy, or a wave of Treasury issuance, the list goes on.
After consolidating since last October, the 10-year yield closed at an 8-month high but not a 1-year high. The consolidation period included a 6-month low in April 2023, so I used that condition for additional context. i.e., a new signal cannot trigger again unless a 6-month low occurs.
Let's assess the outlook for the 10-year yield and the S&P 500 after comparable breakout conditions in different market environments.
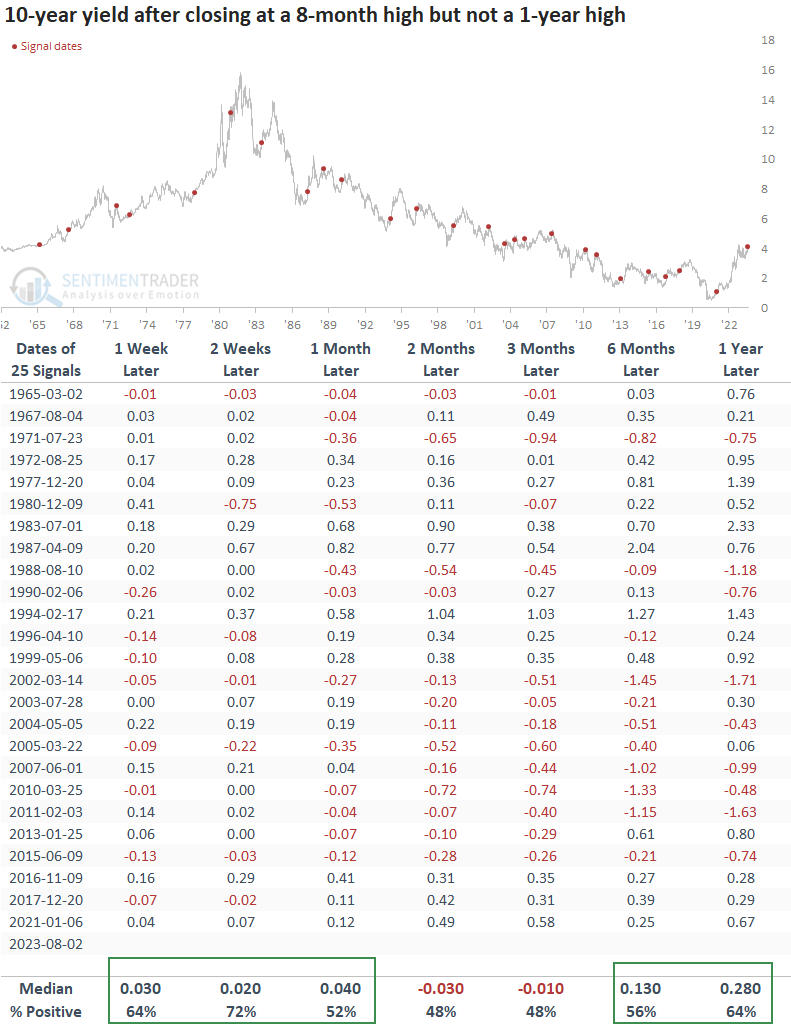
Similar base breakouts led to some near-term upside
Based on historical trends, the 10-year yield may experience a gradual increase in the coming month, only to retrace some of those gains over a medium-term time frame. The twelve-month rising rate outlook is interesting because most signals occurred in a falling rate environment between 1981 and 2019.
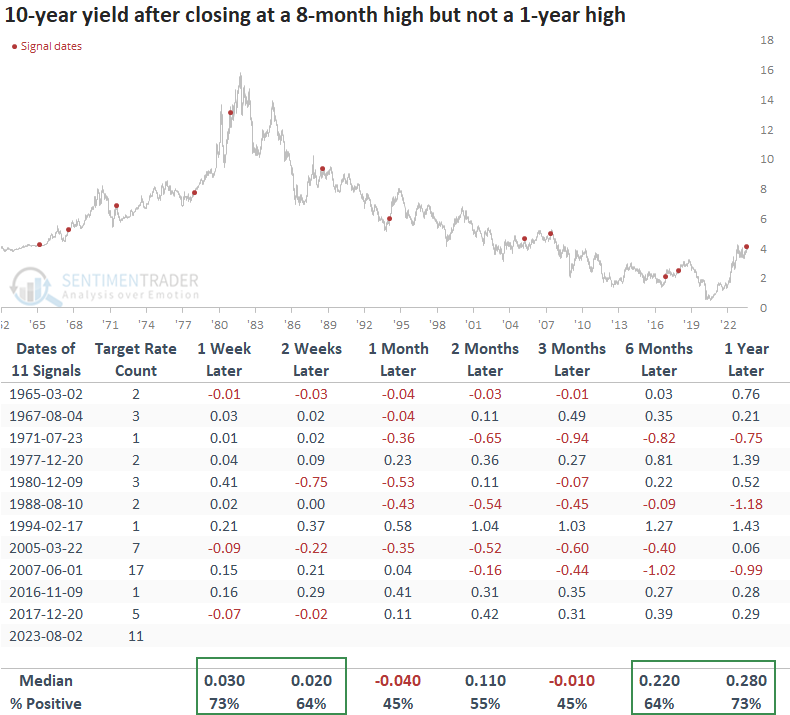
FOMC Tightening Cycle
The yield outlook when the FOMC is tightening policy looks very similar to the trends in the outlook table that contains all signals. Some upside over the near term, followed by flat yields and another increase over longer horizons.
Unfortunately, only one instance occurred with a somewhat comparable number of target rate increases.
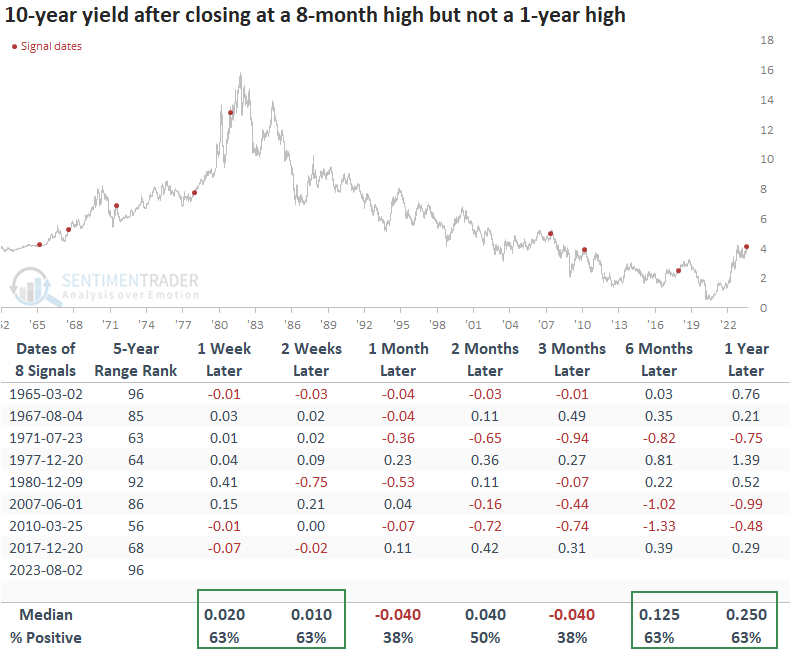
5-Year Range
Suppose I isolate signals that occurred when the 10-year yield closed in the 50th percentile or greater of its 5-year range. In that case, the outlook for the 10-year yield looks similar to the other market environments: an initial upward trend in the short run, followed by a stable-to-declining yield in the medium-term, and another ascent over the more extended time frames.
Secular Uptrend in Yields
If you're concerned that Treasury yields have entered a new secular uptrend similar to 1945-1981, the yield pattern in uptrends still looks almost identical to the other periods. However, the 10-year could show a more meaningful increase under this scenario over the longer time horizons.
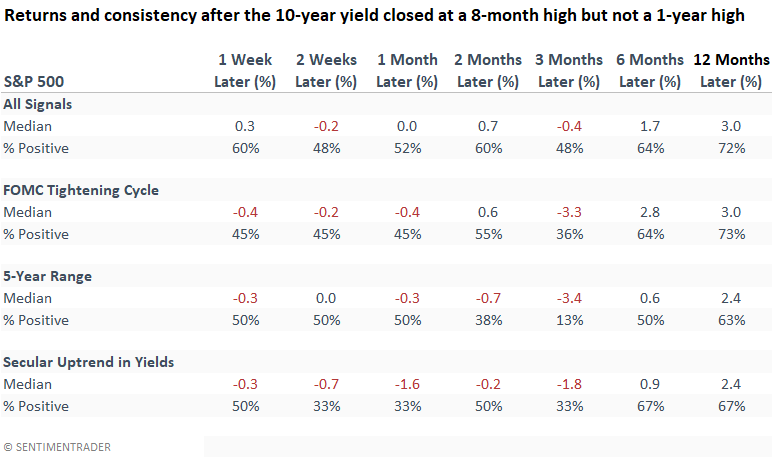
What about the stocks?
Regardless of the type of market regime, the base breakout in the 10-year yield suggests stocks could hit a soft patch over the next three months. While positive, returns show below-average results over the next six and twelve months.
What the research tells us...
While other factors contributed to the 2022 drawdown, the relentless rise in Treasury yields played a pivotal role in creating an unfavorable environment for stocks, especially for Technology stocks. So, we need to be attentive to the market message now that the 10-year yield has closed at a new 8-month high. History suggests the 10-year can continue to rise in the near term, which could impact stocks over the next three months. Given rates and seasonality, a consolidation that refreshes the uptrend in stocks would not be surprising.