Products
SentimenTrader Trading Tools
‍
Backtest Engine
My Trading Toolkit
Correlation Analysis
Seasonality
Market Prediction
Indicators & Data API
‍
Proprietary Indicators & Charts
Market Data API
Strategies & Scanner
‍
50+ Trading Strategies
Smart Stock Scanner
Smart Option Scanner
Research Reports
‍
Research Solutions
Reports Library
Free Resources
Simple Backtest Calculator
Simple Seasonality Calculator
The Kelly Criterion Calculator
Sentiment Geo Map
Public Research Reports
Education
Sentiment Indicators
Technical Indicators
Pricing
Company
About
In the News
Testimonials
Client Success Stories
Contact
Log inLoginSign up
< BACK TO ALL REPORTS

A Non-Recessionary Correction; The Trend Is No Longer Your Friend

Jason Goepfert
2018-10-29
null

This is an abridged version of our Daily Report.

Non-recessionary pullback

Most recession models show a low probability of an imminent economic recession. If we use a simple, non-optimized, real-time model, it’s currently showing 0% probability.

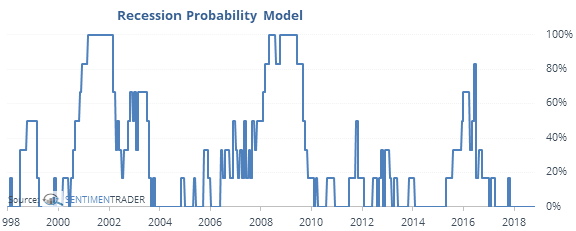
In that kind of environment, 10% pullbacks in stocks have generated strong returns with one major exception.

There are all kinds of recession-forecasting services out there, and a smattering of them are showing either a rising or outright high risk of imminent recession. The ones we’ve used in the past are showing basically the same as we are here, with a negligible probability of falling into one anytime within the next 6-12 months.

When that’s the case, these 10% pullbacks ended up getting erased with a fresh 52-week high about 20% faster than they did when the recession probability was non-zero.

The trend is no longer your friend

The S&P’s 200-day average is starting to roll over, ending a long positive streak. Its run of more than 600 days with a positive slope was one of the longest since 1928.

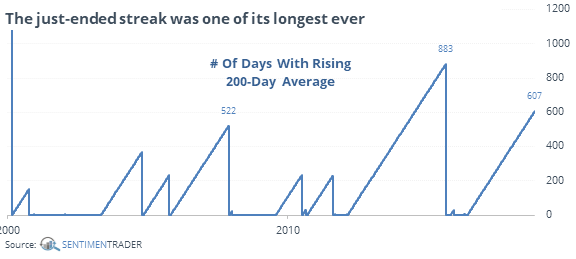
The ends of other streaks led to decent short- to medium-term returns, even when longer-term returns ended up being terrible. While the sample size is small – we don’t often get to enjoy uninterrupted uptrends for this long – most of the others saw some kind of rebound over the shorter-term. Two weeks later, there were only two losses, and one of those was tiny.

The latest Commitments of Traders report was released, covering positions through Tuesday

The 3-Year Min/Max Screen shows only one new extreme, with hedgers moving to their largest long exposure to orange juice in years. They’ve been unwinding most of their other large long positions, such as in long-term Treasuries and gold.

Dumb is looking smart

This is the 12th time the S&P 500 has lost more than 1.5% the day after a Dumb Money Confidence reading below 21%. The only loss was -0.9% and was erased the next day.

PRODUCTS
SentimenTrader
Trading Tools
Indicators & Data API
‍
Strategies & Scanner
‍
Research Reports
FREE
RESOUrCES
Simple Backtest
Calculator
Simple Seasonality
Calculator
The Kelly Criterion
Calculator
Sentiment Geo Map
‍
Public Research Reports
‍
Education
Sentiment Indicators
‍
Technical Indicators
‍
Pricing
Bundle pricing
‍
FAQ
‍
Announcements
‍
COMPANY
‍
About
‍
In the News
‍
Testimonials
‍
Client Success Stories
CONTACT
‍
General Inquiries
‍
Media Inquiries
‍
Financial Professionals Inquiries
‍
© 2026 Sundial Capital Research Inc. All rights reserved.
Setsail Marketing
TermsPrivacyAffiliate Program
Risk Disclosure: The information and tools provided are for research and analytical purposes only and are not intended as investment advice. Market analysis involves uncertainty, and outcomes may differ from expectations. Users should conduct their own due diligence and consider their individual circumstances before making any financial decisions. Past performance is not necessarily indicative of future results.

Hypothetical Performance Disclosure: Hypothetical performance results have many inherent limitations, some of which are described below. No representation is being made that any account will or is likely to achieve profits or losses similar to those shown; in fact, there are frequently sharp differences between hypothetical performance results and the actual results subsequently achieved by any particular trading program. One of the limitations of hypothetical performance results is that they are generally prepared with the benefit of hindsight. In addition, hypothetical trading does not involve financial risk, and no hypothetical trading record can completely account for the impact of financial risk of actual trading. for example, the ability to withstand losses or to adhere to a particular trading program in spite of trading losses are material points which can also adversely affect actual trading results. There are numerous other factors related to the markets in general or to the implementation of any specific trading program which cannot be fully accounted for in the preparation of hypothetical performance results and all which can adversely affect trading results.

Testimonial Disclosure: Testimonials appearing on this website may not be representative of other clients or customers and is not a guarantee of future performance or success.